Upper Providence Township, PA (Pennsylvania) Houses and Residents
| Upper Providence Township: | $563,434 |
| Pennsylvania: | $245,500 |
Total population: 10,564 (Urban population: 10,509, Rural population: 0)
Houses: 4,299 (4,075 occupied: 3,065 owner occupied, 1,010 renter occupied)
| % of renters here: | 25% |
| State: | 31% |
Housing density: 769 houses/condos per square mile
Median price asked for vacant for-sale houses and condos in 2022 in this county: $246,679.
Median contract rent in 2022: $1,235 (lower quartile is $1,017, upper quartile is $1,534)
Median rent asked for vacant for-rent units in 2022: $3,786
Median gross rent in Upper Providence Township, PA in 2022: $1,330
Housing units in Upper Providence Township with a mortgage: 2,073 (171 second mortgage, 404 home equity loan, 4 both second mortgage and home equity loan)
Houses without a mortgage: 841
Compare current foreclosures near Upper Providence Township, PA:
| Photo | Address | Area | Beds / Baths | Price | Details |
|---|---|---|---|---|---|

|
#1
N 5th St
Philadelphia, PA 19126
|
1,420 sq. feet
|
2 baths 3 beds |
$313,900
|
show details |

|
#2
Harmer St
Philadelphia, PA 19131
|
1,134 sq. feet
|
1 baths 3 beds |
$70,000
|
show details |

|
#3
Jessamine Ave
Oaklyn, NJ 08107
|
864 sq. feet
|
2 baths 5 beds |
$399,900
|
show details |

|
#4
N Pine St
Wilmington, DE 19802
|
1,125 sq. feet
|
1 baths 3 beds |
$199,900
|
show details |

|
#5
Beechwood Rd
Clifton Heights, PA 19018
|
2,888 sq. feet
|
2 baths 4 beds |
$472,500
|
show details |

|
#6
Freeland Ave
Philadelphia, PA 19128
|
1,114 sq. feet
|
1 baths 3 beds |
$355,000
|
show details |

|
#7
Kershaw St
Philadelphia, PA 19131
|
1,284 sq. feet
|
1 baths 3 beds |
$139,900
|
show details |

|
#8
N Norman Ave
Penns Grove, NJ 08069
|
882 sq. feet
|
1 baths 2 beds |
$74,900
|
show details |

|
#9
N Front St Apt B
Philadelphia, PA 19123
|
2,491 sq. feet
|
2 baths 3 beds |
$677,500
|
show details |

|
#10
Mockingbird Ln
Swedesboro, NJ 08085
|
2,076 sq. feet
|
2 baths 4 beds |
$429,900
|
show details |
| Photo | Address | Area | Beds / Baths | Price | Details |
|---|---|---|---|---|---|

|
#11
N 10th St
Philadelphia, PA 19141
|
1,154 sq. feet
|
2 baths 2 beds |
$78,000
|
show details |

|
#12
N Philip St
Philadelphia, PA 19140
|
894 sq. feet
|
1 baths 3 beds |
$42,500
|
show details |

|
#13
Broadway
Westville, NJ 08093
|
1,548 sq. feet
|
1 baths 3 beds |
$259,900
|
show details |

|
#14
Cooper St
Woodbury, NJ 08096
|
936 sq. feet
|
1 baths 3 beds |
$264,900
|
show details |

|
#15
S Alden St
Philadelphia, PA 19143
|
1,185 sq. feet
|
1 baths 3 beds |
$74,900
|
show details |

|
#16
N Madison St Apt 106
Wilmington, DE 19801
|
1,000 sq. feet
|
2 baths 2 beds |
$159,900
|
show details |

|
#17
Christian St
Philadelphia, PA 19146
|
1,612 sq. feet
|
2 baths 5 beds |
$474,050
|
show details |

|
#18
S 8th St
Philadelphia, PA 19148
|
1,170 sq. feet
|
1 baths 3 beds |
$178,500
|
show details |

|
#19
Manchester Rd
Elkins Park, PA 19027
|
3,444 sq. feet
|
2 baths 3 beds |
$570,000
|
show details |

|
#20
Trinity St
Philadelphia, PA 19143
|
1,359 sq. feet
|
1 baths 3 beds |
$82,110
|
show details |
| Photo | Address | Area | Beds / Baths | Price | Details |
|---|---|---|---|---|---|

|
#21
E Eleanor St
Philadelphia, PA 19120
|
1,260 sq. feet
|
1 baths 3 beds |
$76,972
|
show details |

|
#22
Richmond Rd
Paoli, PA 19301
|
1,706 sq. feet
|
2 baths 2 beds |
$179,198
|
show details |

|
#23
Kingsessing Ave
Philadelphia, PA 19143
|
1,200 sq. feet
|
1 baths 3 beds |
$150,353
|
show details |

|
#24
F St
Philadelphia, PA 19124
|
1,160 sq. feet
|
1 baths 3 beds |
$51,444
|
show details |

|
#25
W Sterner St
Philadelphia, PA 19132
|
840 sq. feet
|
1 baths 3 beds |
$135,593
|
show details |

|
#26
Tulpehocken St
Philadelphia, PA 19138
|
1,840 sq. feet
|
1 baths 3 beds |
$185,991
|
show details |

|
#27
Gerritt St
Philadelphia, PA 19147
|
996 sq. feet
|
1 baths 3 beds |
$199,034
|
show details |

|
#28
S 62nd St
Philadelphia, PA 19142
|
960 sq. feet
|
1 baths 3 beds |
$77,250
|
show details |

|
#29
Hamilton St
Swedesboro, NJ 08085
|
- sq. feet
|
1 baths 3 beds |
$260,000
|
show details |

|
#30
Grove Rd
West Chester, PA 19380
|
875 sq. feet
|
1 baths 3 beds |
$19,782
|
show details |
| Photo | Address | Area | Beds / Baths | Price | Details |
|---|---|---|---|---|---|

|
#31
S 7th St
Philadelphia, PA 19148
|
950 sq. feet
|
1 baths 3 beds |
$72,238
|
show details |

|
#32
Glen Ave
West Chester, PA 19382
|
1,240 sq. feet
|
1 baths 3 beds |
$218,966
|
show details |

|
#33
Chestnut St
Philadelphia, PA 19139
|
1,230 sq. feet
|
1 baths 3 beds |
$28,532
|
show details |

|
#34
S 54th St
Philadelphia, PA 19143
|
1,934 sq. feet
|
1 baths 4 beds |
$129,665
|
show details |

|
#35
Page St
Philadelphia, PA 19121
|
1,022 sq. feet
|
1 baths 3 beds |
$187,170
|
show details |

|
#36
S Ruby St
Philadelphia, PA 19139
|
1,280 sq. feet
|
1 baths 3 beds |
$57,735
|
show details |

|
#37
Railway Sq
West Chester, PA 19380
|
1,238 sq. feet
|
2 baths 2 beds |
$27,314
|
show details |

|
#38
Stirling Ct
West Chester, PA 19380
|
1,050 sq. feet
|
1 baths 2 beds |
$30,983
|
show details |

|
#39
N 22nd St
Philadelphia, PA 19132
|
1,158 sq. feet
|
1 baths 3 beds |
$53,991
|
show details |

|
#40
Woodcrest Rd
Wayne, PA 19087
|
2,240 sq. feet
|
2 baths 4 beds |
$705,233
|
show details |
| Photo | Address | Area | Beds / Baths | Price | Details |
|---|---|---|---|---|---|

|
#41
Pickering St
Philadelphia, PA 19150
|
1,170 sq. feet
|
1 baths 3 beds |
$169,900
|
show details |

|
#42
N 20th St
Philadelphia, PA 19140
|
1,324 sq. feet
|
1 baths 4 beds |
$3,600
|
show details |

|
#43
Harvey Ln
Malvern, PA 19355
|
2,163 sq. feet
|
2 baths 4 beds |
$61,867
|
show details |

|
#44
Bonaffon St
Philadelphia, PA 19142
|
1,008 sq. feet
|
1 baths 3 beds |
$188,921
|
show details |

|
#45
Keenan St
Elkins Park, PA 19027
|
1,234 sq. feet
|
2 baths 2 beds |
$217,220
|
show details |

|
#46
W Penn St
Philadelphia, PA 19144
|
1,326 sq. feet
|
1 baths 3 beds |
$706,157
|
show details |

|
#47
N Wanamaker St
Philadelphia, PA 19131
|
1,212 sq. feet
|
1 baths 3 beds |
$66,018
|
show details |

|
#48
Temple Rd
Philadelphia, PA 19150
|
990 sq. feet
|
1 baths 3 beds |
$99,233
|
show details |

|
#49
Ella St
Philadelphia, PA 19120
|
1,024 sq. feet
|
1 baths 3 beds |
$101,535
|
show details |

|
Check over 1 million property listings on Foreclosure.com!
|
browse all offers | |||

 | Suburban or Rural homes near PHL with good high school? (20 replies) |
| What do middle-aged couples do for fun in the greater Philadelphia area? (34 replies) |
| Moving to the Philadelphia area! (31 replies) |
| Please tell me about the Main Line and other Philadelphia suburbs! (20 replies) |
| Planning a move to Philly in Spring 2019 (37 replies) |
| Collegeville and Downingtown (25 replies) |

Household type by relationship:
Households: 535,924- In family households: 453,586 (91,569 male householders, 48,290 female householders)
99,383 spouses, 170,789 children (161,642 natural, 3,823 adopted, 5,324 stepchildren), 11,365 grandchildren, 5,918 brothers or sisters, 5,812 parents, foster children, 6,644 other relatives, 10,420 non-relatives
- In nonfamily households: 82,338 (29,827 male householders (23,777 living alone)), 39,014 female householders (33,920 living alone)), 13,497 nonrelatives
- In group quarters: 23,055 (7,828 institutionalized population)
94,926 married couples with children.
28,980 single-parent households (5,380 men, 23,600 women).
92.8% of residents of Upper Providence Township speak English at home.
1.6% of residents speak Spanish at home (57% speak English very well, 15% speak English well, 22% speak English not well, 6% don't speak English at all).
3.4% of residents speak other Indo-European language at home (88% speak English very well, 9% speak English well, 3% speak English not well).
2.0% of residents speak Asian or Pacific Island language at home (38% speak English very well, 45% speak English well, 17% speak English not well).
0.3% of residents speak other language at home (87% speak English very well, 13% speak English well).
Foreign born population: 926 (8.4%)
(70.1% of them are naturalized citizens)
| Here: | 8.2 |
| State: | 6.8 |
| Here: | 4.1 |
| State: | 4.3 |

- Bedrooms in owner-occupied houses and condos in Upper Providence Township, Pennsylvania
- 0no bedroom
- 331 bedroom
- 2162 bedrooms
- 1,2043 bedrooms
- 1,2544 bedrooms
- 3585+ bedrooms

- Bedrooms in renter-occupied apartments in Upper Providence Township, Pennsylvania
- 57no bedroom
- 5101 bedroom
- 3402 bedrooms
- 723 bedrooms
- 244 bedrooms
- 75+ bedrooms

- Cars and other vehicles available in Upper Providence Township in owner-occupied houses/condos
- 43no vehicle
- 6161 vehicle
- 1,7312 vehicles
- 5543 vehicles
- 664 vehicles
- 555+ vehicles

- Cars and other vehicles available in Upper Providence Township in renter-occupied apartments
- 84no vehicle
- 6891 vehicle
- 2052 vehicles
- 173 vehicles
- 154 vehicles
- 05+ vehicles

- Rooms in owner-occupied houses in Upper Providence Township, Pennsylvania
- 01 room
- 82 rooms
- 163 rooms
- 204 rooms
- 1475 rooms
- 4996 rooms
- 6737 rooms
- 6938 rooms
- 1,0099+ rooms

- Rooms in renter-occupied apartments in Upper Providence Township, Pennsylvania
- 501 room
- 1242 rooms
- 3453 rooms
- 2744 rooms
- 1015 rooms
- 806 rooms
- 167 rooms
- 138 rooms
- 79+ rooms


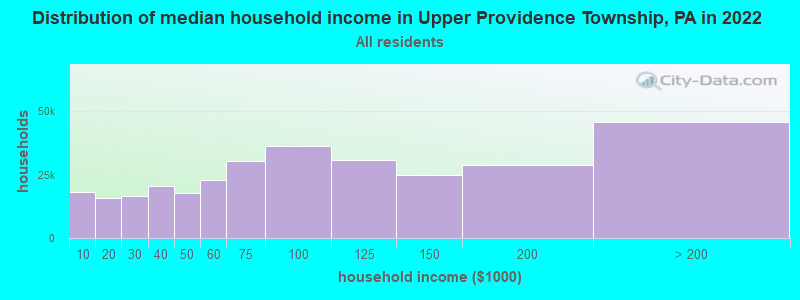
Upper Providence Township, PA household income distribution

- 18,006Less than $10,000
- 15,561$10,000 to $19,999
- 16,517$20,000 to $29,999
- 20,340$30,000 to $39,999
- 17,859$40,000 to $49,999
- 22,761$50,000 to $59,999
- 30,217$60,000 to $74,999
- 36,394$75,000 to $99,999
- 30,900$100,000 to $124,999
- 24,716$125,000 to $149,999
- 28,889$150,000 to $199,999
- 45,677$200,000 or more
Percentage of workers working in this county: 57.4%
Number of people working at home: 1,009 (16.9% of all workers)
Travel time to work (commute)
- Less than 5 minutes: 119
- 5 to 9 minutes: 428
- 10 to 14 minutes: 628
- 15 to 19 minutes: 576
- 20 to 24 minutes: 606
- 25 to 29 minutes: 476
- 30 to 34 minutes: 807
- 35 to 39 minutes: 237
- 40 to 44 minutes: 337
- 45 to 59 minutes: 524
- 60 to 89 minutes: 240
- 90 or more minutes: 139
Means of transportation to work:
- Drove a car alone: 4,365 (80.9%)
- Carpooled: 473 (8.8%)
- Bus or trolley bus: 21 (0.4%)
- Streetcar or trolley car: 11 (0.2%)
- Subway or elevated: 44 (0.8%)
- Railroad: 125 (2.3%)
- Motorcycle: 6 (0.1%)
- Bicycle: 4 (0.1%)
- Walked: 40 (0.7%)
- Other means: 28 (0.5%)
- Worked at home: 278 (5.2%)


- Year of entry for the foreign-born population in Upper Providence Township, Pennsylvania
- 1151995 to March 2000
- 591990 to 1994
- 771985 to 1989
- 331980 to 1984
- 501975 to 1979
- 371970 to 1974
- 601965 to 1969
- 158Before 1965

First ancestries reported:
- Irish: 2,993 (22.6%)
- German: 2,229 (16.9%)
- Italian: 1,880 (14.2%)
- Other: 1,596 (12.1%)
- English: 1,369 (10.4%)
- Polish: 583 (4.4%)
- United States: 335 (2.5%)
- Russian: 283 (2.1%)
- French: 250 (1.9%)
- Ukrainian: 217 (1.6%)
- Scotch-Irish: 198 (1.5%)
- Scottish: 171 (1.3%)
- Dutch: 154 (1.2%)
- Norwegian: 153 (1.2%)
- Welsh: 124 (0.9%)
- Czech: 112 (0.8%)
- Swedish: 86 (0.7%)
- Danish: 66 (0.5%)
- Slovak: 66 (0.5%)
- Arab: 60 (0.5%)
- Hungarian: 55 (0.4%)
- Lithuanian: 55 (0.4%)
- French Canadian: 50 (0.4%)
- Greek: 49 (0.4%)
- Subsaharan African: 29 (0.2%)
- Swiss: 28 (0.2%)
- Portuguese: 17 (0.1%)
- West Indian: 16 (0.1%)
Most common places of birth for foreign-born residents (%):
| Upper Providence Township: | 10.2% (60) |
| Pennsylvania: | 4.6% (23,171) |
| Upper Providence Township: | 8.7% (51) |
| Pennsylvania: | 5.3% (26,703) |
| Upper Providence Township: | 8.0% (47) |
| Pennsylvania: | 7.4% (37,541) |
| Upper Providence Township: | 7.0% (41) |
| Pennsylvania: | 5.2% (26,656) |
| Upper Providence Township: | 5.4% (32) |
| Pennsylvania: | 0.8% (4,160) |
| Upper Providence Township: | 5.1% (30) |
| Pennsylvania: | 5.1% (25,685) |
| Upper Providence Township: | 5.1% (30) |
| Pennsylvania: | 6.0% (30,559) |
| Upper Providence Township: | 4.9% (29) |
| Pennsylvania: | 3.0% (15,200) |
| Upper Providence Township: | 3.6% (21) |
| Pennsylvania: | 0.2% (886) |
| Upper Providence Township: | 3.4% (20) |
| Pennsylvania: | 0.4% (2,265) |
| Upper Providence Township: | 3.2% (19) |
| Pennsylvania: | 1.2% (5,852) |
| Upper Providence Township: | 3.2% (19) |
| Pennsylvania: | 0.5% (2,303) |
| Upper Providence Township: | 3.1% (18) |
| Pennsylvania: | 1.7% (8,574) |
| Upper Providence Township: | 2.7% (16) |
| Pennsylvania: | 4.8% (24,232) |
| Upper Providence Township: | 2.7% (16) |
| Pennsylvania: | 0.4% (2,021) |
| Upper Providence Township: | 2.4% (14) |
| Pennsylvania: | 1.3% (6,687) |
| Upper Providence Township: | 2.4% (14) |
| Pennsylvania: | 0.1% (620) |
| Upper Providence Township: | 2.2% (13) |
| Pennsylvania: | 4.6% (23,478) |
| Upper Providence Township: | 1.9% (11) |
| Pennsylvania: | 0.7% (3,762) |
| Upper Providence Township: | 1.7% (10) |
| Pennsylvania: | 0.4% (2,023) |
| Upper Providence Township: | 1.5% (9) |
| Pennsylvania: | 1.1% (5,442) |
| Upper Providence Township: | 1.5% (9) |
| Pennsylvania: | 0.5% (2,475) |
| Upper Providence Township: | 1.5% (9) |
| Pennsylvania: | 0.5% (2,472) |
Place of birth for U.S.-born residents:
- This state: 7,577
- Other state: 2,322
- Northeast: 1,135
- Midwest: 423
- South: 606
- West: 158
66% of Upper Providence Township residents lived in the same house 5 years ago.
Out of people who lived in different houses, 56% lived in this county.
Out of people who lived in different counties, 55% lived in Pennsylvania.
Education attainment for males 25 years and older:
- No schooling: 0
- Nursery to 4th grade: 14
- 5th and 6th grade: 6
- 7th and 8th grade: 11
- 9th grade: 46
- 10th grade: 49
- 11th grade: 6
- 12th grade, no diploma: 35
- High school graduate (or equivalency): 675
- Less than 1 year of college: 162
- Some college more than 1 year, no degree: 367
- Associate degree: 157
- Bachelor's degree: 1,115
- Master's degree: 435
- Professional school degree: 356
- Doctorate degree: 102

Education attainment for females 25 years and older:
- No schooling: 14
- Nursery to 4th grade: 14
- 5th and 6th grade: 13
- 7th and 8th grade: 19
- 9th grade: 0
- 10th grade: 24
- 11th grade: 62
- 12th grade, no diploma: 23
- High school graduate (or equivalency): 867
- Less than 1 year of college: 245
- Some college more than 1 year, no degree: 351
- Associate degree: 340
- Bachelor's degree: 1,040
- Master's degree: 516
- Professional school degree: 215
- Doctorate degree: 96


Housing units in structures:
- One, detached: 2,813
- One, attached: 413
- Two: 54
- 3 or 4: 109
- 5 to 9: 74
- 10 to 19: 197
- 20 to 49: 358
- 50 or more: 276
- Mobile homes: 5
Median worth of mobile homes: $792,537
Housing units lacking complete kitchen facilities: 0.6%

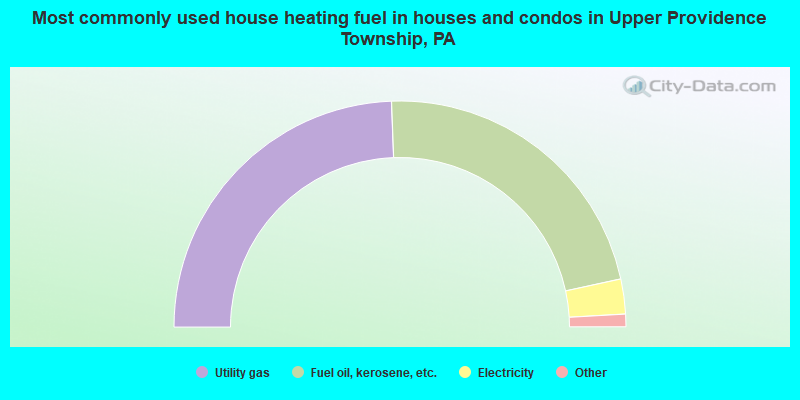
- 48.8%Utility gas
- 44.4%Fuel oil, kerosene, etc.
- 5.0%Electricity
- 1.4%Bottled, tank, or LP gas
- 0.2%Coal or coke
- 0.2%Wood
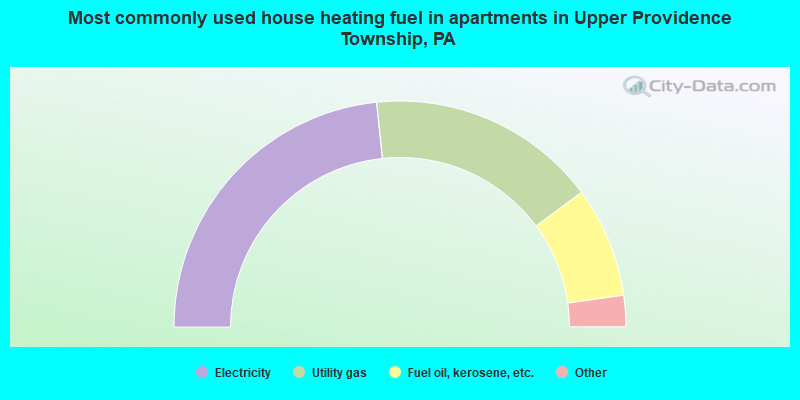
- 46.7%Electricity
- 33.0%Utility gas
- 15.8%Fuel oil, kerosene, etc.
- 3.2%Bottled, tank, or LP gas
- 1.3%Other fuel
Private vs. public school enrollment:
| Here: | 32.7% |
| Pennsylvania: | 16.0% |
| Here: | 34.7% |
| Pennsylvania: | 13.1% |
| Here: | 55.1% |
| Pennsylvania: | 37.3% |


