Upper San Gabriel Valley, CA (California) Houses and Residents
| Upper San Gabriel Valley: | $828,400 |
| California: | $715,900 |
Total population: 327,431 (Urban population: 320,878, Rural population: 91 (all nonfarm))
Houses: 99,295 (96,186 occupied: 52,398 owner occupied, 43,788 renter occupied)
| % of renters here: | 46% |
| State: | 44% |
Housing density: 2,009 houses/condos per square mile
Median price asked for vacant for-sale houses and condos in 2022 in this county: $1,291,802.
Median contract rent in 2022: $1,750 (lower quartile is $1,303, upper quartile is over $2,000)
Median rent asked for vacant for-rent units in 2022: $1,859
Median gross rent in Upper San Gabriel Valley, CA in 2022: $1,869
Housing units in Upper San Gabriel Valley with a mortgage: 34,867 (4,036 second mortgage, 3,133 home equity loan, 137 both second mortgage and home equity loan)
Houses without a mortgage: 11,525
Compare current foreclosures near Upper San Gabriel Valley, CA:


Household type by relationship:
Households: 9,646,924- In family households: 8,234,154 (1,430,848 male householders, 763,232 female householders)
1,480,665 spouses, 3,033,524 children (2,872,074 natural, 53,496 adopted, 107,954 stepchildren), 308,856 grandchildren, 205,746 brothers or sisters, 184,807 parents, foster children, 318,669 other relatives, 372,007 non-relatives
- In nonfamily households: 1,412,770 (510,532 male householders (360,530 living alone)), 536,592 female householders (424,398 living alone)), 365,646 nonrelatives
- In group quarters: 171,681 (68,682 institutionalized population)
1,648,001 married couples with children.
626,289 single-parent households (146,085 men, 480,204 women).
38.8% of residents of Upper San Gabriel Valley speak English at home.
37.4% of residents speak Spanish at home (44% speak English very well, 22% speak English well, 20% speak English not well, 14% don't speak English at all).
2.3% of residents speak other Indo-European language at home (72% speak English very well, 20% speak English well, 7% speak English not well, 2% don't speak English at all).
20.9% of residents speak Asian or Pacific Island language at home (36% speak English very well, 32% speak English well, 25% speak English not well, 7% don't speak English at all).
0.6% of residents speak other language at home (60% speak English very well, 23% speak English well, 10% speak English not well, 6% don't speak English at all).
Foreign born population: 123,976 (37.8%)
(58.2% of them are naturalized citizens)
| Here: | 5.8 |
| State: | 6.0 |
| Here: | 3.7 |
| State: | 3.9 |

- Bedrooms in owner-occupied houses and condos in Upper San Gabriel Valley, California
- 1,134no bedroom
- 4,7771 bedroom
- 14,8032 bedrooms
- 23,0973 bedrooms
- 6,8194 bedrooms
- 1,7685+ bedrooms

- Bedrooms in renter-occupied apartments in Upper San Gabriel Valley, California
- 5,593no bedroom
- 15,3321 bedroom
- 15,8452 bedrooms
- 5,7673 bedrooms
- 1,1484 bedrooms
- 1035+ bedrooms

- Cars and other vehicles available in Upper San Gabriel Valley in owner-occupied houses/condos
- 2,315no vehicle
- 12,9341 vehicle
- 22,3212 vehicles
- 10,0273 vehicles
- 3,2994 vehicles
- 1,5025+ vehicles

- Cars and other vehicles available in Upper San Gabriel Valley in renter-occupied apartments
- 6,673no vehicle
- 19,3541 vehicle
- 13,2302 vehicles
- 3,5153 vehicles
- 6704 vehicles
- 3465+ vehicles

- Rooms in owner-occupied houses in Upper San Gabriel Valley, California
- 3421 room
- 2,3902 rooms
- 6,4863 rooms
- 5,5874 rooms
- 12,3955 rooms
- 12,0786 rooms
- 6,8917 rooms
- 3,4378 rooms
- 2,7929+ rooms

- Rooms in renter-occupied apartments in Upper San Gabriel Valley, California
- 4,0561 room
- 9,0362 rooms
- 9,6163 rooms
- 10,0274 rooms
- 6,4835 rooms
- 2,9776 rooms
- 1,0477 rooms
- 3378 rooms
- 2099+ rooms


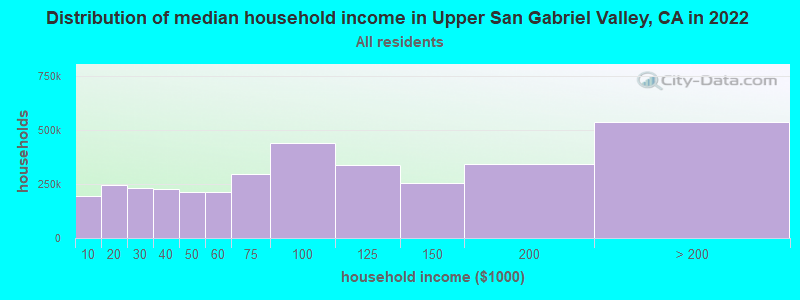
Upper San Gabriel Valley, CA household income distribution

- 195,269Less than $10,000
- 246,158$10,000 to $19,999
- 230,953$20,000 to $29,999
- 227,913$30,000 to $39,999
- 215,487$40,000 to $49,999
- 215,660$50,000 to $59,999
- 297,069$60,000 to $74,999
- 438,481$75,000 to $99,999
- 340,654$100,000 to $124,999
- 256,986$125,000 to $149,999
- 344,257$150,000 to $199,999
- 538,241$200,000 or more
Percentage of workers working in this county: 94.7%
Number of people working at home: 26,865 (17.0% of all workers)
Travel time to work (commute)
- Less than 5 minutes: 1,761
- 5 to 9 minutes: 10,424
- 10 to 14 minutes: 16,165
- 15 to 19 minutes: 18,907
- 20 to 24 minutes: 17,745
- 25 to 29 minutes: 6,827
- 30 to 34 minutes: 19,050
- 35 to 39 minutes: 3,545
- 40 to 44 minutes: 5,435
- 45 to 59 minutes: 11,972
- 60 to 89 minutes: 9,002
- 90 or more minutes: 3,475
Means of transportation to work:
- Drove a car alone: 90,894 (71.1%)
- Carpooled: 21,281 (16.6%)
- Bus or trolley bus: 5,041 (3.9%)
- Streetcar or trolley car: 67 (0.1%)
- Subway or elevated: 27 (0.0%)
- Railroad: 84 (0.1%)
- Taxi: 166 (0.1%)
- Motorcycle: 189 (0.1%)
- Bicycle: 1,378 (1.1%)
- Walked: 4,147 (3.2%)
- Other means: 1,034 (0.8%)
- Worked at home: 3,605 (2.8%)


- Year of entry for the foreign-born population in Upper San Gabriel Valley, California
- 24,4411995 to March 2000
- 26,5061990 to 1994
- 24,7651985 to 1989
- 20,7861980 to 1984
- 14,7621975 to 1979
- 9,1271970 to 1974
- 4,9021965 to 1969
- 7,486Before 1965
Most common places of birth for foreign-born residents (%):
| Upper San Gabriel Valley: | 44.9% (59,629) |
| California: | 44.3% (3,928,701) |
| Upper San Gabriel Valley: | 10.6% (14,023) |
| California: | 3.7% (327,611) |
| Upper San Gabriel Valley: | 8.8% (11,676) |
| California: | 4.7% (418,249) |
| Upper San Gabriel Valley: | 8.6% (11,384) |
| California: | 1.7% (151,775) |
| Upper San Gabriel Valley: | 3.4% (4,507) |
| California: | 7.5% (664,935) |
| Upper San Gabriel Valley: | 3.2% (4,195) |
| California: | 1.0% (91,101) |
| Upper San Gabriel Valley: | 2.6% (3,479) |
| California: | 4.1% (359,673) |
| Upper San Gabriel Valley: | 2.0% (2,610) |
| California: | 3.0% (268,452) |
Place of birth for U.S.-born residents:
- This state: 144,542
- Other state: 41,055
- Northeast: 8,413
- Midwest: 14,743
- South: 10,390
- West: 7,509
58% of Upper San Gabriel Valley residents lived in the same house 5 years ago.
Out of people who lived in different houses, 87% lived in this county.
Out of people who lived in different counties, 60% lived in California.
Education attainment for males 25 years and older:
- No schooling: 4,332
- Nursery to 4th grade: 2,254
- 5th and 6th grade: 6,283
- 7th and 8th grade: 3,395
- 9th grade: 3,311
- 10th grade: 2,183
- 11th grade: 2,504
- 12th grade, no diploma: 5,747
- High school graduate (or equivalency): 16,021
- Less than 1 year of college: 4,712
- Some college more than 1 year, no degree: 12,796
- Associate degree: 5,933
- Bachelor's degree: 14,017
- Master's degree: 5,278
- Professional school degree: 2,309
- Doctorate degree: 1,374

Education attainment for females 25 years and older:
- No schooling: 5,593
- Nursery to 4th grade: 2,536
- 5th and 6th grade: 6,078
- 7th and 8th grade: 4,257
- 9th grade: 3,654
- 10th grade: 2,355
- 11th grade: 3,037
- 12th grade, no diploma: 5,435
- High school graduate (or equivalency): 21,649
- Less than 1 year of college: 6,039
- Some college more than 1 year, no degree: 13,849
- Associate degree: 7,552
- Bachelor's degree: 15,045
- Master's degree: 5,006
- Professional school degree: 1,422
- Doctorate degree: 521

Housing units in structures:
- One, detached: 61,058
- One, attached: 9,191
- Two: 2,032
- 3 or 4: 4,175
- 5 to 9: 5,679
- 10 to 19: 5,419
- 20 to 49: 5,429
- 50 or more: 3,579
- Mobile homes: 2,595
- Boats, RVs, vans, etc.: 138
Median worth of mobile homes: $62,212
Housing units lacking complete kitchen facilities: 1.5%

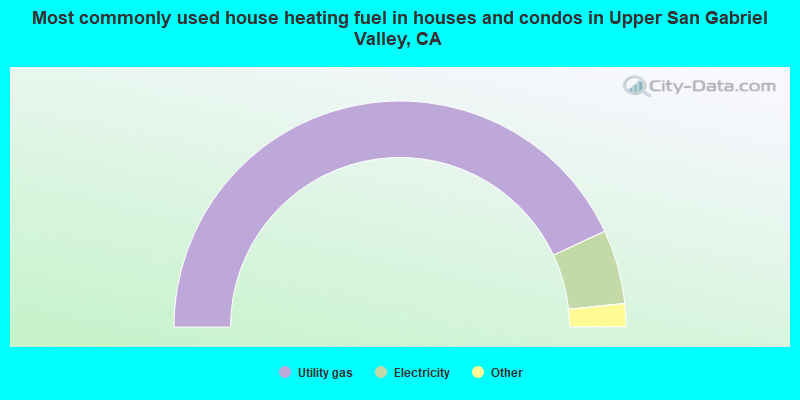
- 86.1%Utility gas
- 10.6%Electricity
- 1.5%No fuel used
- 1.3%Bottled, tank, or LP gas
- 0.3%Wood
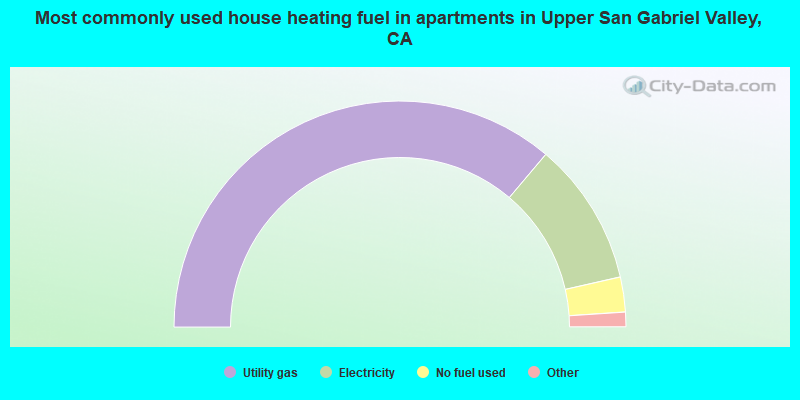
- 72.4%Utility gas
- 20.6%Electricity
- 5.0%No fuel used
- 1.4%Bottled, tank, or LP gas
- 0.2%Solar energy
- 0.2%Wood
- 0.2%Other fuel
Private vs. public school enrollment:
| Here: | 10.2% |
| California: | 9.9% |
| Here: | 8.1% |
| California: | 7.8% |
| Here: | 15.4% |
| California: | 15.4% |


