Upper St. Vrain, CO (Colorado) Houses and Residents
| Upper St. Vrain: | $768,812 |
| Colorado: | $531,100 |
Total population: 1,063 (Urban population: 0, Rural population: 924 (all nonfarm))
Houses: 1,318 (426 occupied: 324 owner occupied, 102 renter occupied)
| % of renters here: | 24% |
| State: | 34% |
Housing density: 7 houses/condos per square mile
Median price asked for vacant for-sale houses and condos in 2022 in this county: $1,069,117.
Median contract rent in 2022: $1,216 (lower quartile is $1,117, upper quartile is $1,755)
Median gross rent in Upper St. Vrain, CO in 2022: $1,270
Housing units in Upper St. Vrain with a mortgage: 208 (56 second mortgage, 39 home equity loan, 0 both second mortgage and home equity loan)
Houses without a mortgage: 100


Household type by relationship:
Households: 285,618- In family households: 212,053 (48,976 male householders, 19,915 female householders)
55,358 spouses, 72,680 children (68,021 natural, 2,350 adopted, 2,309 stepchildren), 2,784 grandchildren, 2,051 brothers or sisters, 1,502 parents, foster children, 2,276 other relatives, 5,269 non-relatives
- In nonfamily households: 73,565 (25,366 male householders (16,609 living alone)), 25,043 female householders (18,012 living alone)), 23,156 nonrelatives
- In group quarters: 8,949 (1,740 institutionalized population)
50,278 married couples with children.
12,524 single-parent households (3,251 men, 9,273 women).
93.4% of residents of Upper St. Vrain speak English at home.
2.1% of residents speak Spanish at home (100% speak English very well).
2.8% of residents speak other Indo-European language at home (72% speak English very well, 28% speak English well).
1.8% of residents speak Asian or Pacific Island language at home (69% speak English very well, 31% speak English well).
Foreign born population: 32 (3.1%)
(62.5% of them are naturalized citizens)
| Here: | 5.8 |
| State: | 6.8 |
| Here: | 4.0 |
| State: | 4.0 |

- Bedrooms in owner-occupied houses and condos in Upper St. Vrain, Colorado
- 0no bedroom
- 431 bedroom
- 1062 bedrooms
- 1543 bedrooms
- 214 bedrooms
- 05+ bedrooms

- Bedrooms in renter-occupied apartments in Upper St. Vrain, Colorado
- 21no bedroom
- 241 bedroom
- 432 bedrooms
- 143 bedrooms
- 04 bedrooms
- 05+ bedrooms

- Cars and other vehicles available in Upper St. Vrain in owner-occupied houses/condos
- 24no vehicle
- 311 vehicle
- 1662 vehicles
- 973 vehicles
- 64 vehicles
- 05+ vehicles

- Cars and other vehicles available in Upper St. Vrain in renter-occupied apartments
- 0no vehicle
- 551 vehicle
- 402 vehicles
- 73 vehicles
- 04 vehicles
- 05+ vehicles

- Rooms in owner-occupied houses in Upper St. Vrain, Colorado
- 01 room
- 142 rooms
- 423 rooms
- 374 rooms
- 915 rooms
- 476 rooms
- 527 rooms
- 268 rooms
- 159+ rooms

- Rooms in renter-occupied apartments in Upper St. Vrain, Colorado
- 171 room
- 232 rooms
- 133 rooms
- 144 rooms
- 275 rooms
- 06 rooms
- 87 rooms
- 08 rooms
- 09+ rooms


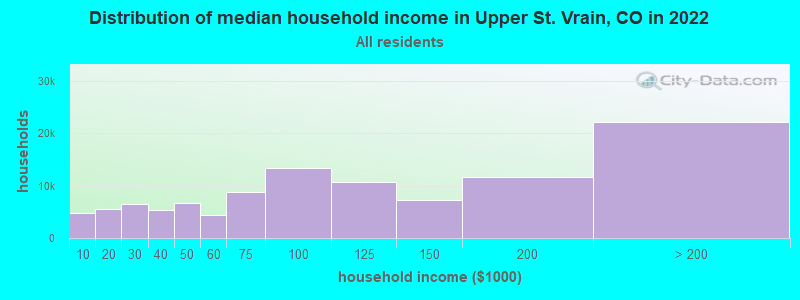
Upper St. Vrain, CO household income distribution

- 4,729Less than $10,000
- 5,588$10,000 to $19,999
- 6,451$20,000 to $29,999
- 5,411$30,000 to $39,999
- 6,749$40,000 to $49,999
- 4,320$50,000 to $59,999
- 8,693$60,000 to $74,999
- 13,382$75,000 to $99,999
- 10,784$100,000 to $124,999
- 7,319$125,000 to $149,999
- 11,717$150,000 to $199,999
- 22,155$200,000 or more
Percentage of workers working in this county: 84.7%
Number of people working at home: 194 (31.9% of all workers)
Travel time to work (commute)
- Less than 5 minutes: 2
- 5 to 9 minutes: 54
- 10 to 14 minutes: 11
- 15 to 19 minutes: 50
- 20 to 24 minutes: 20
- 25 to 29 minutes: 15
- 30 to 34 minutes: 90
- 35 to 39 minutes: 35
- 40 to 44 minutes: 36
- 45 to 59 minutes: 92
- 60 to 89 minutes: 66
- 90 or more minutes: 29
Means of transportation to work:
- Drove a car alone: 366 (67.8%)
- Carpooled: 86 (15.9%)
- Bicycle: 7 (1.3%)
- Walked: 41 (7.6%)
- Worked at home: 40 (7.4%)


- Year of entry for the foreign-born population in Upper St. Vrain, Colorado
- 91995 to March 2000
- 01990 to 1994
- 01985 to 1989
- 71980 to 1984
- 101975 to 1979
- 21970 to 1974
- 01965 to 1969
- 0Before 1965
Most common places of birth for foreign-born residents (%):
| Upper St. Vrain: | 35.7% (10) |
| Colorado: | 3.2% (11,892) |
| Upper St. Vrain: | 21.4% (6) |
| Colorado: | 1.7% (6,338) |
| Upper St. Vrain: | 21.4% (6) |
| Colorado: | 0.1% (472) |
| Upper St. Vrain: | 14.3% (4) |
| Colorado: | 0.3% (1,110) |
| Upper St. Vrain: | 7.1% (2) |
| Colorado: | 3.1% (11,301) |
Place of birth for U.S.-born residents:
- This state: 174
- Other state: 722
- Northeast: 110
- Midwest: 352
- South: 153
- West: 107
46% of Upper St. Vrain residents lived in the same house 5 years ago.
Out of people who lived in different houses, 56% lived in this county.
Out of people who lived in different counties, 42% lived in Colorado.
Education attainment for males 25 years and older:
- No schooling: 0
- Nursery to 4th grade: 0
- 5th and 6th grade: 0
- 7th and 8th grade: 0
- 9th grade: 3
- 10th grade: 3
- 11th grade: 2
- 12th grade, no diploma: 0
- High school graduate (or equivalency): 89
- Less than 1 year of college: 55
- Some college more than 1 year, no degree: 98
- Associate degree: 49
- Bachelor's degree: 46
- Master's degree: 45
- Professional school degree: 2
- Doctorate degree: 26

Education attainment for females 25 years and older:
- No schooling: 0
- Nursery to 4th grade: 0
- 5th and 6th grade: 0
- 7th and 8th grade: 0
- 9th grade: 0
- 10th grade: 0
- 11th grade: 0
- 12th grade, no diploma: 13
- High school graduate (or equivalency): 56
- Less than 1 year of college: 22
- Some college more than 1 year, no degree: 69
- Associate degree: 1
- Bachelor's degree: 84
- Master's degree: 68
- Professional school degree: 0
- Doctorate degree: 8


Housing units in structures:
- One, detached: 1,279
- One, attached: 3
- 3 or 4: 24
- 5 to 9: 4
- 20 to 49: 8
Housing units lacking complete kitchen facilities: 7.3%

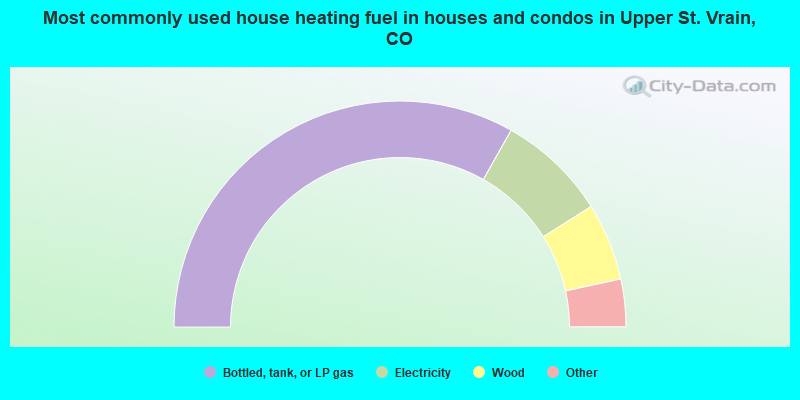
- 66.4%Bottled, tank, or LP gas
- 15.7%Electricity
- 11.1%Wood
- 3.4%Utility gas
- 2.5%Other fuel
- 0.9%Solar energy
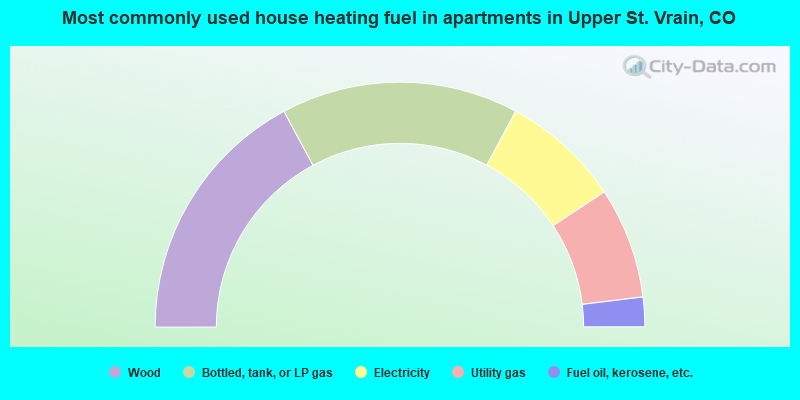
- 34.3%Wood
- 31.4%Bottled, tank, or LP gas
- 15.7%Electricity
- 14.7%Utility gas
- 3.9%Fuel oil, kerosene, etc.
Private vs. public school enrollment:
| Here: | 13.5% |
| Colorado: | 8.8% |
| Here: | 0.0% |
| Colorado: | 7.9% |
| Here: | 11.4% |
| Colorado: | 16.7% |


