Vernon, CT (Connecticut) Houses and Residents
| Vernon: | $283,424 |
| Connecticut: | $347,200 |
Total population: 29,179 (Urban population: 28,050, Rural population: 13 (all nonfarm))
Houses: 12,867 (12,269 occupied: 6,935 owner occupied, 5,334 renter occupied)
| % of renters here: | 43% |
| State: | 34% |
Housing density: 726 houses/condos per square mile
Median price asked for vacant for-sale houses and condos in 2022 in this county: $251,692.
Median contract rent in 2022: $1,183 (lower quartile is $938, upper quartile is $1,476)
Median rent asked for vacant for-rent units in 2022: $1,163
Median gross rent in Vernon, CT in 2022: $1,304
Housing units in Vernon with a mortgage: 4,144 (560 second mortgage, 611 home equity loan, 7 both second mortgage and home equity loan)
Houses without a mortgage: 1,645
Compare current foreclosures near Vernon, CT:
| Photo | Address | Area | Beds / Baths | Price | Details |
|---|---|---|---|---|---|

|
#1
Sanford Ave
Enfield, CT 06082
|
21 sq. feet
|
1 baths 4 beds |
$225,000
|
show details |

|
#2
Tolland Ave
Stafford Springs, CT 06076
|
896 sq. feet
|
1 baths 3 beds |
$100,000
|
show details |

|
#3
Spring St
Glastonbury, CT 06033
|
1,284 sq. feet
|
1 baths 3 beds |
$296,400
|
show details |

|
#4
Mountain Rd
Stafford Springs, CT 06076
|
1,235 sq. feet
|
2 baths 3 beds |
$299,900
|
show details |

|
#5
Mountain Rd
Windsor, CT 06095
|
1,144 sq. feet
|
2 baths 3 beds |
$230,000
|
show details |

|
#6
Irving St
Manchester, CT 06042
|
1,335 sq. feet
|
2 baths 3 beds |
$265,000
|
show details |

|
#7
Newberry Rd
South Windsor, CT 06074
|
3,386 sq. feet
|
2 baths 4 beds |
$669,900
|
show details |

|
#8
Talcott Ave
Vernon Rockville, CT 06066
|
1,832 sq. feet
|
2 baths 4 beds |
$148,000
|
show details |

|
#9
Jondot Dr
Enfield, CT 06082
|
1,385 sq. feet
|
1 baths 3 beds |
$299,900
|
show details |

|
#10
Shares Ln
South Windsor, CT 06074
|
1,850 sq. feet
|
2 baths 4 beds |
$385,000
|
show details |
| Photo | Address | Area | Beds / Baths | Price | Details |
|---|---|---|---|---|---|

|
#11
Hollister Dr
East Hartford, CT 06118
|
1,300 sq. feet
|
1 baths 3 beds |
show details | |

|
#12
Wendover Rd
Suffield, CT 06078
|
3,204 sq. feet
|
2 baths 4 beds |
show details | |

|
#13
Anthony Rd
Tolland, CT 06084
|
1,584 sq. feet
|
3 baths 4 beds |
show details | |

|
#14
Hope Valley Rd
Amston, CT 06231
|
2,128 sq. feet
|
2 baths 3 beds |
show details | |

|
#15
Circle Dr
Mansfield Center, CT 06250
|
1,152 sq. feet
|
1 baths 3 beds |
show details | |

|
#16
Connecticut Route 87
Columbia, CT 06237
|
1,796 sq. feet
|
1 baths 3 beds |
show details | |

|
#17
Deepwood Dr
Manchester, CT 06040
|
734 sq. feet
|
1 baths 2 beds |
show details | |

|
#18
Beacon Hill Dr
West Hartford, CT 06117
|
2,772 sq. feet
|
3 baths 3 beds |
show details | |

|
#19
Mansfield Ave
Willimantic, CT 06226
|
920 sq. feet
|
1 baths 3 beds |
show details | |

|
#20
Cheshire St
Hartford, CT 06114
|
3,279 sq. feet
|
2 baths 4 beds |
show details |
| Photo | Address | Area | Beds / Baths | Price | Details |
|---|---|---|---|---|---|

|
#21
Tunxis Ave
Bloomfield, CT 06002
|
1,190 sq. feet
|
1 baths 3 beds |
show details | |

|
#22
Broadview Ter
Hartford, CT 06106
|
1,821 sq. feet
|
2 baths 7 beds |
show details | |

|
#23
Northbrook Ct # 9
East Hartford, CT 06108
|
1,130 sq. feet
|
2 baths 2 beds |
show details | |

|
#24
Deer Run Rd
Agawam, MA 01001
|
1,189 sq. feet
|
2 baths 3 beds |
show details | |

|
#25
Park Rd
Marlborough, CT 06447
|
1,134 sq. feet
|
1 baths 3 beds |
show details | |

|
#26
Cornwall St
Hartford, CT 06112
|
1,248 sq. feet
|
1 baths 3 beds |
show details | |

|
#27
Harvest Ln
Windsor, CT 06095
|
1,322 sq. feet
|
2 baths 3 beds |
show details | |

|
#28
Ferncrest Dr
East Hartford, CT 06118
|
1,890 sq. feet
|
3 baths 4 beds |
show details | |

|
#29
237 Ridgefield Stree
Hartford, CT 06112
|
- sq. feet
|
3 baths 6 beds |
show details | |

|
#30
Mathewson Ave
Enfield, CT 06082
|
1,666 sq. feet
|
2 baths 4 beds |
show details |
| Photo | Address | Area | Beds / Baths | Price | Details |
|---|---|---|---|---|---|

|
#31
Glendale Cir
Windsor Locks, CT 06096
|
1,277 sq. feet
|
1 baths 2 beds |
show details | |

|
#32
Cedarwood Ln
Newington, CT 06111
|
2,111 sq. feet
|
1 baths 2 beds |
show details | |

|
#33
Bell Ct Apt C1
East Hartford, CT 06108
|
890 sq. feet
|
1 baths 2 beds |
show details | |

|
#34
Holland Dr
East Longmeadow, MA 01028
|
1,424 sq. feet
|
1 baths 2 beds |
show details | |

|
#35
Butternut Ln
Rocky Hill, CT 06067
|
1,176 sq. feet
|
1 baths 2 beds |
show details | |

|
#36
Oakland Rd
South Windsor, CT 06074
|
1,040 sq. feet
|
1 baths 2 beds |
show details | |

|
#37
Main St
Newington, CT 06111
|
1,512 sq. feet
|
1 baths 4 beds |
show details | |

|
#38
Llynwood Dr
Bolton, CT 06043
|
1,335 sq. feet
|
1 baths 4 beds |
show details | |

|
#39
Woodland Dr
Hampden, MA 01036
|
972 sq. feet
|
1 baths 3 beds |
show details | |

|
#40
Avalon Ln
Marlborough, CT 06447
|
3,740 sq. feet
|
2 baths 4 beds |
show details |
| Photo | Address | Area | Beds / Baths | Price | Details |
|---|---|---|---|---|---|

|
#41
Rainbow Rd
Windsor, CT 06095
|
1,644 sq. feet
|
3 baths 3 beds |
show details | |

|
#42
1st Ave
Enfield, CT 06082
|
1,235 sq. feet
|
1 baths 2 beds |
show details | |

|
#43
Cypress Rd
Newington, CT 06111
|
1,236 sq. feet
|
1 baths 2 beds |
show details | |

|
#44
Colony Rd
Enfield, CT 06082
|
1,152 sq. feet
|
2 baths 4 beds |
show details | |

|
#45
Winding Ln
Enfield, CT 06082
|
1,248 sq. feet
|
1 baths 3 beds |
show details | |

|
#46
Church St
Enfield, CT 06082
|
1,964 sq. feet
|
2 baths 4 beds |
show details | |

|
#47
Brown St # 2
Hartford, CT 06114
|
3,077 sq. feet
|
3 baths 6 beds |
show details | |

|
#48
Roosevelt St
Hartford, CT 06114
|
4,527 sq. feet
|
3 baths 9 beds |
show details | |

|
#49
Main St
Glastonbury, CT 06033
|
2,636 sq. feet
|
2 baths 5 beds |
show details | |

|
Check over 1 million property listings on Foreclosure.com!
|
browse all offers | |||
Latest news about housing in Vernon, CT collected exclusively by city-data.com from local newspapers, TV, and radio stations


Household type by relationship:
Households: 136,574- In family households: 112,649 (26,574 male householders, 10,133 female householders)
29,922 spouses, 38,844 children (36,460 natural, 1,015 adopted, 1,369 stepchildren), 1,606 grandchildren, 688 brothers or sisters, 931 parents, foster children, 693 other relatives, 2,519 non-relatives
- In nonfamily households: 23,925 (8,485 male householders (5,980 living alone)), 9,285 female householders (7,198 living alone)), 6,155 nonrelatives
- In group quarters: 16,117 (4,028 institutionalized population)
24,754 married couples with children.
5,247 single-parent households (1,309 men, 3,938 women).
89.0% of residents of Vernon speak English at home.
3.3% of residents speak Spanish at home (76% speak English very well, 11% speak English well, 14% speak English not well).
5.7% of residents speak other Indo-European language at home (77% speak English very well, 17% speak English well, 5% speak English not well, 1% don't speak English at all).
1.7% of residents speak Asian or Pacific Island language at home (55% speak English very well, 24% speak English well, 18% speak English not well, 3% don't speak English at all).
0.2% of residents speak other language at home (90% speak English very well, 10% speak English not well).
Foreign born population: 2,809 (9.6%)
(60.4% of them are naturalized citizens)
| Here: | 6.4 |
| State: | 6.5 |
| Here: | 3.0 |
| State: | 4.0 |

- Bedrooms in owner-occupied houses and condos in Vernon, Connecticut
- 9no bedroom
- 2581 bedroom
- 1,4972 bedrooms
- 3,3913 bedrooms
- 1,6124 bedrooms
- 1685+ bedrooms

- Bedrooms in renter-occupied apartments in Vernon, Connecticut
- 165no bedroom
- 2,7641 bedroom
- 1,7952 bedrooms
- 4743 bedrooms
- 1064 bedrooms
- 305+ bedrooms

- Cars and other vehicles available in Vernon in owner-occupied houses/condos
- 180no vehicle
- 2,0591 vehicle
- 3,3462 vehicles
- 1,0913 vehicles
- 1934 vehicles
- 665+ vehicles

- Cars and other vehicles available in Vernon in renter-occupied apartments
- 764no vehicle
- 2,9241 vehicle
- 1,4402 vehicles
- 1603 vehicles
- 314 vehicles
- 155+ vehicles

- Rooms in owner-occupied houses in Vernon, Connecticut
- 91 room
- 162 rooms
- 1923 rooms
- 6424 rooms
- 1,5005 rooms
- 1,4176 rooms
- 1,4117 rooms
- 1,0898 rooms
- 6599+ rooms

- Rooms in renter-occupied apartments in Vernon, Connecticut
- 1551 room
- 4282 rooms
- 1,8203 rooms
- 1,6534 rooms
- 8075 rooms
- 2936 rooms
- 1057 rooms
- 508 rooms
- 239+ rooms


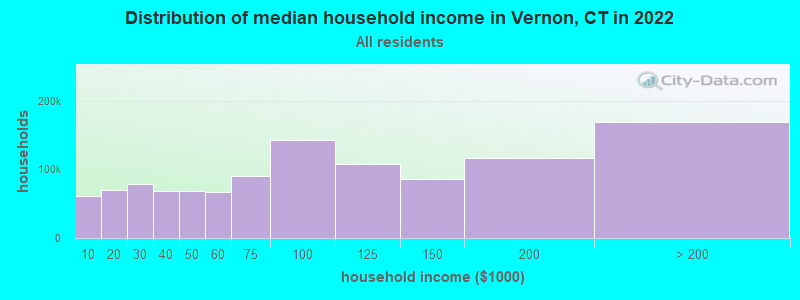
Vernon, CT household income distribution

- 62,232Less than $10,000
- 71,317$10,000 to $19,999
- 79,460$20,000 to $29,999
- 69,513$30,000 to $39,999
- 70,153$40,000 to $49,999
- 67,685$50,000 to $59,999
- 91,740$60,000 to $74,999
- 144,589$75,000 to $99,999
- 109,722$100,000 to $124,999
- 87,508$125,000 to $149,999
- 118,812$150,000 to $199,999
- 171,312$200,000 or more
Percentage of workers working in this county: 29.9%
Number of people working at home: 2,587 (15.4% of all workers)
Travel time to work (commute)
- Less than 5 minutes: 371
- 5 to 9 minutes: 1,443
- 10 to 14 minutes: 2,011
- 15 to 19 minutes: 2,026
- 20 to 24 minutes: 2,868
- 25 to 29 minutes: 1,379
- 30 to 34 minutes: 2,335
- 35 to 39 minutes: 477
- 40 to 44 minutes: 606
- 45 to 59 minutes: 694
- 60 to 89 minutes: 488
- 90 or more minutes: 214
Means of transportation to work:
- Drove a car alone: 12,744 (83.9%)
- Carpooled: 1,565 (10.3%)
- Bus or trolley bus: 301 (2.0%)
- Taxi: 8 (0.1%)
- Motorcycle: 12 (0.1%)
- Walked: 242 (1.6%)
- Other means: 40 (0.3%)
- Worked at home: 286 (1.9%)


- Year of entry for the foreign-born population in Vernon, Connecticut
- 4081995 to March 2000
- 2331990 to 1994
- 2251985 to 1989
- 1601980 to 1984
- 1221975 to 1979
- 781970 to 1974
- 1971965 to 1969
- 414Before 1965

First ancestries reported:
- Irish: 5,279 (15.5%)
- Other: 4,229 (12.4%)
- Italian: 3,917 (11.5%)
- English: 3,555 (10.4%)
- German: 3,381 (9.9%)
- French: 3,254 (9.5%)
- Polish: 2,874 (8.4%)
- French Canadian: 1,788 (5.2%)
- United States: 1,140 (3.3%)
- Scottish: 741 (2.2%)
- Swedish: 453 (1.3%)
- Scotch-Irish: 446 (1.3%)
- Portuguese: 386 (1.1%)
- Russian: 370 (1.1%)
- Lithuanian: 333 (1.0%)
- West Indian: 286 (0.8%)
- Dutch: 243 (0.7%)
- Greek: 177 (0.5%)
- Welsh: 165 (0.5%)
- Slovak: 156 (0.5%)
- Swiss: 155 (0.5%)
- Czech: 153 (0.4%)
- Ukrainian: 146 (0.4%)
- Danish: 135 (0.4%)
- Norwegian: 134 (0.4%)
- Subsaharan African: 103 (0.3%)
- Hungarian: 91 (0.3%)
- Arab: 73 (0.2%)
Most common places of birth for foreign-born residents (%):
| Vernon: | 13.8% (254) |
| Connecticut: | 5.2% (19,083) |
| Vernon: | 7.9% (145) |
| Connecticut: | 1.8% (6,680) |
| Vernon: | 6.4% (118) |
| Connecticut: | 6.9% (25,507) |
| Vernon: | 6.2% (113) |
| Connecticut: | 7.2% (26,819) |
| Vernon: | 5.3% (97) |
| Connecticut: | 2.5% (9,358) |
| Vernon: | 5.1% (94) |
| Connecticut: | 4.1% (15,108) |
| Vernon: | 4.4% (80) |
| Connecticut: | 4.4% (16,395) |
| Vernon: | 4.0% (74) |
| Connecticut: | 1.2% (4,344) |
| Vernon: | 3.6% (66) |
| Connecticut: | 3.2% (12,009) |
| Vernon: | 3.4% (62) |
| Connecticut: | 0.9% (3,317) |
| Vernon: | 2.9% (54) |
| Connecticut: | 3.1% (11,432) |
| Vernon: | 2.8% (52) |
| Connecticut: | 7.0% (26,023) |
| Vernon: | 2.5% (46) |
| Connecticut: | 1.5% (5,508) |
| Vernon: | 2.5% (46) |
| Connecticut: | 1.1% (3,919) |
| Vernon: | 2.4% (44) |
| Connecticut: | 3.6% (13,234) |
| Vernon: | 1.6% (29) |
| Connecticut: | 0.7% (2,742) |
| Vernon: | 1.6% (29) |
| Connecticut: | 0.7% (2,692) |
Place of birth for U.S.-born residents:
- This state: 17,145
- Other state: 8,753
- Northeast: 6,651
- Midwest: 770
- South: 867
- West: 465
56% of Vernon residents lived in the same house 5 years ago.
Out of people who lived in different houses, 48% lived in this county.
Out of people who lived in different counties, 64% lived in Connecticut.
Education attainment for males 25 years and older:
- No schooling: 62
- Nursery to 4th grade: 20
- 5th and 6th grade: 93
- 7th and 8th grade: 243
- 9th grade: 149
- 10th grade: 245
- 11th grade: 195
- 12th grade, no diploma: 291
- High school graduate (or equivalency): 2,598
- Less than 1 year of college: 826
- Some college more than 1 year, no degree: 1,138
- Associate degree: 694
- Bachelor's degree: 1,722
- Master's degree: 727
- Professional school degree: 147
- Doctorate degree: 111

Education attainment for females 25 years and older:
- No schooling: 82
- Nursery to 4th grade: 19
- 5th and 6th grade: 64
- 7th and 8th grade: 334
- 9th grade: 208
- 10th grade: 327
- 11th grade: 225
- 12th grade, no diploma: 225
- High school graduate (or equivalency): 3,336
- Less than 1 year of college: 784
- Some college more than 1 year, no degree: 1,290
- Associate degree: 928
- Bachelor's degree: 1,583
- Master's degree: 764
- Professional school degree: 128
- Doctorate degree: 71

Housing units in structures:
- One, detached: 6,113
- One, attached: 551
- Two: 712
- 3 or 4: 1,560
- 5 to 9: 1,137
- 10 to 19: 1,064
- 20 to 49: 733
- 50 or more: 673
- Mobile homes: 324
Median worth of mobile homes: $70,667
Housing units lacking complete kitchen facilities: 0.2%

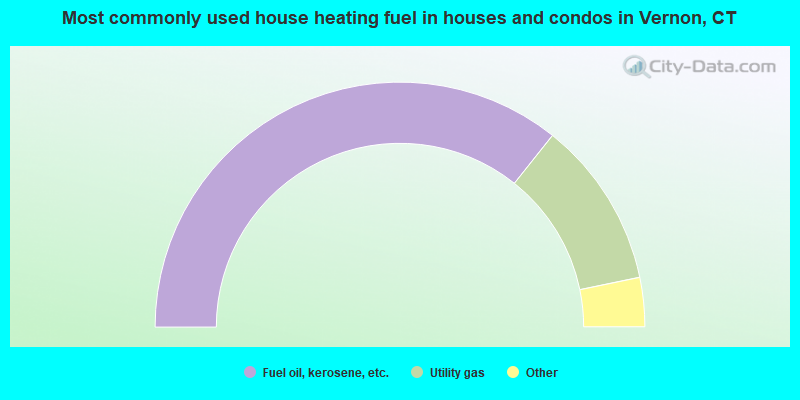
- 71.4%Fuel oil, kerosene, etc.
- 22.1%Utility gas
- 3.5%Electricity
- 2.1%Bottled, tank, or LP gas
- 0.5%Wood
- 0.2%Other fuel
- 0.2%Solar energy
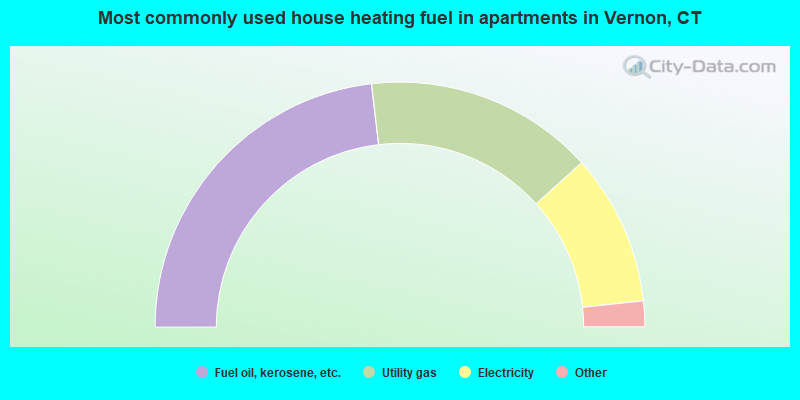
- 46.3%Fuel oil, kerosene, etc.
- 30.3%Utility gas
- 20.0%Electricity
- 2.4%Bottled, tank, or LP gas
- 0.7%Other fuel
- 0.3%No fuel used
Private vs. public school enrollment:
| Here: | 4.0% |
| Connecticut: | 9.9% |
| Here: | 5.4% |
| Connecticut: | 11.0% |
| Here: | 13.9% |
| Connecticut: | 33.4% |


