Ville Platte, LA (Louisiana) Houses and Residents
| Ville Platte: | $80,178 |
| Louisiana: | $209,200 |
Total population: 7,287 (All urban)
Houses: 3,370 (2,693 occupied: 1,044 owner occupied, 1,684 renter occupied)
| % of renters here: | 62% |
| State: | 32% |
Housing density: 1,103 houses/condos per square mile
Median price asked for vacant for-sale houses and condos in 2022: $253,424.
Median contract rent in 2022: $384 (lower quartile is $286, upper quartile is $552)
Median rent asked for vacant for-rent units in 2022: $390
Median gross rent in Ville Platte, LA in 2022: $668
Housing units in Ville Platte with a mortgage: 252 (0 second mortgage, 0 home equity loan, 0 both second mortgage and home equity loan)
Houses without a mortgage: 0
Median household income for houses/condos with a mortgage: $38,569
Median household income for apartments without a mortgage: $36,836
Median monthly housing costs: $603
Compare current foreclosures in Ville Platte, LA:
| Photo | Address | Area | Beds / Baths | Price | Details |
|---|---|---|---|---|---|

|
#1
N Coreil St
Ville Platte, LA 70586
|
- sq. feet
|
2 baths 3 beds |
$40,000
|
show details |

|
#2
Saint Landry Hwy
Ville Platte, LA 70586
|
- sq. feet
|
2 baths 3 beds |
show details | |

|
#3
E Jefferson St
Ville Platte, LA 70586
|
- sq. feet
|
- baths - beds |
$5,750
|
show details |

|
#4
E Jefferson St
Ville Platte, LA 70586
|
- sq. feet
|
- baths - beds |
$5,750
|
show details |

|
#5
E Jackson St
Ville Platte, LA 70586
|
- sq. feet
|
- baths - beds |
$5,750
|
show details |

|
#6
NE Railroad Ave
Ville Platte, LA 70586
|
- sq. feet
|
- baths - beds |
$5,750
|
show details |

|
#7
Highway 167 N
Ville Platte, LA 70586
|
- sq. feet
|
- baths - beds |
show details | |

|
#8
Cora Ln
Ville Platte, LA 70586
|
- sq. feet
|
- baths - beds |
show details | |

|
#9
North 1st St
Ville Platte, LA 70586
|
- sq. feet
|
- baths - beds |
show details | |

|
#10
L Anse Bleu Rd
Ville Platte, LA 70586
|
- sq. feet
|
- baths - beds |
show details |
| Photo | Address | Area | Beds / Baths | Price | Details |
|---|---|---|---|---|---|

|
#11
Millers Lake Rd
Ville Platte, LA 70586
|
- sq. feet
|
- baths - beds |
show details | |

|
#12
L Anse De Cavalier Rd
Ville Platte, LA 70586
|
- sq. feet
|
- baths - beds |
show details | |

|
#13
Greenwood Road
Ville Platte, LA 70586
|
- sq. feet
|
- baths - beds |
show details | |

|
#14
Highway 167 N
Ville Platte, LA 70586
|
- sq. feet
|
- baths - beds |
show details | |

|
#15
Zydeco Ave, Unit 5
Ville Platte, LA 70586
|
- sq. feet
|
- baths - beds |
show details | |

|
#16
Veteran Memorial Hwy
Ville Platte, LA 70586
|
- sq. feet
|
- baths - beds |
show details | |

|
#17
Whittington Pl
Ville Platte, LA 70586
|
- sq. feet
|
- baths - beds |
show details | |

|
#18
Highway 167 N
Ville Platte, LA 70586
|
- sq. feet
|
- baths - beds |
show details | |

|
#19
L Anse De Cavalier Rd
Ville Platte, LA 70586
|
- sq. feet
|
- baths - beds |
show details | |

|
#20
Highway 167 N
Ville Platte, LA 70586
|
- sq. feet
|
- baths - beds |
show details |
| Photo | Address | Area | Beds / Baths | Price | Details |
|---|---|---|---|---|---|

|
#21
Zenon Rd
Ville Platte, LA 70586
|
- sq. feet
|
- baths - beds |
show details | |

|
#22
N Chataignier St # 3
Ville Platte, LA 70586
|
- sq. feet
|
- baths - beds |
show details | |

|
#23
Kenneth St
Ville Platte, LA 70586
|
- sq. feet
|
- baths - beds |
show details | |

|
#24
Heritage Rd
Ville Platte, LA 70586
|
- sq. feet
|
- baths - beds |
show details | |

|
#25
Majic Rd
Ville Platte, LA 70586
|
- sq. feet
|
- baths - beds |
show details | |

|
#26
Kordish Ln
Ville Platte, LA 70586
|
- sq. feet
|
- baths - beds |
show details | |

|
#27
Cora Ln
Ville Platte, LA 70586
|
- sq. feet
|
- baths - beds |
show details | |

|
#28
N Soileau St
Ville Platte, LA 70586
|
- sq. feet
|
- baths - beds |
show details | |

|
#29
Jackson Street
Ville Platte, LA 70586
|
- sq. feet
|
- baths - beds |
show details | |

|
#30
Water Shed Rd
Ville Platte, LA 70586
|
- sq. feet
|
- baths - beds |
show details |
| Photo | Address | Area | Beds / Baths | Price | Details |
|---|---|---|---|---|---|

|
#31
Andrea Rd
Ville Platte, LA 70586
|
- sq. feet
|
- baths - beds |
show details | |

|
#32
E Jackson St
Ville Platte, LA 70586
|
- sq. feet
|
- baths - beds |
show details | |

|
#33
Demoncherveaux Blvd
Ville Platte, LA 70586
|
- sq. feet
|
- baths - beds |
show details | |

|
#34
Calvary Baptist Rd
Ville Platte, LA 70586
|
- sq. feet
|
- baths - beds |
show details | |

|
#35
W Hickory St
Ville Platte, LA 70586
|
- sq. feet
|
- baths - beds |
show details | |

|
#36
W Magnolia St
Ville Platte, LA 70586
|
- sq. feet
|
- baths - beds |
show details | |

|
Check over 1 million property listings on Foreclosure.com!
|
browse all offers | |||


Median year apartment built: 1979
Household type by relationship:
Households: 6,295- Male householders: 956 (422 living alone), Female householders: 1,666 (641 living alone)
628 spouses (628 opposite-sex spouses), 257 unmarried partners, (257 opposite-sex unmarried partners), 2,093 children (1,918 natural, 140 adopted, 33 stepchildren), 355 grandchildren, 166 brothers or sisters, 72 parents, 0 foster children, 14 other relatives, 68 non-relatives
- In group quarters: 16
Size of family households: 789 2-persons, 321 3-persons, 337 4-persons, 10 6-persons, 10 7-or-more-persons.
Size of nonfamily households: 1,134 1-person, 146 2-persons.
193 married couples with children.
1,048 single-parent households (243 men, 805 women).
86.6% of residents of Ville Platte speak English at home.
0.5% of residents speak Spanish at home (86% speak English very well, 14% speak English well).
12.0% of residents speak other Indo-European language at home (82% speak English very well, 16% speak English well, 2% speak English not well).
Foreign born population: 4 (0.1%)
(125.0% of them are naturalized citizens)
| Here: | 5.9 |
| State: | 6.2 |
| Here: | 4.3 |
| State: | 4.4 |

- Bedrooms in owner-occupied houses and condos in Ville Platte, Louisiana
- 0no bedroom
- 421 bedroom
- 2232 bedrooms
- 6853 bedrooms
- 944 bedrooms
- 05+ bedrooms

- Bedrooms in renter-occupied apartments in Ville Platte, Louisiana
- 20no bedroom
- 2971 bedroom
- 7242 bedrooms
- 5683 bedrooms
- 764 bedrooms
- 05+ bedrooms

- Cars and other vehicles available in Ville Platte in owner-occupied houses/condos
- 39no vehicle
- 4231 vehicle
- 5232 vehicles
- 553 vehicles
- 54 vehicles
- 05+ vehicles

- Cars and other vehicles available in Ville Platte in renter-occupied apartments
- 681no vehicle
- 8521 vehicle
- 842 vehicles
- 673 vehicles
- 04 vehicles
- 05+ vehicles

- Rooms in owner-occupied houses in Ville Platte, Louisiana
- 01 room
- 252 rooms
- 263 rooms
- 1884 rooms
- 1315 rooms
- 3946 rooms
- 1597 rooms
- 448 rooms
- 789+ rooms

- Rooms in renter-occupied apartments in Ville Platte, Louisiana
- 201 room
- 992 rooms
- 2063 rooms
- 6744 rooms
- 4475 rooms
- 2006 rooms
- 237 rooms
- 78 rooms
- 109+ rooms


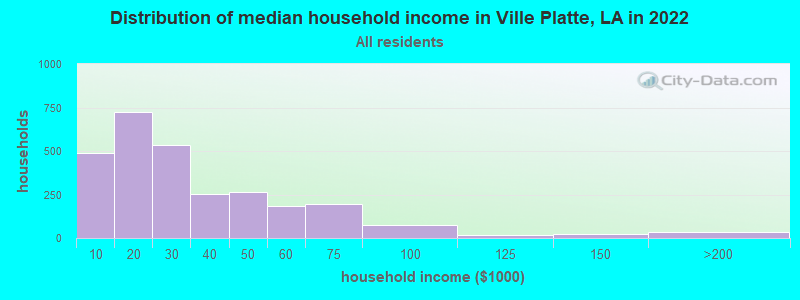
Ville Platte, LA household income distribution

- 487Less than $10,000
- 722$10,000 to $19,999
- 535$20,000 to $29,999
- 251$30,000 to $39,999
- 263$40,000 to $49,999
- 185$50,000 to $59,999
- 198$60,000 to $74,999
- 73$75,000 to $99,999
- 15$100,000 to $124,999
- 23$125,000 to $149,999
- 36$150,000 to $199,999
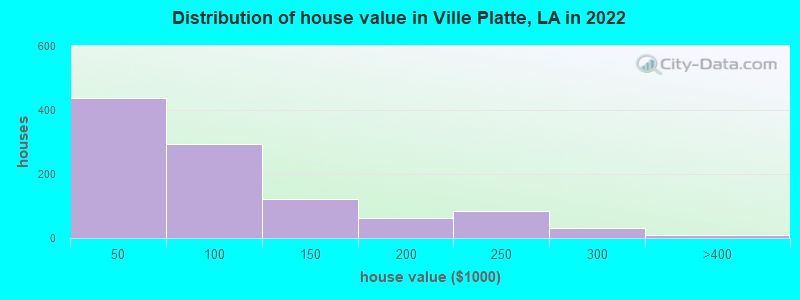
Home value of owner - occupied houses in 2022 in Ville Platte, LA
-
- 32Less than $10,000
- 58$10,000 to $14,999
- 131$15,000 to $19,999
- 82$20,000 to $24,999
- 29$25,000 to $29,999
- 1$30,000 to $34,999
- 85$35,000 to $39,999
- 16$40,000 to $49,999
- 19$50,000 to $59,999
- 33$60,000 to $69,999
- 83$70,000 to $79,999
- 91$80,000 to $89,999
- 47$90,000 to $99,999
- 121$100,000 to $124,999
- 63$150,000 to $174,999
- 84$200,000 to $249,999
- 31$250,000 to $299,999
- 9$300,000 to $399,999
Rent paid by renters in 2022 in Ville Platte, LA
-
- 25Less than $100
- 24$100 to $149
- 166$150 to $199
- 215$200 to $249
- 21$250 to $299
- 323$300 to $349
- 181$350 to $399
- 242$400 to $449
- 93$450 to $499
- 90$500 to $549
- 98$550 to $599
- 42$600 to $649
- 31$650 to $699
- 51$700 to $749
- 34$750 to $799
- 86$800 to $899
- 26$900 to $999
- 44No cash rent


Percentage of workers working in this county: 68.0%
Number of people working at home: 121 (6.1% of all workers)
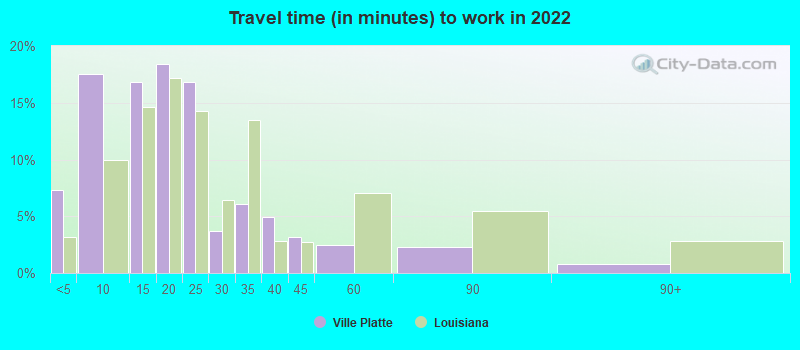
Travel time to work (commute)
- Less than 5 minutes: 149
- 5 to 9 minutes: 495
- 10 to 14 minutes: 349
- 15 to 19 minutes: 78
- 20 to 24 minutes: 112
- 25 to 29 minutes: 18
- 30 to 34 minutes: 235
- 35 to 39 minutes: 9
- 40 to 44 minutes: 0
- 45 to 59 minutes: 187
- 60 to 89 minutes: 162
- 90 or more minutes: 49
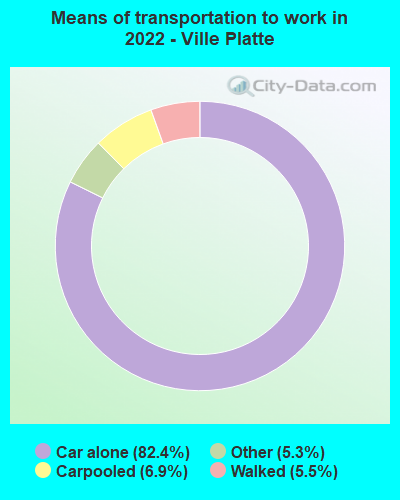
Means of transportation to work:
- Drove a car alone: 2,597 (78.3%)
- Carpooled: 215 (6.5%)
- Taxi: 181 (5.5%)
- Walked: 198 (6.0%)
- Worked at home: 121 (3.6%)

- Unemployment by race in 2022
- Unemployment rate for White non-Hispanic residents
- 7.9%Males
- 3.7%Females
- Unemployment rate for Black residents
- 17.1%Males
- 13.5%Females
- Unemployment rate for two or more race residents
- 97.7%Males
- 55.9%Females

- Year of entry for the foreign-born population in Ville Platte, Louisiana
- 02010 or later
- 02000 to 2009
- 51990 to 1999
- 151980 to 1989
- 01970 to 1979
- 0Before 1970
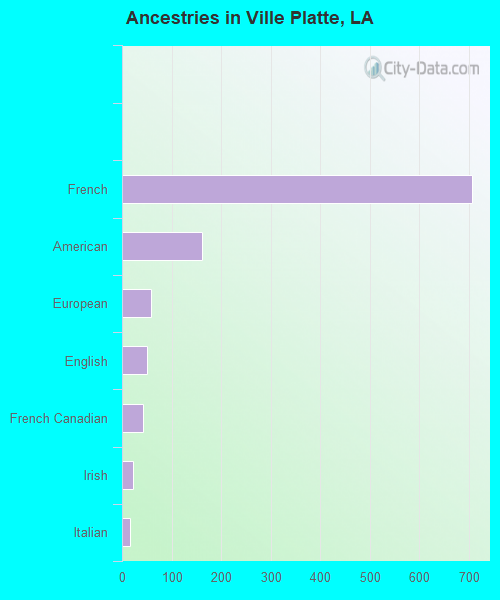
First ancestries reported:
- French: 705 (18.8%)
- American: 161 (4.3%)
- European: 58 (1.5%)
- English: 50 (1.3%)
- French Canadian: 42 (1.1%)
- Irish: 23 (0.6%)
- Italian: 16 (0.4%)
- African: 3 (0.08%)
Most common places of birth for foreign-born residents (%):
| Ville Platte: | 100.0% (5) |
| Louisiana: | 1.2% (2,282) |
Place of birth for U.S.-born residents:
- This state: 6,012
- Other state: 269
- Northeast: 0
- Midwest: 30
- South: 148
- West: 85
81.0% of Ville Platte residents lived in the same house 1 years ago.
Out of people who lived in different houses, 35.7% lived in this county.
Out of people who lived in different counties, 71.0% lived in Louisiana.
| Ville Platte: | 81.0% |
| State average: | 88.3% |
Education attainment for males 25 years and older:
- No schooling: 114
- Nursery to 4th grade: 45
- 5th and 6th grade: 32
- 7th and 8th grade: 71
- 9th grade: 70
- 10th grade: 306
- 11th grade: 74
- 12th grade, no diploma: 15
- High school graduate (or equivalency): 862
- Less than 1 year of college: 88
- Some college more than 1 year, no degree: 134
- Associate degree: 19
- Bachelor's degree: 78
- Master's degree: 41
- Professional school degree: 0
- Doctorate degree: 11

Education attainment for females 25 years and older:
- No schooling: 144
- Nursery to 4th grade: 24
- 5th and 6th grade: 76
- 7th and 8th grade: 83
- 9th grade: 144
- 10th grade: 112
- 11th grade: 104
- 12th grade, no diploma: 17
- High school graduate (or equivalency): 653
- Less than 1 year of college: 95
- Some college more than 1 year, no degree: 109
- Associate degree: 151
- Bachelor's degree: 140
- Master's degree: 31
- Professional school degree: 16
- Doctorate degree: 0


Housing units in structures:
- One, detached: 2,438
- Two: 204
- 3 or 4: 46
- 5 to 9: 43
- 10 to 19: 80
- 20 to 49: 53
- 50 or more: 224
- Mobile homes: 253
- Boats, RVs, vans, etc.: 24
Median worth of mobile homes: $27,166
Housing units lacking complete kitchen facilities in 2022: 14.6%
House/condo owner moved in on average 24 years ago
Renter moved in on average 2 years ago

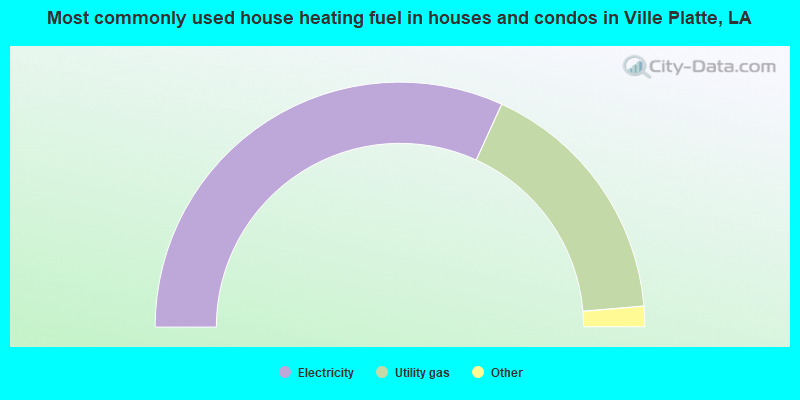
- 63.7%Electricity
- 33.7%Utility gas
- 1.4%Wood
- 1.2%No fuel used
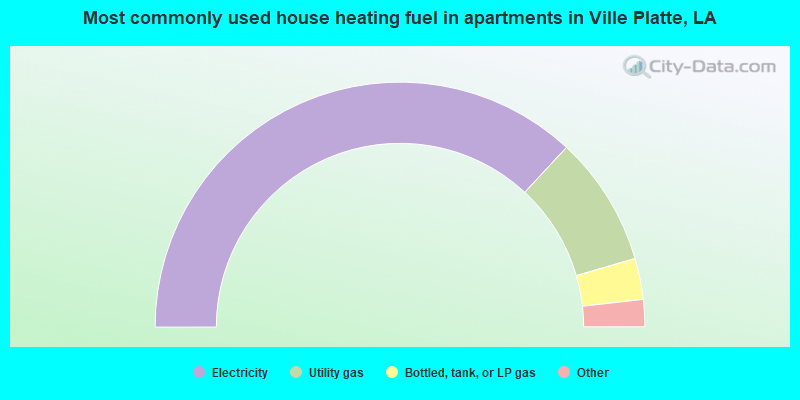
- 73.8%Electricity
- 17.2%Utility gas
- 5.4%Bottled, tank, or LP gas
- 2.0%No fuel used
- 1.6%Fuel oil, kerosene, etc.
Private vs. public school enrollment:
| Here: | 0.0% |
| Louisiana: | 19.6% |
| Here: | 21.8% |
| Louisiana: | 18.3% |
| Here: | 3.6% |
| Louisiana: | 17.4% |


