Waco, TX (Texas) Houses and Residents
| Waco: | $209,700 |
| Texas: | $275,400 |
Mean price in 2022:
Detached houses: $267,138
Here: $267,138 State: $369,058 Townhouses or other attached units: $237,048
Here: $237,048 State: $327,631 In 2-unit structures: $73,103
Here: $73,103 State: $374,947 In 5-or-more-unit structures: $358,812
Here: $358,812 State: $413,944 Mobile homes: $86,860
Here: $86,860 State: $124,413
Total population: 130,194 (Urban population: 109,945, Rural population: 4,087 (26 farm, 4,061 nonfarm))
Houses: 62,671 (53,623 occupied: 25,233 owner occupied, 28,390 renter occupied)
| % of renters here: | 53% |
| State: | 38% |
Housing density: 744 houses/condos per square mile
Median price asked for vacant for-sale houses and condos in 2022: $229,857.
Median contract rent in 2022: $943 (lower quartile is $702, upper quartile is $1,358)
Median rent asked for vacant for-rent units in 2022: $2,146
Median gross rent in Waco, TX in 2022: $1,177
Housing units in Waco with a mortgage: 13,396 (838 second mortgage, 0 home equity loan, 168 both second mortgage and home equity loan)
Houses without a mortgage: 99
Median household income for houses/condos with a mortgage: $91,716
Median household income for apartments without a mortgage: $52,263
Median monthly housing costs: $1,161
Compare current foreclosures in Waco, TX:
| Photo | Address | Area | Beds / Baths | Price | Details |
|---|---|---|---|---|---|

|
#1
N 26th St
Waco, TX 76708
|
1,864 sq. feet
|
2 baths 3 beds |
show details | |

|
#2
Hawthorne Dr
Waco, TX 76710
|
- sq. feet
|
2 baths 3 beds |
show details | |

|
#3
King Ranch Rd
Waco, TX 76705
|
- sq. feet
|
2 baths 3 beds |
show details | |

|
#4
Mosley Dr
Waco, TX 76705
|
1,792 sq. feet
|
2 baths 3 beds |
show details | |

|
#5
Brandywine
Waco, TX 76705
|
1,308 sq. feet
|
2 baths 3 beds |
show details | |

|
#6
Avenue G
Waco, TX 76705
|
1,461 sq. feet
|
2 baths 3 beds |
show details | |

|
#7
Tabor St
Waco, TX 76704
|
1,152 sq. feet
|
1 baths 3 beds |
show details | |

|
#8
Dossett St
Waco, TX 76705
|
1,668 sq. feet
|
1 baths 3 beds |
show details | |

|
#9
Country Aire Dr
Waco, TX 76708
|
1,899 sq. feet
|
2 baths 3 beds |
show details | |

|
#10
Lake Haven Dr
Waco, TX 76710
|
1,836 sq. feet
|
2 baths 3 beds |
show details |
| Photo | Address | Area | Beds / Baths | Price | Details |
|---|---|---|---|---|---|

|
#11
Cleveland Ave
Waco, TX 76711
|
868 sq. feet
|
1 baths 2 beds |
show details | |

|
#12
Wildcat Dr
Waco, TX 76705
|
1,536 sq. feet
|
2 baths 3 beds |
show details | |

|
#13
Haden Dr
Waco, TX 76710
|
1,642 sq. feet
|
1 baths 3 beds |
show details | |

|
#14
E Craven Ave
Waco, TX 76705
|
2,134 sq. feet
|
1 baths 3 beds |
show details | |

|
#15
N 22nd St
Waco, TX 76708
|
1,160 sq. feet
|
1 baths 3 beds |
show details | |

|
#16
Iron Horse Trl
Waco, TX 76708
|
2,124 sq. feet
|
2 baths - beds |
show details | |

|
#17
Oaklawn St
Waco, TX 76705
|
1,100 sq. feet
|
1 baths 2 beds |
show details | |

|
#18
Glasgow Dr
Waco, TX 76710
|
2,271 sq. feet
|
2 baths 4 beds |
show details | |

|
#19
N Barbara St
Waco, TX 76705
|
1,496 sq. feet
|
2 baths 3 beds |
show details | |

|
#20
Aragon Dr
Waco, TX 76708
|
2,011 sq. feet
|
2 baths 4 beds |
show details |
| Photo | Address | Area | Beds / Baths | Price | Details |
|---|---|---|---|---|---|

|
#21
N 10th St
Waco, TX 76707
|
1,092 sq. feet
|
1 baths - beds |
show details | |

|
#22
Paradise Island Rd
Waco, TX 76705
|
1,161 sq. feet
|
2 baths - beds |
show details | |

|
#23
Macarthur Dr
Waco, TX 76708
|
3,964 sq. feet
|
2 baths - beds |
show details | |

|
#24
N Walnut St
Waco, TX 76705
|
2,029 sq. feet
|
2 baths - beds |
show details | |

|
#25
Howe Hill Rd
Waco, TX 76706
|
1,522 sq. feet
|
2 baths - beds |
show details | |

|
#26
Rolando Ave
Waco, TX 76711
|
1,026 sq. feet
|
1 baths - beds |
show details | |

|
#27
Old Marlin Rd
Waco, TX 76705
|
1,292 sq. feet
|
1 baths - beds |
show details | |

|
#28
N 62nd St
Waco, TX 76710
|
1,754 sq. feet
|
2 baths - beds |
show details | |

|
#29
Sydney Dr
Waco, TX 76708
|
1,224 sq. feet
|
2 baths - beds |
show details | |

|
#30
Jancy St
Waco, TX 76706
|
1,730 sq. feet
|
2 baths - beds |
show details |
| Photo | Address | Area | Beds / Baths | Price | Details |
|---|---|---|---|---|---|

|
#31
Live Oak Ave
Waco, TX 76708
|
1,037 sq. feet
|
1 baths - beds |
show details | |

|
#32
Sleeper Ave
Waco, TX 76707
|
1,438 sq. feet
|
1 baths - beds |
show details | |

|
#33
Memorial Dr
Waco, TX 76711
|
922 sq. feet
|
1 baths - beds |
show details | |

|
#34
Armstrong Dr
Waco, TX 76704
|
1,362 sq. feet
|
1 baths - beds |
show details | |

|
#35
Dallas St
Waco, TX 76704
|
1,173 sq. feet
|
1 baths - beds |
show details | |

|
#36
Meadow Brook Rd
Waco, TX 76710
|
1,652 sq. feet
|
2 baths - beds |
show details | |

|
#37
Hubby Ave
Waco, TX 76710
|
1,648 sq. feet
|
2 baths - beds |
show details | |

|
#38
N Rita St
Waco, TX 76705
|
1,516 sq. feet
|
1 baths - beds |
show details | |

|
#39
Leland Ave
Waco, TX 76708
|
1,078 sq. feet
|
1 baths - beds |
show details | |

|
#40
N 26th St
Waco, TX 76708
|
1,686 sq. feet
|
1 baths - beds |
show details |
| Photo | Address | Area | Beds / Baths | Price | Details |
|---|---|---|---|---|---|

|
#41
Torrance St
Waco, TX 76705
|
1,380 sq. feet
|
1 baths - beds |
show details | |

|
#42
N Joyce St
Waco, TX 76705
|
1,590 sq. feet
|
1 baths - beds |
show details | |

|
#43
Cole Ave
Waco, TX 76707
|
1,074 sq. feet
|
1 baths - beds |
show details | |

|
#44
Mahalia Dr
Waco, TX 76705
|
2,647 sq. feet
|
2 baths - beds |
show details | |

|
#45
Sanger Ave Apt 518
Waco, TX 76710
|
- sq. feet
|
- baths - beds |
show details | |

|
#46
Placid Cir Apt 5103
Waco, TX 76706
|
- sq. feet
|
- baths - beds |
show details | |

|
#47
S Loop 340
Waco, TX 76706
|
- sq. feet
|
- baths - beds |
show details | |

|
#48
Cricket Dr
Waco, TX 76705
|
- sq. feet
|
- baths - beds |
show details | |

|
#49
Parkwood St
Waco, TX 76710
|
- sq. feet
|
- baths - beds |
show details | |

|
Check over 1 million property listings on Foreclosure.com!
|
browse all offers | |||

Latest news about housing in Waco, TX collected exclusively by city-data.com from local newspapers, TV, and radio stations

 | WACO - Ambassador Apartments (3 replies) |
| Safe, decent apartments in Waco, TX (7 replies) |
| rental homes in Waco (3 replies) |
| Waco is one of Texas most underrated cities and no one is talking about it? (33 replies) |
| WACO: Firm recommendations for 2 of 3 Waco public housing complexes (1 reply) |
| Waco, Temple or Georgetown? Which is best for retirees? (21 replies) |
Median year apartment built: 1983
Household type by relationship:
Households: 143,987- Male householders: 23,954 (5,164 living alone), Female householders: 29,669 (10,352 living alone)
21,891 spouses (21,368 opposite-sex spouses), 2,890 unmarried partners, (2,443 opposite-sex unmarried partners), 38,822 children (36,340 natural, 542 adopted, 1,940 stepchildren), 4,045 grandchildren, 2,921 brothers or sisters, 3,246 parents, 248 foster children, 863 other relatives, 8,186 non-relatives
- In group quarters: 7,252
Size of family households: 15,231 2-persons, 8,353 3-persons, 5,021 4-persons, 2,489 5-persons, 1,098 6-persons, 378 7-or-more-persons.
Size of nonfamily households: 15,516 1-person, 3,987 2-persons, 706 3-persons, 844 4-persons.
16,225 married couples with children.
10,785 single-parent households (990 men, 9,795 women).
76.9% of residents of Waco speak English at home.
20.2% of residents speak Spanish at home (41% speak English very well, 38% speak English well, 12% speak English not well, 9% don't speak English at all).
1.2% of residents speak other Indo-European language at home (81% speak English very well, 16% speak English well, 2% speak English not well, 1% don't speak English at all).
1.1% of residents speak Asian or Pacific Island language at home (57% speak English very well, 27% speak English well, 15% speak English not well, 1% don't speak English at all).
0.3% of residents speak other language at home (36% speak English very well, 63% speak English well, 1% speak English not well).
Foreign born population: 15,095 (10.5%)
(26.1% of them are naturalized citizens)
| Here: | 6.0 |
| State: | 6.3 |
| Here: | 4.2 |
| State: | 4.0 |

- Bedrooms in owner-occupied houses and condos in Waco, Texas
- 0no bedroom
- 1801 bedroom
- 4,8502 bedrooms
- 13,2573 bedrooms
- 6,3284 bedrooms
- 6185+ bedrooms

- Bedrooms in renter-occupied apartments in Waco, Texas
- 785no bedroom
- 6,1641 bedroom
- 13,0442 bedrooms
- 5,5963 bedrooms
- 2,7664 bedrooms
- 355+ bedrooms

- Cars and other vehicles available in Waco in owner-occupied houses/condos
- 653no vehicle
- 5,4461 vehicle
- 13,1302 vehicles
- 4,5323 vehicles
- 6414 vehicles
- 8315+ vehicles

- Cars and other vehicles available in Waco in renter-occupied apartments
- 2,750no vehicle
- 15,5971 vehicle
- 7,2632 vehicles
- 1,5133 vehicles
- 1,1694 vehicles
- 985+ vehicles

- Rooms in owner-occupied houses in Waco, Texas
- 01 room
- 02 rooms
- 3683 rooms
- 2,5054 rooms
- 6,6575 rooms
- 5,7336 rooms
- 5,9967 rooms
- 1,4598 rooms
- 2,5159+ rooms

- Rooms in renter-occupied apartments in Waco, Texas
- 7851 room
- 1,7562 rooms
- 5,2323 rooms
- 8,5824 rooms
- 5,7875 rooms
- 3,5876 rooms
- 2,3267 rooms
- 1528 rooms
- 1839+ rooms


Waco, TX household income distribution

- 6,558Less than $10,000
- 3,701$10,000 to $19,999
- 5,673$20,000 to $29,999
- 4,565$30,000 to $39,999
- 5,027$40,000 to $49,999
- 3,612$50,000 to $59,999
- 5,633$60,000 to $74,999
- 6,330$75,000 to $99,999
- 4,926$100,000 to $124,999
- 2,609$125,000 to $149,999
- 2,118$150,000 to $199,999
- 2,871$200,000 or more
Home value of owner - occupied houses in 2022 in Waco, TX
-
- 210$20,000 to $24,999
- 86$25,000 to $29,999
- 114$30,000 to $34,999
- 533$35,000 to $39,999
- 249$40,000 to $49,999
- 329$50,000 to $59,999
- 897$60,000 to $69,999
- 430$70,000 to $79,999
- 617$80,000 to $89,999
- 1,300$90,000 to $99,999
- 1,779$100,000 to $124,999
- 1,729$125,000 to $149,999
- 1,469$150,000 to $174,999
- 2,224$175,000 to $199,999
- 3,345$200,000 to $249,999
- 3,824$250,000 to $299,999
- 2,484$300,000 to $399,999
- 1,955$400,000 to $499,999
- 1,253$500,000 to $749,999
- 141$750,000 to $999,999
- 175$1,000,000 to $1,499,999
- 90$1,500,000 to $1,999,999
Rent paid by renters in 2022 in Waco, TX
-
- 613Less than $100
- 47$100 to $149
- 145$150 to $199
- 766$200 to $249
- 140$250 to $299
- 793$300 to $349
- 66$350 to $399
- 81$400 to $449
- 304$450 to $499
- 613$500 to $549
- 1,007$550 to $599
- 1,198$600 to $649
- 1,149$650 to $699
- 1,938$700 to $749
- 1,184$750 to $799
- 2,872$800 to $899
- 2,590$900 to $999
- 4,368$1,000 to $1,249
- 2,724$1,250 to $1,499
- 3,403$1,500 to $1,999
- 1,779$2,000 to $2,499
- 83$2,500 to $2,999
- 27$3,000 to $3,499
- 172$3,500 or more
- 328No cash rent


Percentage of workers working in this county: 92.9%
Number of people working at home: 7,569 (11.4% of all workers)
Travel time to work (commute)
- Less than 5 minutes: 2,550
- 5 to 9 minutes: 8,703
- 10 to 14 minutes: 13,772
- 15 to 19 minutes: 16,727
- 20 to 24 minutes: 8,285
- 25 to 29 minutes: 2,544
- 30 to 34 minutes: 2,771
- 35 to 39 minutes: 156
- 40 to 44 minutes: 850
- 45 to 59 minutes: 1,466
- 60 to 89 minutes: 718
- 90 or more minutes: 1,085
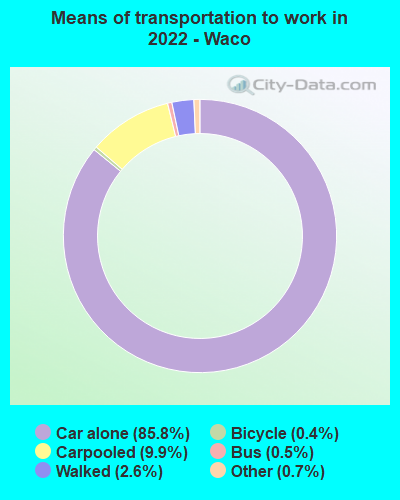
Means of transportation to work:
- Drove a car alone: 74,278 (78.8%)
- Carpooled: 7,638 (8.1%)
- Bus: 415 (0.4%)
- Taxi: 779 (0.8%)
- Bicycle: 440 (0.5%)
- Walked: 2,640 (2.8%)
- Worked at home: 7,569 (8.0%)

- Unemployment by race in 2022
- Unemployment rate for White non-Hispanic residents
- 1.3%Males
- 7.9%Females
- Unemployment rate for Black residents
- 10.5%Males
- 4.4%Females
- Unemployment rate for American Indian and Alaska Native residents
- 26.8%Females
- Unemployment rate for Asian residents
- 1.3%Males
- Unemployment rate for other race residents
- 6.5%Males
- 3.3%Females
- Unemployment rate for two or more race residents
- 1.4%Males
- 4.6%Females
- Unemployment rate for Hispanic or Latino residents
- 4.5%Males
- 3.8%Females

- Year of entry for the foreign-born population in Waco, Texas
- 4,4592010 or later
- 3,6822000 to 2009
- 3,2401990 to 1999
- 2,8471980 to 1989
- 1,4851970 to 1979
- 529Before 1970

First ancestries reported:
- German: 6,240 (7.2%)
- English: 5,012 (5.8%)
- Irish: 3,099 (3.6%)
- American: 3,077 (3.5%)
- Italian: 1,333 (1.5%)
- European: 859 (1.0%)
- Scottish: 855 (1.0%)
- Czech: 699 (0.8%)
- African: 595 (0.7%)
- Scotch-Irish: 473 (0.5%)
- French: 440 (0.5%)
- Norwegian: 411 (0.5%)
- Nigerian: 358 (0.4%)
- Polish: 323 (0.4%)
- Liberian: 260 (0.3%)
- Dutch: 226 (0.3%)
- Welsh: 224 (0.3%)
- Swedish: 220 (0.3%)
- British: 196 (0.2%)
- French Canadian: 181 (0.2%)
- British West Indian: 148 (0.2%)
- Greek: 126 (0.1%)
- Finnish: 99 (0.1%)
- Icelander: 70 (0.08%)
- Danish: 48 (0.06%)
- Lebanese: 47 (0.05%)
- Scandinavian: 46 (0.05%)
- Romanian: 40 (0.05%)
- Czechoslovakian: 40 (0.05%)
- Haitian: 31 (0.04%)
- Egyptian: 30 (0.03%)
- Jamaican: 30 (0.03%)
- Portuguese: 29 (0.03%)
- Slovak: 29 (0.03%)
- Northern European: 28 (0.03%)
- Armenian: 23 (0.03%)
- Palestinian: 23 (0.03%)
- Austrian: 21 (0.02%)
- Turkish: 21 (0.02%)
- Hungarian: 15 (0.02%)
- Yugoslavian: 15 (0.02%)
- Lithuanian: 13 (0.01%)
- Ghanaian: 13 (0.01%)
- Celtic: 12 (0.01%)
- Syrian: 12 (0.01%)
- Swiss: 12 (0.01%)
- Canadian: 11 (0.01%)
- Ukrainian: 10 (0.01%)
- Jordanian: 9 (0.01%)
- West Indian: 9 (0.01%)
- Eastern European: 8 (0.01%)
- Carpatho Rusyn: 8 (0.01%)
- Pennsylvania German: 7 (0.01%)
- Cape Verdean: 7 (0.01%)
Most common places of birth for foreign-born residents (%):
| Waco: | 64.7% (9,496) |
| Texas: | 48.4% (2,411,723) |
| Waco: | 3.0% (445) |
| Texas: | 2.3% (115,558) |
| Waco: | 3.0% (434) |
| Texas: | 3.0% (147,182) |
| Waco: | 2.3% (342) |
| Texas: | 6.1% (306,347) |
| Waco: | 2.1% (311) |
| Texas: | 0.8% (37,989) |
| Waco: | 2.0% (290) |
| Texas: | 1.9% (96,110) |
| Waco: | 1.7% (244) |
| Texas: | 0.2% (9,141) |
Place of birth for U.S.-born residents:
- This state: 93,101
- Other state: 34,656
- Northeast: 3,450
- Midwest: 8,755
- South: 11,115
- West: 11,336
77.0% of Waco residents lived in the same house 1 years ago.
Out of people who lived in different houses, 35.0% lived in this county.
Out of people who lived in different counties, 55.1% lived in Texas.
| Waco: | 77.0% |
| State average: | 85.7% |
Education attainment for males 25 years and older:
- No schooling: 572
- Nursery to 4th grade: 841
- 5th and 6th grade: 353
- 7th and 8th grade: 201
- 9th grade: 238
- 10th grade: 461
- 11th grade: 537
- 12th grade, no diploma: 1,557
- High school graduate (or equivalency): 8,698
- Less than 1 year of college: 1,923
- Some college more than 1 year, no degree: 8,874
- Associate degree: 2,733
- Bachelor's degree: 5,863
- Master's degree: 3,657
- Professional school degree: 888
- Doctorate degree: 831

Education attainment for females 25 years and older:
- No schooling: 341
- Nursery to 4th grade: 0
- 5th and 6th grade: 1,249
- 7th and 8th grade: 493
- 9th grade: 539
- 10th grade: 857
- 11th grade: 1,667
- 12th grade, no diploma: 462
- High school graduate (or equivalency): 10,861
- Less than 1 year of college: 4,321
- Some college more than 1 year, no degree: 8,440
- Associate degree: 2,373
- Bachelor's degree: 8,519
- Master's degree: 3,161
- Professional school degree: 548
- Doctorate degree: 617

Housing units in structures:
- One, detached: 36,682
- One, attached: 1,695
- Two: 2,422
- 3 or 4: 3,334
- 5 to 9: 3,554
- 10 to 19: 6,040
- 20 to 49: 4,391
- 50 or more: 4,271
- Mobile homes: 282
Median worth of mobile homes: $53,000
Housing units lacking complete kitchen facilities in 2022: 4.8%
House/condo owner moved in on average 9 years ago
Renter moved in on average 1 years ago

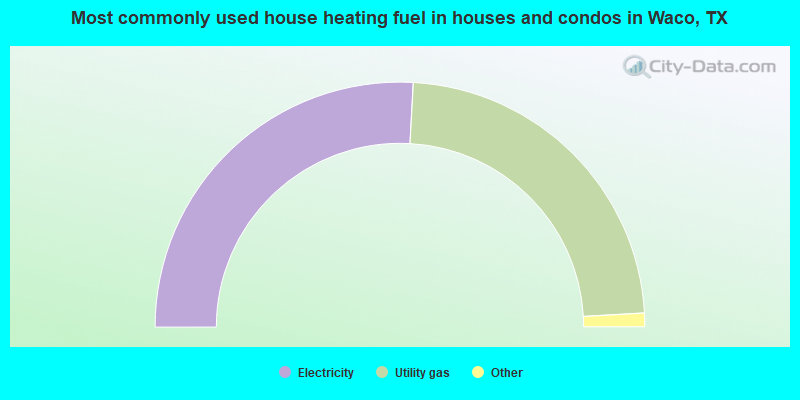
- 51.7%Electricity
- 46.4%Utility gas
- 1.6%Bottled, tank, or LP gas
- 0.2%Solar energy
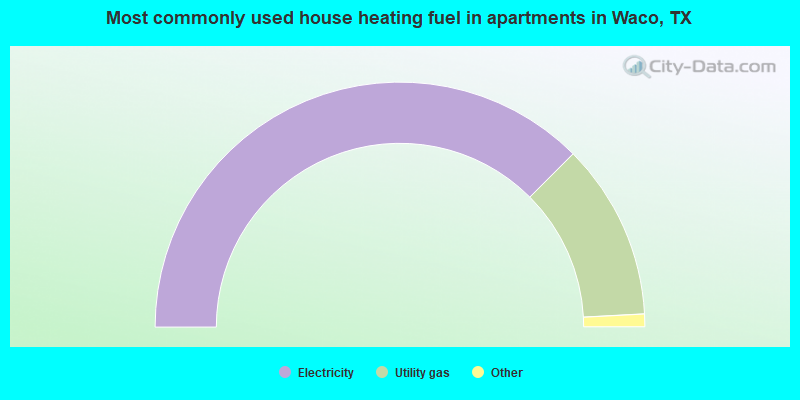
- 75.0%Electricity
- 23.3%Utility gas
- 0.7%No fuel used
- 0.7%Bottled, tank, or LP gas
Private vs. public school enrollment:
| Here: | 20.2% |
| Texas: | 8.8% |
| Here: | 7.3% |
| Texas: | 8.0% |
| Here: | 62.8% |
| Texas: | 16.2% |


