Waukesha, WI (Wisconsin) Houses and Residents
Estimated median house or condo value in 2022: $301,600 (it was $138,000 in 2000 )
Waukesha:
$301,600Wisconsin:
$252,800
Lower value quartile - upper value quartile: $217,100 - $393,100Mean price in 2022: Detached houses: $313,102 Here:
$313,102State:
$308,468
Townhouses or other attached units: $287,924 Here:
$287,924State:
$265,873
In 2-unit structures: $277,546 Here:
$277,546State:
$203,667
In 3-to-4-unit structures: $181,227 Here:
$181,227State:
$216,833
In 5-or-more-unit structures: $283,078 Here:
$283,078State:
$280,537
Mobile homes: $40,696 Here:
$40,696State:
$79,042
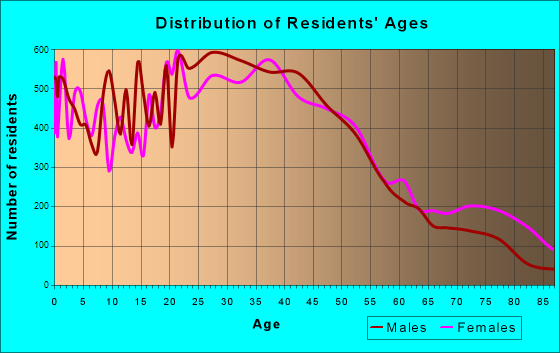
Total population: 71,489 (Urban population: 64,222, Rural population: 150 (all nonfarm) )
Houses: 31,399 (30,861 occupied: 19,085 owner occupied, 11,776 renter occupied )
% of renters here:
38%State:
32%
Housing density: 1,453 houses/condos per square mile
Median price asked for vacant for-sale houses and condos in 2022: $1,226,729.
Median contract rent in 2022: $974 (lower quartile is $749, upper quartile is $1,214)
Median rent asked for vacant for-rent units in 2022: $1,591
Median gross rent in Waukesha, WI in 2022: $1,088
Housing units in Waukesha with a mortgage: 13,539 (1,963 second mortgage, 0 home equity loan, 1,612 both second mortgage and home equity loan )Houses without a mortgage: 538
Median household income for houses/condos with a mortgage: $107,123
Median household income for apartments without a mortgage: $82,637
Median monthly housing costs: $1,234
Data:
Median house or condo value ($)
Median house or condo value ($ change since 2000)
Median house or condo value ($) - White
Median house or condo value ($) - Black or African American
Median house or condo value ($) - Asian
Median house or condo value ($) - Hispanic or Latino
Median house or condo value ($) - American Indian and Alaska Native
Median house or condo value ($) - Multirace
Median house or condo value ($) - Other Race
Median price asked for mobile homes ($)
Household density (households per square mile)
Mean house or condo value by units in structure - 1, detached ($)
Mean house or condo value by units in structure - 1, attached ($)
Mean house or condo value by units in structure - 2 ($)
Mean house or condo value by units in structure by units in structure - 3 or 4 ($)
Mean house or condo value by units in structure - 5 or more ($)
Mean house or condo value by units in structure - Boat, RV, van, etc. ($)
Mean house or condo value by units in structure - Mobile home ($)
Median contract rent ($)
Median contract rent - Lower quartile ($)
Median contract rent - Upper quartile ($)
Median gross rent ($)
Urban houses (%)
Rural houses (%)
Houses occupied (%)
Houses occupied (% change since 2000)
Houses owner occupied (%)
Houses owner occupied (% change since 2000)
Houses renter occupied (%)
Houses renter occupied (% change since 2000)
Vacant housing units - For rent (%)
Vacant housing units - For rent (% change since 2000)
Vacant housing units - For sale only (%)
Vacant housing units - For sale only (% change since 2000)
Vacant housing units - Rented or sold, not occupied (%)
Vacant housing units - Rented or sold, not occupied (% change since 2000)
Vacant housing units - For seasonal, recreational, or occasional use (%)
Vacant housing units - For seasonal, recreational, or occasional use (% change since 2000)
Vacant housing units - For migrant workers (%)
Vacant housing units - For migrant workers (% change since 2000)
Vacant housing units - Other vacant (%)
Vacant housing units - Other vacant (% change since 2000)
Median monthly housing costs ($)
Median household income for houses/condos with a mortgage ($)
Median household income for houses/condos without a mortgage ($)
Median household income ($)
Median household income ($) - White
Median household income ($) - Black or African American
Median household income ($) - Asian
Median household income ($) - Hispanic or Latino
Median household income ($) - American Indian and Alaska Native
Median household income ($) - Multirace
Median household income ($) - Other Race
Mortgage status - with mortgage (%)
Mortgage status - with second mortgage (%)
Mortgage status - with home equity loan (%)
Mortgage status - with both second mortgage and home equity loan (%)
Mortgage status - without a mortgage (%)
Median year house/condo built
Median year apartment built
Household type by relationship - Male householder living alone (%)
Household type by relationship - Male householder not living alone (%)
Household type by relationship - Female householder living alone (%)
Household type by relationship - Female householder not living alone (%)
Household type by relationship - Opposite-Sex spouse (%)
Household type by relationship - Same-Sex spouse (%)
Household type by relationship - Opposite-Sex unmarried partner (%)
Household type by relationship - Same-Sex unmarried partner (%)
Household type by relationship - In group quarters (%)
Size of family households - 2-person household (%)
Size of family households - 3-person household (%)
Size of family households - 4-person household (%)
Size of family households - 5-person household (%)
Size of family households - 6-person household (%)
Size of family households - 7-or-more-person household (%)
Size of nonfamily households - 1-person household (%)
Size of nonfamily households - 2-person household (%)
Size of nonfamily households - 3-person household (%)
Size of nonfamily households - 4-person household (%)
Size of nonfamily households - 5-person household (%)
Size of nonfamily households - 6-person household (%)
Size of nonfamily households - 7-or-moreperson household (%)
Year house built - Built 2010 or later (%)
Year house built - Built 2000 to 2009 (%)
Year house built - Built 1990 to 1999 (%)
Year house built - Built 1980 to 1989 (%)
Year house built - Built 1970 to 1979 (%)
Year house built - Built 1960 to 1969 (%)
Year house built - Built 1950 to 1959 (%)
Year house built - Built 1940 to 1949 (%)
Year house built - Built 1939 or earlier (%)
Median number of rooms in houses and condos
Median number of rooms in apartments
Median number of bedrooms in owner occupied houses
Mean number of bedrooms in owner occupied houses
Median number of bedrooms in renter occupied houses
Mean number of bedrooms in renter occupied houses
Median number of vehichles in owner occupied houses
Mean number of vehichles in owner occupied houses
Median number of vehichles in renter occupied houses
Mean number of vehichles in renter occupied houses
Rooms in owner-occupied houses - 1 room (%)
Rooms in owner-occupied houses - 2 rooms (%)
Rooms in owner-occupied houses - 3 rooms (%)
Rooms in owner-occupied houses - 4 rooms (%)
Rooms in owner-occupied houses - 5 rooms (%)
Rooms in owner-occupied houses - 6 rooms (%)
Rooms in owner-occupied houses - 7 rooms (%)
Rooms in owner-occupied houses - 8 rooms (%)
Rooms in owner-occupied houses - 9+ rooms (%)
Rooms in renter-occupied houses - 1 room (%)
Rooms in renter-occupied houses - 2 rooms (%)
Rooms in renter-occupied houses - 3 rooms (%)
Rooms in renter-occupied houses - 4 rooms (%)
Rooms in renter-occupied houses - 5 rooms (%)
Rooms in renter-occupied houses - 6 rooms (%)
Rooms in renter-occupied houses - 7 rooms (%)
Rooms in renter-occupied houses - 8 rooms (%)
Rooms in renter-occupied houses - 9+ rooms (%)
Bedrooms in owner-occupied houses - no bedrooms (%)
Bedrooms in owner-occupied houses - 1 bedroom (%)
Bedrooms in owner-occupied houses - 2 bedrooms (%)
Bedrooms in owner-occupied houses - 3 bedrooms (%)
Bedrooms in owner-occupied houses - 4 bedrooms (%)
Bedrooms in owner-occupied houses - 5+ bedrooms (%)
Bedrooms in renter-occupied houses - no bedrooms (%)
Bedrooms in renter-occupied houses - 1 bedroom (%)
Bedrooms in renter-occupied houses - 2 bedrooms (%)
Bedrooms in renter-occupied houses - 3 bedrooms (%)
Bedrooms in renter-occupied houses - 4 bedrooms (%)
Bedrooms in renter-occupied houses - 5+ bedrooms (%)
Vehicles available in owner-occupied houses - no vehicle available (%)
Vehicles available in owner-occupied houses - 1 vehicle available(%)
Vehicles available in owner-occupied houses - 2 Vehicles available (%)
Vehicles available in owner-occupied houses - 3 Vehicles available (%)
Vehicles available in owner-occupied houses - 4 Vehicles available (%)
Vehicles available in owner-occupied houses - 5+ Vehicles available (%)
Vehicles available in renter-occupied houses - no vehicle available (%)
Vehicles available in renter-occupied houses - 1 vehicle available (%)
Vehicles available in renter-occupied houses - 2 Vehicles available (%)
Vehicles available in renter-occupied houses - 3 Vehicles available (%)
Vehicles available in renter-occupied houses - 4 Vehicles available (%)
Vehicles available in renter-occupied houses - 5+ Vehicles available (%)
Housing units in structures - 1, detached (%)
Housing units in structures - 1, attached (%)
Housing units in structures - 2 (%)
Housing units in structures - 3 or 4 (%)
Housing units in structures - 5 to 9 (%)
Housing units in structures - 10 to 19 (%)
Housing units in structures - 20 to 49 (%)
Housing units in structures - 50 or more (%)
Housing units in structures - Mobile home (%)
Housing units in structures - Boat, RV, van, etc. (%)
Housing units in structures - Owners - 1, detached (%)
Housing units in structures - Owners - 1, attached (%)
Housing units in structures - Owners - 2 (%)
Housing units in structures - Owners - 3 or 4 (%)
Housing units in structures - Owners - 5 to 9 (%)
Housing units in structures - Owners - 10 to 19 (%)
Housing units in structures - Owners - 20 to 49 (%)
Housing units in structures - Owners - 50 or more (%)
Housing units in structures - Owners - Mobile home (%)
Housing units in structures - Owners - Boat, RV, van, etc. (%)
Housing units in structures - Renters - 1, detached (%)
Housing units in structures - Renters - 1, attached (%)
Housing units in structures - Renters - 2 (%)
Housing units in structures - Renters - 3 or 4 (%)
Housing units in structures - Renters - 5 to 9 (%)
Housing units in structures - Renters - 10 to 19 (%)
Housing units in structures - Renters - 20 to 49 (%)
Housing units in structures - Renters - 50 or more (%)
Housing units in structures - Renters - Mobile home (%)
Housing units in structures - Renters - Boat, RV, van, etc. (%)
House/condo owner moved in on average (years ago)
Renter moved in on average (years ago)
Year householder moved into unit - Moved in 1999 to March 2000 (%)
Year householder moved into unit - Moved in 1999 to March 2000 (%) - White
Year householder moved into unit - Moved in 1999 to March 2000 (%) - Black or African American
Year householder moved into unit - Moved in 1999 to March 2000 (%) - Asian
Year householder moved into unit - Moved in 1999 to March 2000 (%) - Hispanic or Latino
Year householder moved into unit - Moved in 1999 to March 2000 (%) - American Indian and Alaska Native
Year householder moved into unit - Moved in 1999 to March 2000 (%) - Multirace
Year householder moved into unit - Moved in 1999 to March 2000 (%) - Other Race
Year householder moved into unit - Moved in 1995 to 1998 (%)
Year householder moved into unit - Moved in 1995 to 1998 (%) - White
Year householder moved into unit - Moved in 1995 to 1998 (%) - Black or African American
Year householder moved into unit - Moved in 1995 to 1998 (%) - Asian
Year householder moved into unit - Moved in 1995 to 1998 (%) - Hispanic or Latino
Year householder moved into unit - Moved in 1995 to 1998 (%) - American Indian and Alaska Native
Year householder moved into unit - Moved in 1995 to 1998 (%) - Multirace
Year householder moved into unit - Moved in 1995 to 1998 (%) - Other Race
Year householder moved into unit - Moved in 1990 to 1994 (%)
Year householder moved into unit - Moved in 1990 to 1994 (%) - White
Year householder moved into unit - Moved in 1990 to 1994 (%) - Black or African American
Year householder moved into unit - Moved in 1990 to 1994 (%) - Asian
Year householder moved into unit - Moved in 1990 to 1994 (%) - Hispanic or Latino
Year householder moved into unit - Moved in 1990 to 1994 (%) - American Indian and Alaska Native
Year householder moved into unit - Moved in 1990 to 1994 (%) - Multirace
Year householder moved into unit - Moved in 1990 to 1994 (%) - Other Race
Year householder moved into unit - Moved in 1980 to 1989 (%)
Year householder moved into unit - Moved in 1980 to 1989 (%) - White
Year householder moved into unit - Moved in 1980 to 1989 (%) - Black or African American
Year householder moved into unit - Moved in 1980 to 1989 (%) - Asian
Year householder moved into unit - Moved in 1980 to 1989 (%) - Hispanic or Latino
Year householder moved into unit - Moved in 1980 to 1989 (%) - American Indian and Alaska Native
Year householder moved into unit - Moved in 1980 to 1989 (%) - Multirace
Year householder moved into unit - Moved in 1980 to 1989 (%) - Other Race
Year householder moved into unit - Moved in 1970 to 1979 (%)
Year householder moved into unit - Moved in 1970 to 1979 (%) - White
Year householder moved into unit - Moved in 1970 to 1979 (%) - Black or African American
Year householder moved into unit - Moved in 1970 to 1979 (%) - Asian
Year householder moved into unit - Moved in 1970 to 1979 (%) - Hispanic or Latino
Year householder moved into unit - Moved in 1970 to 1979 (%) - American Indian and Alaska Native
Year householder moved into unit - Moved in 1970 to 1979 (%) - Multirace
Year householder moved into unit - Moved in 1970 to 1979 (%) - Other Race
Year householder moved into unit - Moved in 1969 or earlier (%)
Year householder moved into unit - Moved in 1969 or earlier (%) - White
Year householder moved into unit - Moved in 1969 or earlier (%) - Black or African American
Year householder moved into unit - Moved in 1969 or earlier (%) - Asian
Year householder moved into unit - Moved in 1969 or earlier (%) - Hispanic or Latino
Year householder moved into unit - Moved in 1969 or earlier (%) - American Indian and Alaska Native
Year householder moved into unit - Moved in 1969 or earlier (%) - Multirace
Year householder moved into unit - Moved in 1969 or earlier (%) - Other Race
Housing units lacking complete plumbing facilities (%)
Housing units lacking complete kitchen facilities (%)
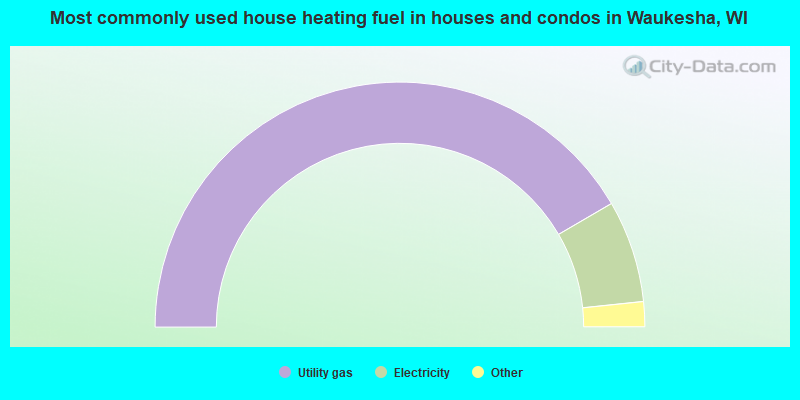
House heating fuel used in houses and condos - Utility gas (%)
House heating fuel used in houses and condos - Bottled, tank, or LP gas (%)
House heating fuel used in houses and condos - Electricity (%)
House heating fuel used in houses and condos - Fuel oil, kerosene, etc. (%)
House heating fuel used in houses and condos - Coal or coke (%)
House heating fuel used in houses and condos - Wood (%)
House heating fuel used in houses and condos - Solar energy (%)
House heating fuel used in houses and condos - Other fuel (%)
House heating fuel used in houses and condos - No fuel used (%)
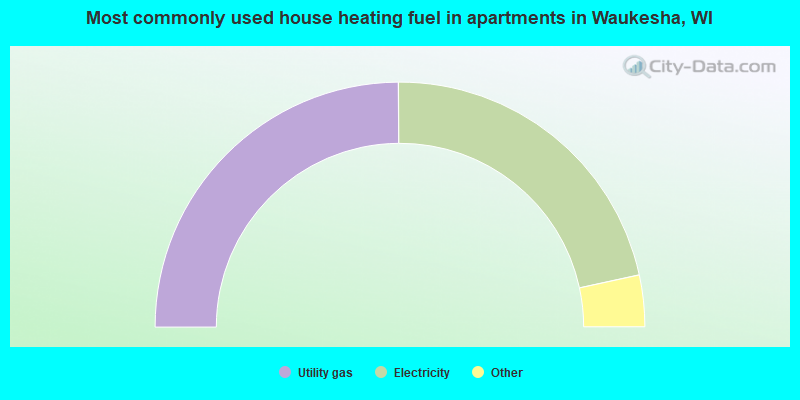
House heating fuel used in apartments - Utility gas (%)
House heating fuel used in apartments - Bottled, tank, or LP gas (%)
House heating fuel used in apartments - Electricity (%)
House heating fuel used in apartments - Fuel oil, kerosene, etc. (%)
House heating fuel used in apartments - Coal or coke (%)
House heating fuel used in apartments - Wood (%)
House heating fuel used in apartments - Solar energy (%)
House heating fuel used in apartments - Other fuel (%)
House heating fuel used in apartments - No fuel used (%)
Latest news about housing in Waukesha, WI collected exclusively by city-data.com from local newspapers, TV, and radio stations
Median year house/condo built: 1976Median year apartment built: 1979Household type by relationship:
Households: 70,465
Male householders: 15,851 (5,675 living alone ), Female householders: 15,010 (5,553 living alone )12,478 spouses (12,374 opposite-sex spouses ), 2,772 unmarried partners , (2,772 opposite-sex unmarried partners ), 20,030 children (18,688 natural , 566 adopted , 776 stepchildren ), 600 grandchildren , 646 brothers or sisters , 356 parents , 0 foster children , 223 other relatives , 1,076 non-relatives In group quarters: 1,423
Size of family households: 7,724 2-persons , 4,018 3-persons , 4,118 4-persons , 1,265 5-persons , 219 6-persons , 118 7-or-more-persons .
Size of nonfamily households: 11,228 1-person , 1,881 2-persons , 290 3-persons .
8,991 married couples with children. single-parent households (1,140 men , 3,221 women ).
88.4% of residents of Waukesha speak English at home. of residents speak Spanish at home (51% speak English very well , 17% speak English well , 25% speak English not well , 7% don't speak English at all ).of residents speak other Indo-European language at home (90% speak English very well , 9% speak English well , 1% speak English not well ).of residents speak Asian or Pacific Island language at home (70% speak English very well , 27% speak English well , 2% speak English not well , 1% don't speak English at all ).
Foreign born population: 3,592 (5.1%)of them are naturalized citizens )
Median number of rooms in houses and condos:
Median number of rooms in apartments
Owner-occupied Renter-occupied
Rooms in owner-occupied houses in Waukesha, Wisconsin
226 1 room 68 2 rooms 293 3 rooms 1,164 4 rooms 3,490 5 rooms 3,965 6 rooms 3,326 7 rooms 3,011 8 rooms 3,542 9+ rooms
Rooms in renter-occupied apartments in Waukesha, Wisconsin
931 1 room 700 2 rooms 1,985 3 rooms 3,691 4 rooms 1,872 5 rooms 1,482 6 rooms 853 7 rooms 184 8 rooms 78 9+ rooms
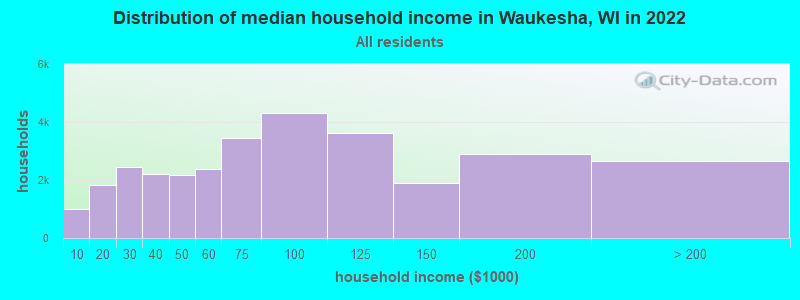
Waukesha, WI household income distribution 999 Less than $10,0001,826 $10,000 to $19,9992,436 $20,000 to $29,9992,197 $30,000 to $39,9992,174 $40,000 to $49,9992,380 $50,000 to $59,9993,460 $60,000 to $74,9994,324 $75,000 to $99,9993,631 $100,000 to $124,9991,884 $125,000 to $149,9992,895 $150,000 to $199,9992,655 $200,000 or more
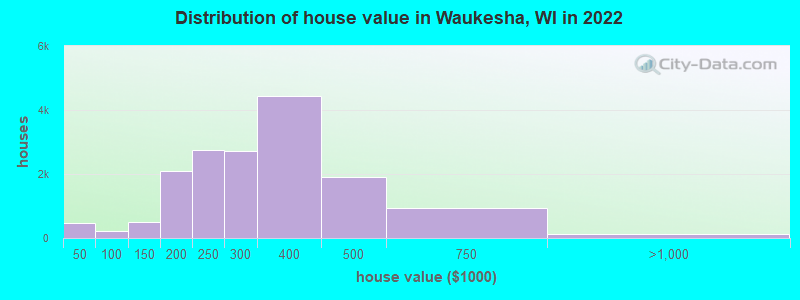
Home value of owner - occupied houses in 2022 in Waukesha, WI 78 Less than $10,00017 $10,000 to $14,999121 $15,000 to $19,999106 $20,000 to $24,99968 $25,000 to $29,9995 $30,000 to $34,99965 $35,000 to $39,99925 $50,000 to $59,99942 $60,000 to $69,99913 $70,000 to $79,99971 $80,000 to $89,99959 $90,000 to $99,999190 $100,000 to $124,999307 $125,000 to $149,999877 $150,000 to $174,9991,213 $175,000 to $199,9992,750 $200,000 to $249,9992,715 $250,000 to $299,9994,446 $300,000 to $399,9991,907 $400,000 to $499,999950 $500,000 to $749,99985 $750,000 to $999,99935 $1,000,000 to $1,499,99919 $2,000,000 or moreRent paid by renters in 2022 in Waukesha, WI 77 Less than $10023 $100 to $14961 $150 to $19994 $200 to $24948 $250 to $299148 $300 to $34967 $350 to $39990 $400 to $449153 $450 to $499102 $500 to $549121 $550 to $599174 $600 to $649601 $650 to $699935 $700 to $749719 $750 to $7991,776 $800 to $8991,280 $900 to $9993,557 $1,000 to $1,2491,483 $1,250 to $1,499831 $1,500 to $1,999112 $2,000 to $2,499121 $2,500 to $2,99910 $3,000 to $3,49949 $3,500 or more83 No cash rent
Percentage of workers working in this county: 76.4%Number of people working at home: 4,517 (11.1% of all workers )
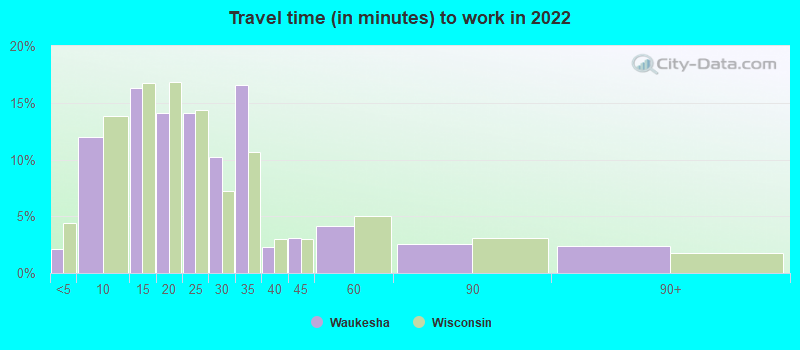
Travel time to work (commute)
Less than 5 minutes: 4695 to 9 minutes: 4,63310 to 14 minutes: 5,88815 to 19 minutes: 6,05220 to 24 minutes: 4,71025 to 29 minutes: 4,52730 to 34 minutes: 3,97335 to 39 minutes: 1,22040 to 44 minutes: 1,29745 to 59 minutes: 1,27260 to 89 minutes: 42790 or more minutes: 276
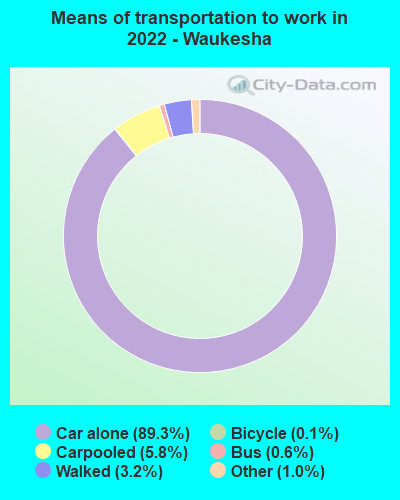
Means of transportation to work:
Drove a car alone: 35,388 (79.7%)Carpooled: 2,542 (5.7%)Bus : 122 (0.3%)Taxi: 461 (1.0%)Bicycle: 43 (0.1%)Walked: 818 (1.8%)Worked at home: 4,517 (10.2%)
Unemployment by race in 2022
Unemployment rate for White non-Hispanic residents 4.3% Males6.9% FemalesUnemployment rate for Black residents 8.5% Males13.5% FemalesUnemployment rate for American Indian and Alaska Native residents 1.0% MalesUnemployment rate for Asian residents 1.6% Males2.5% FemalesUnemployment rate for two or more race residents 3.9% Males3.0% FemalesUnemployment rate for Hispanic or Latino residents 5.2% Males0.2% Females
Year of entry for the foreign-born population in Waukesha, Wisconsin
2,031 2010 or later 1,140 2000 to 2009 1,036 1990 to 1999 650 1980 to 1989 507 1970 to 1979 593 Before 1970
First ancestries reported:
German: 9,348 (30.6%)
American: 1,766 (5.8%)
Polish: 1,626 (5.3%)
Irish: 1,448 (4.7%)
European: 1,391 (4.6%)
English: 1,242 (4.1%)
Italian: 760 (2.5%)
Norwegian: 639 (2.1%)
Greek: 327 (1.1%)
Dutch: 324 (1.1%)
Scottish: 192 (0.6%)
French: 179 (0.6%)
Ukrainian: 172 (0.6%)
Scandinavian: 166 (0.5%)
South African: 152 (0.5%)
Swedish: 150 (0.5%)
Eastern European: 137 (0.4%)
Czech: 118 (0.4%)
Russian: 99 (0.3%)
Romanian: 77 (0.3%)
Cajun: 73 (0.2%)
Lithuanian: 69 (0.2%)
Portuguese: 67 (0.2%)
Scotch-Irish: 66 (0.2%)
French Canadian: 63 (0.2%)
Austrian: 55 (0.2%)
Swiss: 55 (0.2%)
Croatian: 52 (0.2%)
Welsh: 49 (0.2%)
Danish: 48 (0.2%)
Slovene: 46 (0.2%)
Czechoslovakian: 45 (0.1%)
Finnish: 39 (0.1%)
British: 34 (0.1%)
Iranian: 32 (0.1%)
African: 31 (0.1%)
Jamaican: 30 (0.10%)
Hungarian: 28 (0.09%)
Northern European: 27 (0.09%)
Slavic: 26 (0.09%)
Belgian: 21 (0.07%)
Slovak: 19 (0.06%)
Trinidadian and Tobagonian: 14 (0.05%)
Israeli: 13 (0.04%)
Canadian: 11 (0.04%)
Latvian: 11 (0.04%)
Luxembourger: 11 (0.04%)
Egyptian: 9 (0.03%)
Lebanese: 7 (0.02%)
Serbian: 6 (0.02%)
Armenian: 3 (0.01%)
Most common places of birth for foreign-born residents (%): Mexico Waukesha:
32.9% (1,699)Wisconsin:
29.5% (87,182)
India Waukesha:
13.8% (712)Wisconsin:
8.0% (23,594)
Venezuela Waukesha:
10.6% (549)Wisconsin:
0.8% (2,302)
Germany Waukesha:
5.9% (302)Wisconsin:
3.0% (8,773)
South Africa Waukesha:
4.0% (205)Wisconsin:
0.4% (1,211)
Argentina Waukesha:
3.8% (198)Wisconsin:
0.5% (1,622)
Nicaragua Waukesha:
3.3% (171)Wisconsin:
1.1% (3,231)
Korea Waukesha:
2.7% (137)Wisconsin:
1.8% (5,320)
Peru Waukesha:
2.2% (112)Wisconsin:
0.7% (1,960)
China, excluding Hong Kong and Taiwan Waukesha:
2.1% (108)Wisconsin:
5.1% (15,165)
Vietnam Waukesha:
2.0% (103)Wisconsin:
1.5% (4,400)
Burma (Myanmar) Waukesha:
1.6% (83)Wisconsin:
1.4% (4,016)
Place of birth for U.S.-born residents:
This state: 52,271Other state: 14,307Northeast: 2,340Midwest: 7,804South: 2,134West: 2,029 86.1% of Waukesha residents lived in the same house 1 years ago.
Out of people who lived in different houses, 38.3% lived in this county.
Out of people who lived in different counties, 63.5% lived in Wisconsin.
Waukesha:
86.1%State average:
87.7%
Education attainment for males 25 years and older:
No schooling: 95Nursery to 4th grade: 05th and 6th grade: 647th and 8th grade: 829th grade: 9310th grade: 011th grade: 8412th grade, no diploma: 107High school graduate (or equivalency): 5,136Less than 1 year of college: 1,282Some college more than 1 year, no degree: 3,838Associate degree: 2,718Bachelor's degree: 7,495Master's degree: 2,375Professional school degree: 464Doctorate degree: 350
Education attainment for females 25 years and older:
No schooling: 157Nursery to 4th grade: 05th and 6th grade: 467th and 8th grade: 539th grade: 010th grade: 11011th grade: 012th grade, no diploma: 236High school graduate (or equivalency): 6,350Less than 1 year of college: 1,473Some college more than 1 year, no degree: 2,721Associate degree: 3,038Bachelor's degree: 6,807Master's degree: 2,240Professional school degree: 249Doctorate degree: 256
Housing units in structures:
One, detached: 17,368One, attached: 2,120Two: 1,7173 or 4: 1,9515 to 9: 1,70610 to 19: 1,72520 to 49: 2,32650 or more: 2,404Mobile homes: 82Housing units lacking complete plumbing facilities in 2022: 0.2%Housing units lacking complete kitchen facilities in 2022: 0.4%House/condo owner moved in on average 10 years ago
Renter moved in on average 3 years ago
Private vs. public school enrollment:
Students in private schools in grades 1 to 8 (elementary and middle school): 1,272 Here:
21.5%Wisconsin:
16.7%
Students in private schools in grades 9 to 12 (high school): 379 Here:
10.5%Wisconsin:
12.5%
Students in private undergraduate colleges: 1,374 Here:
31.0%Wisconsin:
17.5%