Waynesboro, PA (Pennsylvania) Houses and Residents
| Waynesboro: | $181,630 |
| Pennsylvania: | $245,500 |
Mean price in 2022:
Detached houses: $243,057
Here: $243,057 State: $317,202 Townhouses or other attached units: $247,360
Here: $247,360 State: $254,369 In 2-unit structures: $236,284
Here: $236,284 State: $249,182 In 5-or-more-unit structures: $194,112
Here: $194,112 State: $320,068 Mobile homes: $125,460
Here: $125,460 State: $92,414
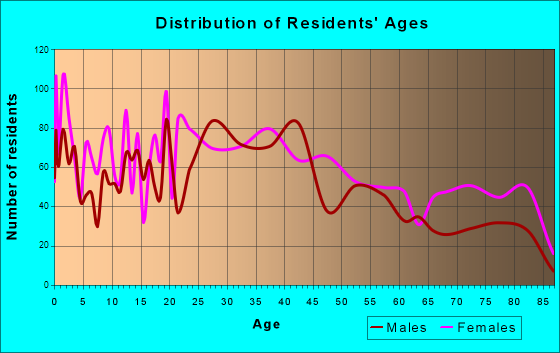
Total population: 10,760 (Urban population: 9,604 (all inside urban clusters), Rural population: 0)
Houses: 4,786 (4,554 occupied: 2,334 owner occupied, 2,348 renter occupied)
| % of renters here: | 50% |
| State: | 31% |
Housing density: 1,426 houses/condos per square mile
Median price asked for vacant for-sale houses and condos in 2022: $240,546.
Median contract rent in 2022: $724 (lower quartile is $565, upper quartile is $923)
Median rent asked for vacant for-rent units in 2022: $490
Median gross rent in Waynesboro, PA in 2022: $871
Housing units in Waynesboro with a mortgage: 1,669 (191 second mortgage, 6 home equity loan, 166 both second mortgage and home equity loan)
Houses without a mortgage: 63
Median household income for houses/condos with a mortgage: $81,832
Median household income for apartments without a mortgage: $67,953
Median monthly housing costs: $1,063
Compare current foreclosures in Waynesboro, PA:
| Photo | Address | Area | Beds / Baths | Price | Details |
|---|---|---|---|---|---|

|
#1
Cottage St
Waynesboro, PA 17268
|
1,704 sq. feet
|
1 baths 3 beds |
show details | |

|
#2
Gulf Dr
Waynesboro, PA 17268
|
1,455 sq. feet
|
2 baths 2 beds |
show details | |

|
#3
Ringgold St
Waynesboro, PA 17268
|
1,300 sq. feet
|
1 baths 3 beds |
show details | |

|
#4
Tritle Ave
Waynesboro, PA 17268
|
1,040 sq. feet
|
2 baths 3 beds |
show details | |

|
#5
Cross Fields Dr
Waynesboro, PA 17268
|
- sq. feet
|
3 baths 4 beds |
show details | |

|
#6
Anthony Hwy
Waynesboro, PA 17268
|
- sq. feet
|
2 baths 4 beds |
show details | |

|
#7
S Broad St
Waynesboro, PA 17268
|
2,730 sq. feet
|
1 baths - beds |
show details | |

|
#8
N Franklin St
Waynesboro, PA 17268
|
- sq. feet
|
1 baths 4 beds |
show details | |

|
#9
Anthony Hwy
Waynesboro, PA 17268
|
1,632 sq. feet
|
2 baths - beds |
show details | |

|
#10
S Broad St
Waynesboro, PA 17268
|
- sq. feet
|
- baths - beds |
show details |
| Photo | Address | Area | Beds / Baths | Price | Details |
|---|---|---|---|---|---|

|
#11
Washington Township Blvd Unit 1105
Waynesboro, PA 17268
|
- sq. feet
|
- baths - beds |
show details | |

|
#12
Wayne Hwy
Waynesboro, PA 17268
|
- sq. feet
|
- baths - beds |
show details | |

|
#13
N Potomac St # 1
Waynesboro, PA 17268
|
- sq. feet
|
- baths - beds |
show details | |

|
#14
Fir Spring Dr
Waynesboro, PA 17268
|
- sq. feet
|
- baths - beds |
show details | |

|
#15
Crown Ct
Waynesboro, PA 17268
|
- sq. feet
|
- baths - beds |
show details | |

|
#16
Washington Township Blvd Unit 303
Waynesboro, PA 17268
|
- sq. feet
|
- baths - beds |
show details | |

|
#17
Clyde St
Waynesboro, PA 17268
|
- sq. feet
|
- baths - beds |
show details | |

|
#18
Casper Dr
Waynesboro, PA 17268
|
- sq. feet
|
- baths - beds |
show details | |

|
#19
Furnace Rd
Waynesboro, PA 17268
|
- sq. feet
|
- baths - beds |
show details | |

|
#20
East Ave
Waynesboro, PA 17268
|
- sq. feet
|
- baths - beds |
show details |
| Photo | Address | Area | Beds / Baths | Price | Details |
|---|---|---|---|---|---|

|
#21
S Church St
Waynesboro, PA 17268
|
- sq. feet
|
- baths - beds |
show details | |

|
#22
W 8th St
Waynesboro, PA 17268
|
- sq. feet
|
- baths - beds |
show details | |

|
#23
Landis Ave
Waynesboro, PA 17268
|
- sq. feet
|
- baths - beds |
show details | |

|
#24
Mont Alto Rd
Waynesboro, PA 17268
|
- sq. feet
|
- baths - beds |
show details | |

|
#25
Pine Grove Dr
Waynesboro, PA 17268
|
- sq. feet
|
- baths - beds |
show details | |

|
#26
Wayne Hwy
Waynesboro, PA 17268
|
- sq. feet
|
- baths - beds |
show details | |

|
#27
Pine Grove Dr
Waynesboro, PA 17268
|
- sq. feet
|
- baths - beds |
show details | |

|
#28
E Main St
Waynesboro, PA 17268
|
- sq. feet
|
- baths - beds |
show details | |

|
#29
Hamilton Ave
Waynesboro, PA 17268
|
- sq. feet
|
- baths - beds |
show details | |

|
#30
Seibert Ave
Waynesboro, PA 17268
|
- sq. feet
|
- baths - beds |
show details |
| Photo | Address | Area | Beds / Baths | Price | Details |
|---|---|---|---|---|---|

|
#31
Cleveland Ave
Waynesboro, PA 17268
|
- sq. feet
|
- baths - beds |
show details | |

|
#32
Eastland Cir
Waynesboro, PA 17268
|
- sq. feet
|
- baths - beds |
show details | |

|
#33
Scott Ave
Waynesboro, PA 17268
|
- sq. feet
|
- baths - beds |
show details | |

|
#34
Airport Rd
Waynesboro, PA 17268
|
- sq. feet
|
- baths - beds |
show details | |

|
Check over 1 million property listings on Foreclosure.com!
|
browse all offers | |||

Latest news about housing in Waynesboro, PA collected exclusively by city-data.com from local newspapers, TV, and radio stations


Median year apartment built: 1964
Household type by relationship:
Households: 11,066- Male householders: 1,947 (566 living alone), Female householders: 2,587 (913 living alone)
1,756 spouses (1,743 opposite-sex spouses), 539 unmarried partners, (531 opposite-sex unmarried partners), 3,648 children (3,335 natural, 12 adopted, 300 stepchildren), 139 grandchildren, 16 brothers or sisters, 120 parents, 0 foster children, 28 other relatives, 250 non-relatives
- In group quarters: 33
Size of family households: 1,302 2-persons, 475 3-persons, 404 4-persons, 275 5-persons, 234 6-persons, 79 7-or-more-persons.
Size of nonfamily households: 1,619 1-person, 269 2-persons, 54 3-persons, 23 4-persons.
1,626 married couples with children.
1,223 single-parent households (432 men, 791 women).
95.8% of residents of Waynesboro speak English at home.
3.0% of residents speak Spanish at home (46% speak English very well, 40% speak English well, 14% speak English not well).
0.4% of residents speak other Indo-European language at home (100% speak English very well).
0.1% of residents speak other language at home (100% speak English very well).
Foreign born population: 363 (3.3%)
(45.7% of them are naturalized citizens)
| Here: | 6.3 |
| State: | 6.8 |
| Here: | 4.8 |
| State: | 4.3 |

- Bedrooms in owner-occupied houses and condos in Waynesboro, Pennsylvania
- 0no bedroom
- 861 bedroom
- 3622 bedrooms
- 1,1673 bedrooms
- 4484 bedrooms
- 2715+ bedrooms

- Bedrooms in renter-occupied apartments in Waynesboro, Pennsylvania
- 87no bedroom
- 5881 bedroom
- 7552 bedrooms
- 7433 bedrooms
- 1574 bedrooms
- 195+ bedrooms

- Cars and other vehicles available in Waynesboro in owner-occupied houses/condos
- 57no vehicle
- 7451 vehicle
- 8412 vehicles
- 4883 vehicles
- 1984 vehicles
- 55+ vehicles

- Cars and other vehicles available in Waynesboro in renter-occupied apartments
- 321no vehicle
- 1,1031 vehicle
- 7072 vehicles
- 1693 vehicles
- 484 vehicles
- 05+ vehicles

- Rooms in owner-occupied houses in Waynesboro, Pennsylvania
- 01 room
- 342 rooms
- 263 rooms
- 2064 rooms
- 3195 rooms
- 6536 rooms
- 2727 rooms
- 4208 rooms
- 4059+ rooms

- Rooms in renter-occupied apartments in Waynesboro, Pennsylvania
- 871 room
- 1132 rooms
- 2783 rooms
- 4964 rooms
- 5155 rooms
- 4186 rooms
- 1887 rooms
- 588 rooms
- 1949+ rooms


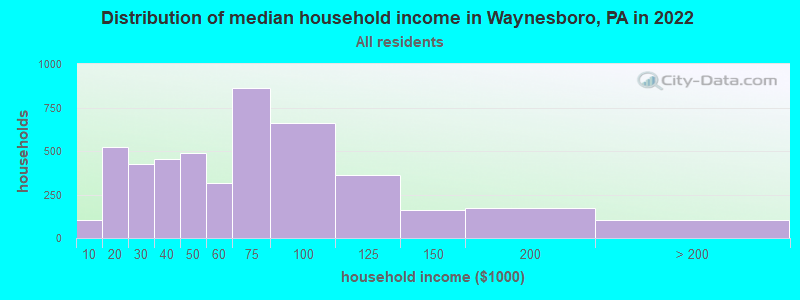
Waynesboro, PA household income distribution

- 103Less than $10,000
- 523$10,000 to $19,999
- 428$20,000 to $29,999
- 453$30,000 to $39,999
- 490$40,000 to $49,999
- 318$50,000 to $59,999
- 863$60,000 to $74,999
- 662$75,000 to $99,999
- 361$100,000 to $124,999
- 160$125,000 to $149,999
- 171$150,000 to $199,999
- 102$200,000 or more
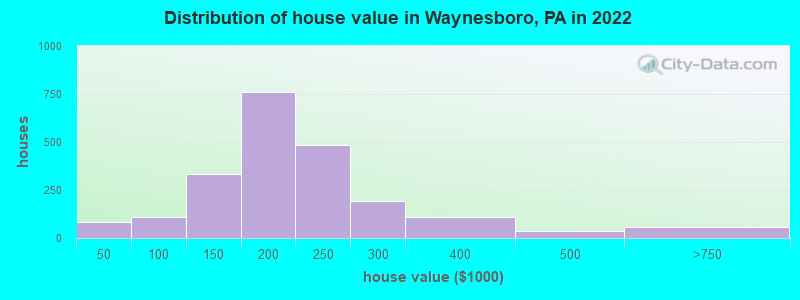
Home value of owner - occupied houses in 2022 in Waynesboro, PA
-
- 64Less than $10,000
- 7$10,000 to $14,999
- 9$15,000 to $19,999
- 2$20,000 to $24,999
- 22$50,000 to $59,999
- 16$60,000 to $69,999
- 39$70,000 to $79,999
- 13$80,000 to $89,999
- 19$90,000 to $99,999
- 92$100,000 to $124,999
- 240$125,000 to $149,999
- 550$150,000 to $174,999
- 212$175,000 to $199,999
- 484$200,000 to $249,999
- 195$250,000 to $299,999
- 110$300,000 to $399,999
- 34$400,000 to $499,999
- 55$500,000 to $749,999
Rent paid by renters in 2022 in Waynesboro, PA
-
- 39Less than $100
- 12$150 to $199
- 84$200 to $249
- 6$250 to $299
- 115$300 to $349
- 17$350 to $399
- 10$400 to $449
- 38$450 to $499
- 63$500 to $549
- 177$550 to $599
- 83$600 to $649
- 70$650 to $699
- 330$700 to $749
- 156$750 to $799
- 350$800 to $899
- 222$900 to $999
- 123$1,000 to $1,249
- 183$1,250 to $1,499
- 102$1,500 to $1,999
- 12$2,000 to $2,499
- 22No cash rent


Percentage of workers working in this county: 62.0%
Number of people working at home: 268 (5.1% of all workers)
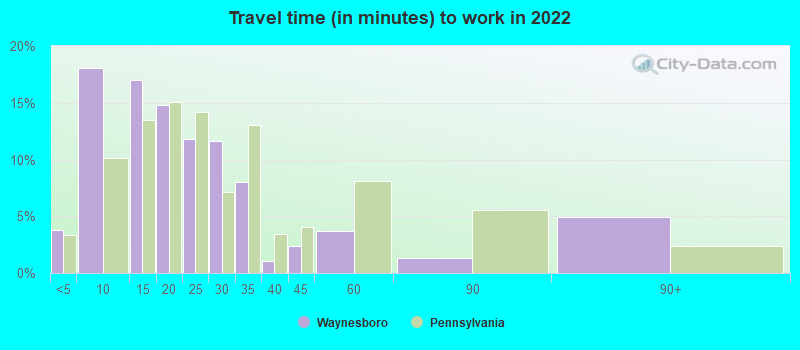
Travel time to work (commute)
- Less than 5 minutes: 210
- 5 to 9 minutes: 588
- 10 to 14 minutes: 514
- 15 to 19 minutes: 417
- 20 to 24 minutes: 611
- 25 to 29 minutes: 1,060
- 30 to 34 minutes: 501
- 35 to 39 minutes: 212
- 40 to 44 minutes: 244
- 45 to 59 minutes: 259
- 60 to 89 minutes: 209
- 90 or more minutes: 160
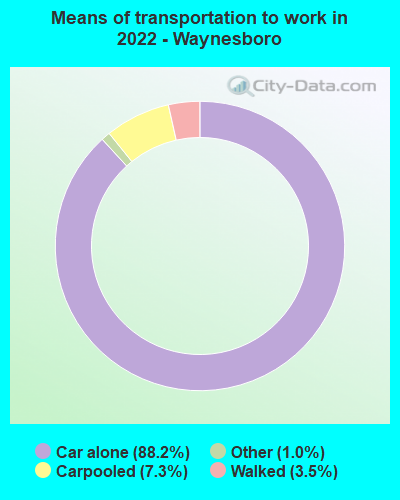
Means of transportation to work:
- Drove a car alone: 3,783 (81.5%)
- Carpooled: 311 (6.7%)
- Taxi: 52 (1.1%)
- Walked: 148 (3.2%)
- Worked at home: 268 (5.8%)

- Unemployment by race in 2022
- Unemployment rate for White non-Hispanic residents
- 7.4%Males
- 0.2%Females
- Unemployment rate for American Indian and Alaska Native residents
- 100.0%Males
- Unemployment rate for Hispanic or Latino residents
- 11.2%Males
- 3.1%Females

- Year of entry for the foreign-born population in Waynesboro, Pennsylvania
- 222010 or later
- 2102000 to 2009
- 281990 to 1999
- 151980 to 1989
- 261970 to 1979
- 33Before 1970

First ancestries reported:
- American: 1,458 (32.1%)
- German: 1,108 (24.4%)
- English: 255 (5.6%)
- Irish: 166 (3.7%)
- European: 129 (2.8%)
- Scottish: 105 (2.3%)
- Italian: 71 (1.6%)
- African: 33 (0.7%)
- Welsh: 32 (0.7%)
- Swedish: 30 (0.7%)
- Syrian: 25 (0.6%)
- Canadian: 20 (0.4%)
- Polish: 19 (0.4%)
- Swiss: 19 (0.4%)
- Czech: 13 (0.3%)
- Cape Verdean: 9 (0.2%)
- Serbian: 8 (0.2%)
- French Canadian: 6 (0.1%)
- Scandinavian: 5 (0.1%)
- Scotch-Irish: 4 (0.09%)
- Finnish: 3 (0.07%)
- Norwegian: 1 (0.02%)
Most common places of birth for foreign-born residents (%):
| Waynesboro: | 36.1% (101) |
| Pennsylvania: | 5.8% (54,190) |
| Waynesboro: | 27.9% (78) |
| Pennsylvania: | 0.1% (1,061) |
| Waynesboro: | 6.8% (19) |
| Pennsylvania: | 1.6% (15,272) |
| Waynesboro: | 6.8% (19) |
| Pennsylvania: | 1.8% (17,032) |
| Waynesboro: | 2.5% (7) |
| Pennsylvania: | 0.3% (3,273) |
| Waynesboro: | 2.5% (7) |
| Pennsylvania: | 1.9% (18,065) |
Place of birth for U.S.-born residents:
- This state: 5,714
- Other state: 5,108
- Northeast: 1,043
- Midwest: 391
- South: 3,440
- West: 183
88.8% of Waynesboro residents lived in the same house 1 years ago.
Out of people who lived in different houses, 26.9% lived in this county.
Out of people who lived in different counties, 11.9% lived in Pennsylvania.
| Waynesboro: | 88.8% |
| State average: | 89.3% |
Education attainment for males 25 years and older:
- No schooling: 51
- Nursery to 4th grade: 0
- 5th and 6th grade: 0
- 7th and 8th grade: 25
- 9th grade: 24
- 10th grade: 35
- 11th grade: 48
- 12th grade, no diploma: 130
- High school graduate (or equivalency): 1,273
- Less than 1 year of college: 264
- Some college more than 1 year, no degree: 533
- Associate degree: 296
- Bachelor's degree: 415
- Master's degree: 124
- Professional school degree: 13
- Doctorate degree: 11

Education attainment for females 25 years and older:
- No schooling: 41
- Nursery to 4th grade: 0
- 5th and 6th grade: 0
- 7th and 8th grade: 33
- 9th grade: 12
- 10th grade: 11
- 11th grade: 43
- 12th grade, no diploma: 213
- High school graduate (or equivalency): 1,714
- Less than 1 year of college: 297
- Some college more than 1 year, no degree: 727
- Associate degree: 531
- Bachelor's degree: 228
- Master's degree: 155
- Professional school degree: 24
- Doctorate degree: 41

Housing units in structures:
- One, detached: 2,231
- One, attached: 1,047
- Two: 551
- 3 or 4: 483
- 5 to 9: 225
- 10 to 19: 130
- 20 to 49: 15
- 50 or more: 79
- Mobile homes: 22
House/condo owner moved in on average 10 years ago
Renter moved in on average 3 years ago

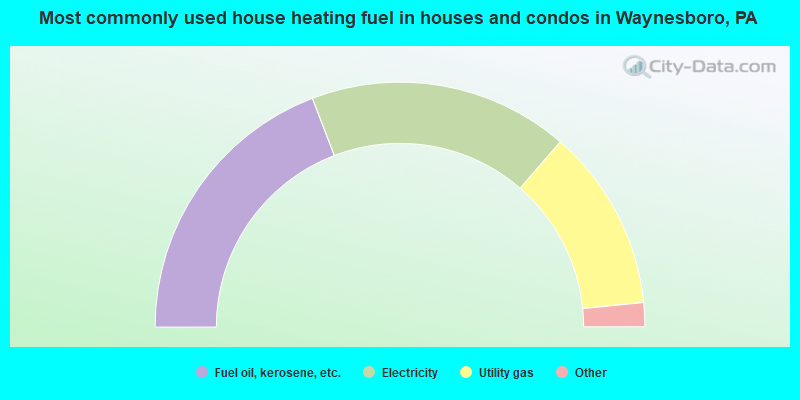
- 38.4%Fuel oil, kerosene, etc.
- 34.4%Electricity
- 24.1%Utility gas
- 1.9%Bottled, tank, or LP gas
- 0.8%Wood
- 0.4%No fuel used
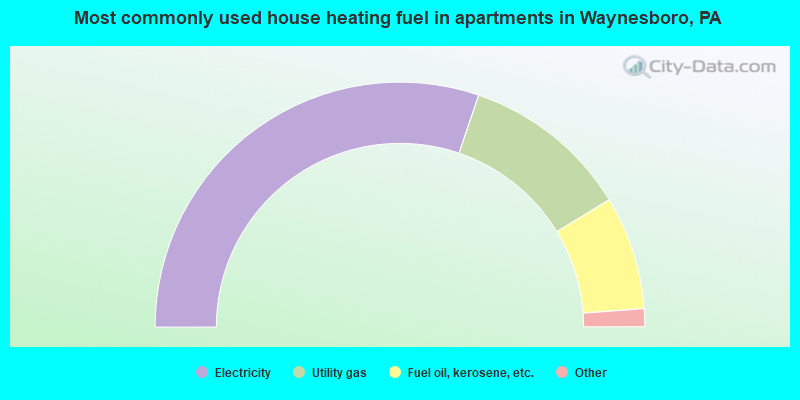
- 60.5%Electricity
- 22.2%Utility gas
- 15.0%Fuel oil, kerosene, etc.
- 1.9%No fuel used
- 0.4%Bottled, tank, or LP gas
Private vs. public school enrollment:
| Here: | 12.7% |
| Pennsylvania: | 15.7% |
| Here: | 4.2% |
| Pennsylvania: | 13.4% |
| Here: | 34.6% |
| Pennsylvania: | 39.8% |


