Housing density: 2,186 houses/condos per square mile
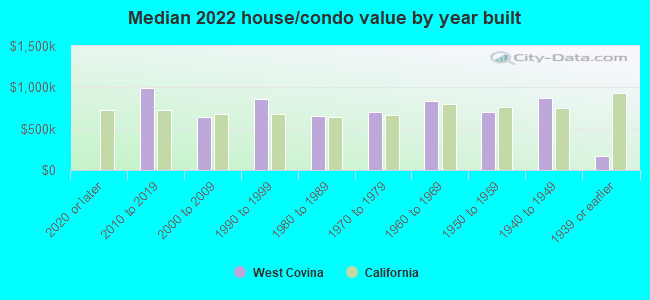
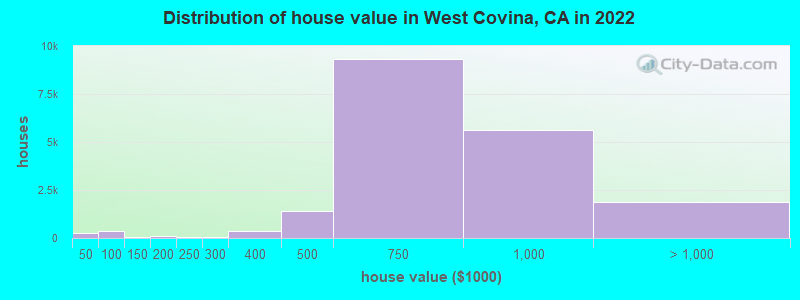
Median price asked for vacant for-sale houses and condos in 2022: $885,259.
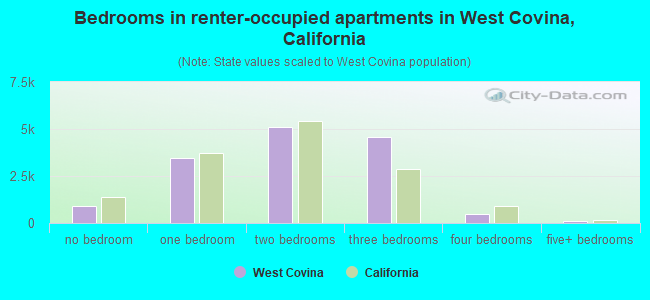
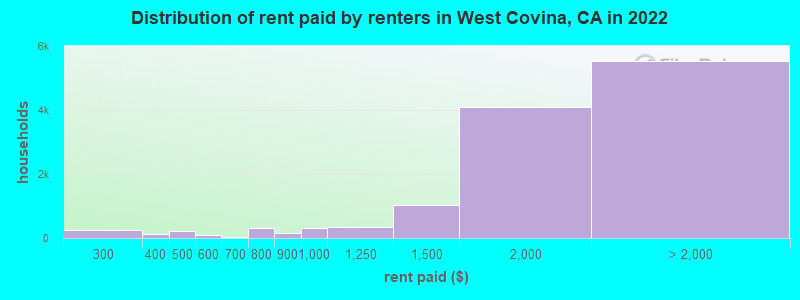
Median contract rent in 2022: $1,882 (lower quartile is $1,538, upper quartile is over $2,000)
Median rent asked for vacant for-rent units in 2022: $1,990
Median gross rent in West Covina, CA in 2022: over $2,000
Housing units in West Covina with a mortgage: 13,580 (977 second mortgage, 0 home equity loan, 606 both second mortgage and home equity loan) Houses without a mortgage: 554
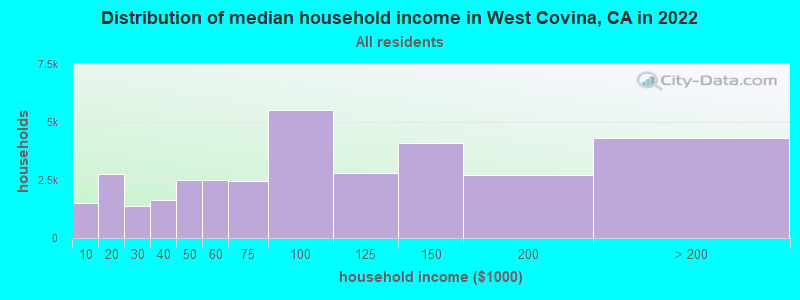
Median household income for houses/condos with a mortgage: $112,446
Median household income for apartments without a mortgage: $78,924
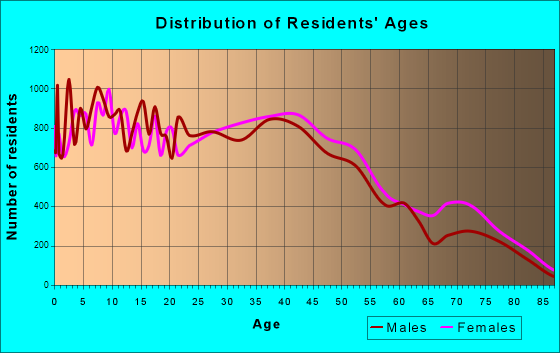
Size of family households: 7,046 2-persons, 5,653 3-persons, 7,026 4-persons, 4,146 5-persons, 949 6-persons, 626 7-or-more-persons.
Size of nonfamily households: 6,907 1-person, 1,394 2-persons, 357 3-persons.
12,234 married couples with children.
7,951 single-parent households (666 men, 7,285 women).
39.5% of residents of West Covina speak English at home.
33.5% of residents speak Spanish at home (75% speak English very well, 14% speak English well, 9% speak English not well, 2% don't speak English at all).
1.1% of residents speak other Indo-European language at home (64% speak English very well, 24% speak English well, 12% speak English not well).
24.9% of residents speak Asian or Pacific Island language at home (43% speak English very well, 33% speak English well, 17% speak English not well, 7% don't speak English at all).
0.9% of residents speak other language at home (75% speak English very well, 22% speak English well, 3% speak English not well).
Foreign born population: 36,729 (35.0%)
(65.6% of them are naturalized citizens)
Percentage of workers working in this county: 91.6% Number of people working at home: 6,079 (11.8% of all workers)
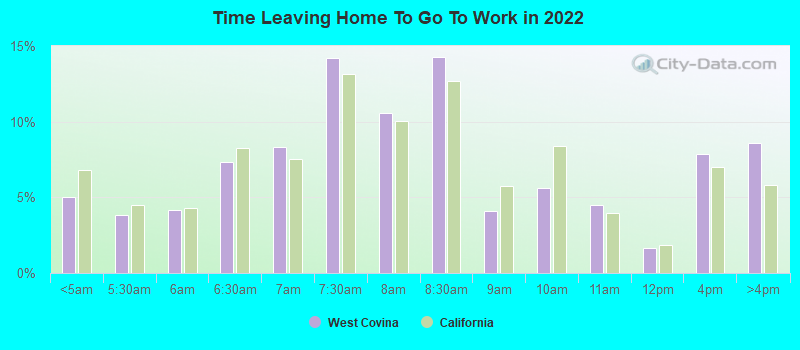
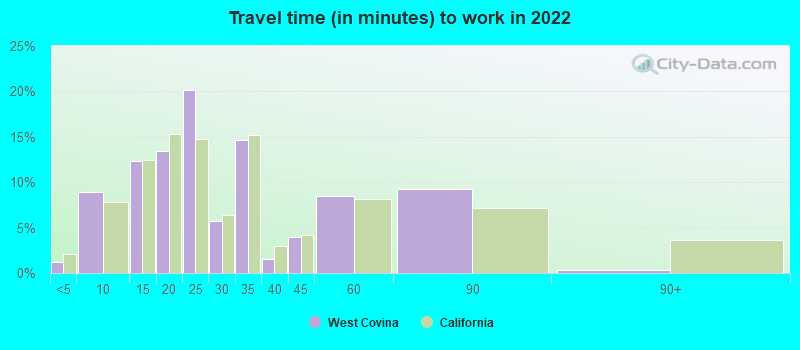
Travel time to work (commute)
Less than 5 minutes: 647
5 to 9 minutes: 2,477
10 to 14 minutes: 4,393
15 to 19 minutes: 4,877
20 to 24 minutes: 5,441
25 to 29 minutes: 1,792
30 to 34 minutes: 7,645
35 to 39 minutes: 1,190
40 to 44 minutes: 2,135
45 to 59 minutes: 5,832
60 to 89 minutes: 3,581
90 or more minutes: 1,434
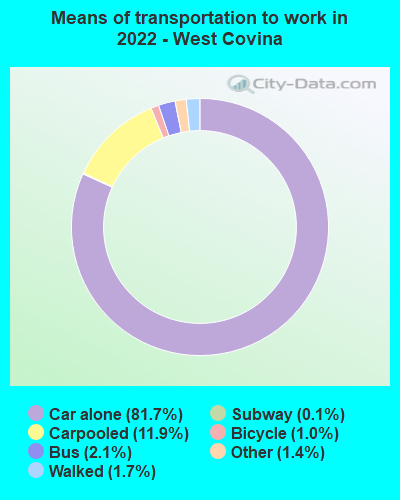
Means of transportation to work:
Drove a car alone: 19,942 (65.5%)
Carpooled: 3,211 (10.5%)
Bus: 461 (1.5%)
Subway or elevated rail: 5 (0.0%)
Long-distance train or commuter rail: 15 (0.0%)
Ferryboat: 14 (0.0%)
Taxi: 387 (1.3%)
Bicycle: 261 (0.9%)
Walked: 437 (1.4%)
Worked at home: 6,079 (20.0%)
Unemployment by race in 2022
Unemployment rate for White non-Hispanic residents
5.7%Males
17.2%Females
Unemployment rate for Black residents
1.8%Males
7.2%Females
Unemployment rate for American Indian and Alaska Native residents
2.5%Males
Unemployment rate for Asian residents
3.2%Males
2.7%Females
Unemployment rate for other race residents
8.5%Males
13.9%Females
Unemployment rate for two or more race residents
3.8%Males
8.8%Females
Unemployment rate for Hispanic or Latino residents
4.5%Males
10.0%Females
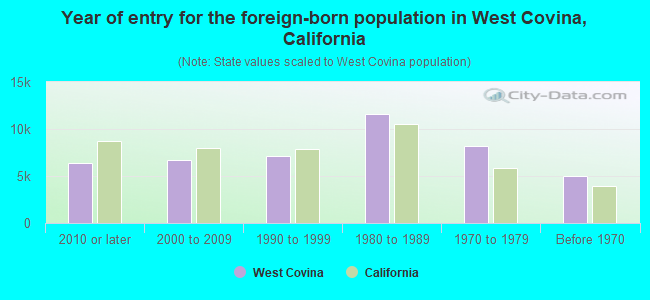
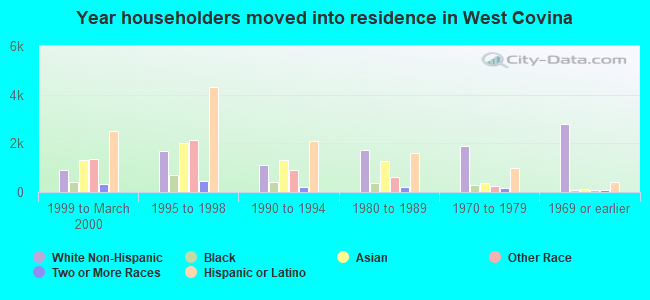
Year of entry for the foreign-born population in West Covina, California
6,3612010 or later
6,6642000 to 2009
7,0801990 to 1999
11,5861980 to 1989
8,2371970 to 1979
4,958Before 1970
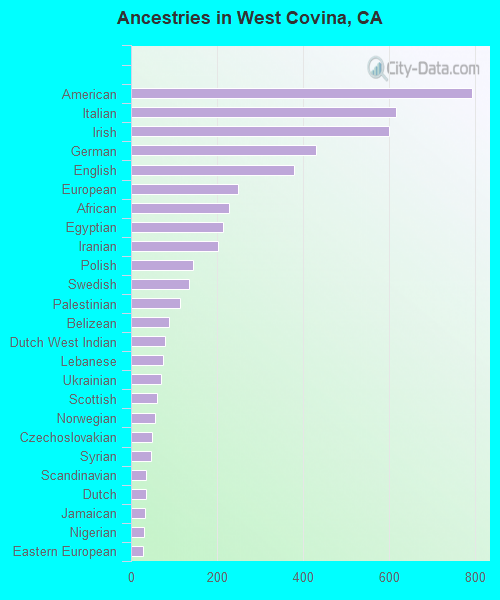
First ancestries reported:
American: 794 (1.1%)
Italian: 617 (0.9%)
Irish: 601 (0.8%)
German: 430 (0.6%)
English: 379 (0.5%)
European: 250 (0.4%)
African: 229 (0.3%)
Egyptian: 215 (0.3%)
Iranian: 203 (0.3%)
Polish: 145 (0.2%)
Swedish: 136 (0.2%)
Palestinian: 114 (0.2%)
Belizean: 89 (0.1%)
Dutch West Indian: 80 (0.1%)
Lebanese: 74 (0.1%)
Ukrainian: 71 (0.1%)
Scottish: 61 (0.09%)
Norwegian: 55 (0.08%)
Czechoslovakian: 48 (0.07%)
Syrian: 47 (0.07%)
Scandinavian: 35 (0.05%)
Dutch: 35 (0.05%)
Jamaican: 33 (0.05%)
Nigerian: 30 (0.04%)
Eastern European: 29 (0.04%)
Greek: 29 (0.04%)
Portuguese: 27 (0.04%)
British: 26 (0.04%)
Danish: 25 (0.04%)
Arab: 23 (0.03%)
Armenian: 22 (0.03%)
Russian: 22 (0.03%)
Croatian: 20 (0.03%)
Iraqi: 20 (0.03%)
Moroccan: 19 (0.03%)
Romanian: 19 (0.03%)
Scotch-Irish: 19 (0.03%)
Jordanian: 13 (0.02%)
Slovak: 13 (0.02%)
French: 13 (0.02%)
Austrian: 12 (0.02%)
French Canadian: 11 (0.02%)
Canadian: 10 (0.01%)
Czech: 10 (0.01%)
Welsh: 10 (0.01%)
Slovene: 9 (0.01%)
Serbian: 8 (0.01%)
Estonian: 6 (0.01%)
Finnish: 4 (0.01%)
Ethiopian: 4 (0.01%)
Most common places of birth for foreign-born residents (%):
Mexico
West Covina:
25.4% (9,560)
California:
37.2% (3,881,193)
Philippines
West Covina:
15.5% (5,838)
California:
7.8% (818,297)
China, excluding Hong Kong and Taiwan
West Covina:
14.7% (5,535)
California:
6.6% (684,672)
Vietnam
West Covina:
9.1% (3,408)
California:
4.9% (512,335)
Taiwan
West Covina:
5.5% (2,058)
California:
1.7% (176,274)
El Salvador
West Covina:
3.1% (1,164)
California:
4.2% (440,287)
Hong Kong
West Covina:
2.4% (891)
California:
1.0% (105,215)
Nicaragua
West Covina:
2.3% (882)
California:
0.6% (58,161)
Guatemala
West Covina:
1.9% (711)
California:
2.8% (290,436)
Peru
West Covina:
1.8% (688)
California:
0.7% (74,025)
India
West Covina:
1.8% (659)
California:
5.2% (539,184)
Place of birth for U.S.-born residents:
This state: 59,336
Other state: 7,447
Northeast: 1,280
Midwest: 1,617
South: 2,126
West: 2,424
91.7% of West Covina residents lived in the same house 1 years ago. Out of people who lived in different houses, 44.0% lived in this county. Out of people who lived in different counties, 78.8% lived in California.
West Covina:
91.7%
State average:
88.9%
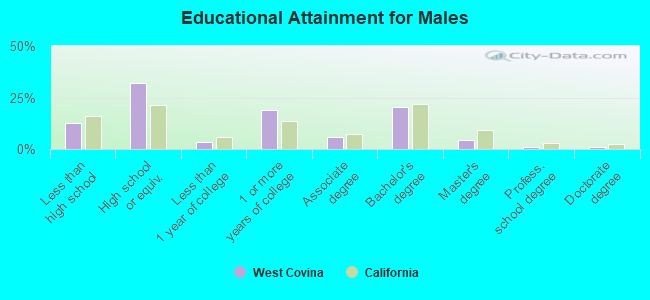
Education attainment for males 25 years and older:
No schooling: 1,019
Nursery to 4th grade: 410
5th and 6th grade: 313
7th and 8th grade: 178
9th grade: 328
10th grade: 514
11th grade: 228
12th grade, no diploma: 1,344
High school graduate (or equivalency): 10,848
Less than 1 year of college: 1,190
Some college more than 1 year, no degree: 6,435
Associate degree: 2,008
Bachelor's degree: 6,929
Master's degree: 1,485
Professional school degree: 338
Doctorate degree: 316
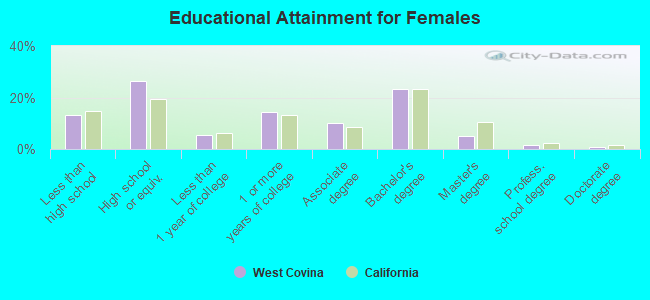
Education attainment for females 25 years and older:
No schooling: 912
Nursery to 4th grade: 437
5th and 6th grade: 142
7th and 8th grade: 275
9th grade: 632
10th grade: 572
11th grade: 870
12th grade, no diploma: 1,317
High school graduate (or equivalency): 10,348
Less than 1 year of college: 2,141
Some college more than 1 year, no degree: 5,574
Associate degree: 4,010
Bachelor's degree: 9,155
Master's degree: 1,918
Professional school degree: 624
Doctorate degree: 259
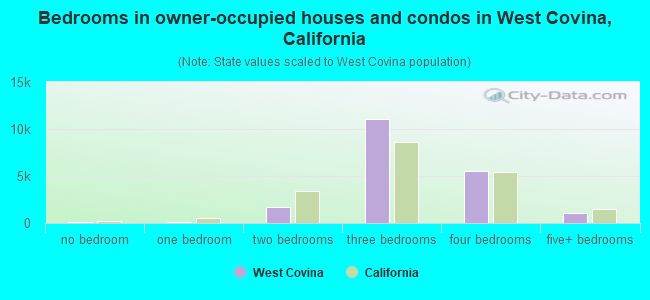
Housing units in structures:
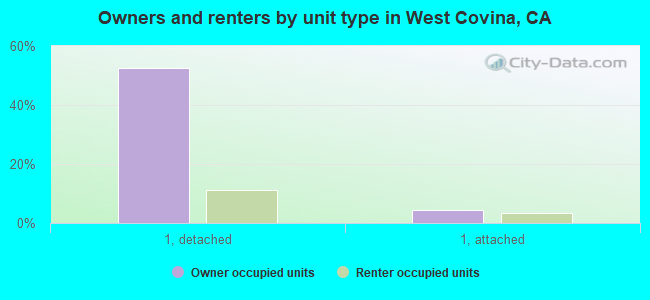
One, detached: 21,873
One, attached: 2,604
Two: 665
3 or 4: 1,674
5 to 9: 1,664
10 to 19: 909
20 to 49: 1,396
50 or more: 4,265
Mobile homes: 148
Median worth of mobile homes: $164,500
Housing units lacking complete plumbing facilities in 2022: 0.3%
Housing units lacking complete kitchen facilities in 2022: 2.2%
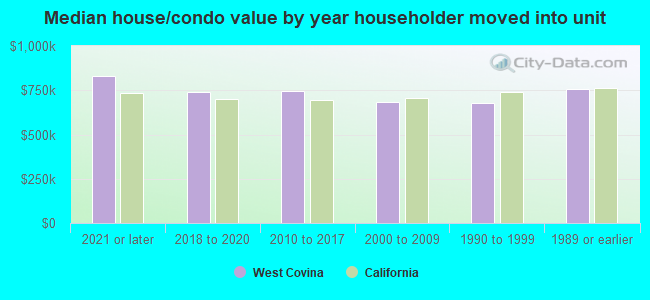
House/condo owner moved in on average 18 years ago