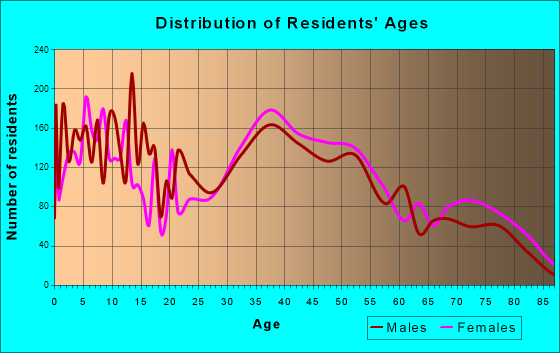
West Hempstead, NY (New York) Houses and Residents
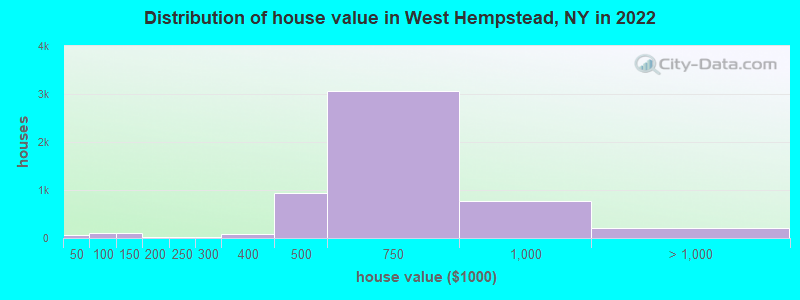
Estimated median house or condo value in 2022: $612,874 (it was $218,400 in 2000 )
West Hempstead:
$612,874New York:
$400,400
Lower value quartile - upper value quartile: $508,339 - $733,431Total population: 18,862 (Urban population: 18,707, Rural population: 0)
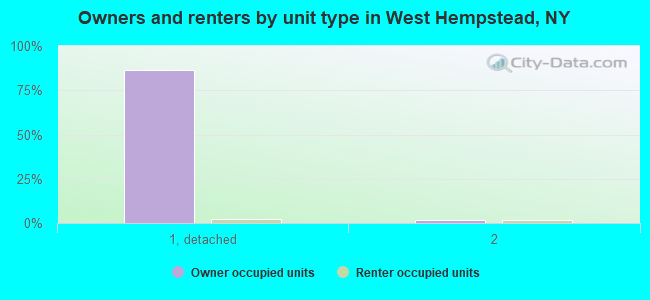
Houses: 6,207 (5,983 occupied: 5,454 owner occupied, 518 renter occupied )
% of renters here:
9%State:
46%
Housing density: 2,335 houses/condos per square mile
Median price asked for vacant for-sale houses and condos in 2022: $506,446.
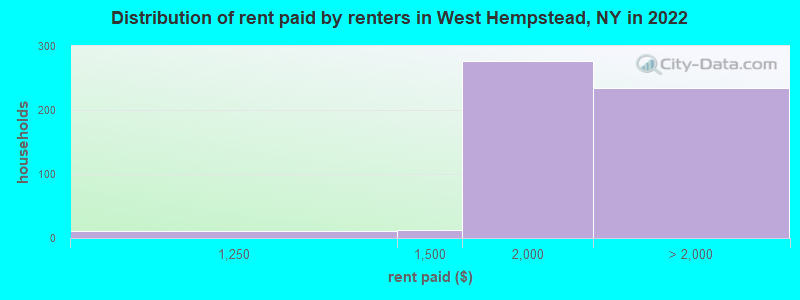
Median contract rent in 2022: $1,852 (lower quartile is $1,575, upper quartile is over $2,000)
Median rent asked for vacant for-rent units in 2022: $18,563
Median gross rent in West Hempstead, NY in 2022: over $2,000
Housing units in West Hempstead with a mortgage: 3,678 (534 second mortgage, 0 home equity loan, 464 both second mortgage and home equity loan )Houses without a mortgage: 126
Median household income for houses/condos with a mortgage: $169,519
Median household income for apartments without a mortgage: $109,224
Median monthly housing costs: $2,789
Data:
Median house or condo value ($)
Median house or condo value ($ change since 2000)
Median house or condo value ($) - White
Median house or condo value ($) - Black or African American
Median house or condo value ($) - Asian
Median house or condo value ($) - Hispanic or Latino
Median house or condo value ($) - American Indian and Alaska Native
Median house or condo value ($) - Multirace
Median house or condo value ($) - Other Race
Median price asked for mobile homes ($)
Household density (households per square mile)
Mean house or condo value by units in structure - 1, detached ($)
Mean house or condo value by units in structure - 1, attached ($)
Mean house or condo value by units in structure - 2 ($)
Mean house or condo value by units in structure by units in structure - 3 or 4 ($)
Mean house or condo value by units in structure - 5 or more ($)
Mean house or condo value by units in structure - Boat, RV, van, etc. ($)
Mean house or condo value by units in structure - Mobile home ($)
Median contract rent ($)
Median contract rent - Lower quartile ($)
Median contract rent - Upper quartile ($)
Median gross rent ($)
Urban houses (%)
Rural houses (%)
Houses occupied (%)
Houses occupied (% change since 2000)
Houses owner occupied (%)
Houses owner occupied (% change since 2000)
Houses renter occupied (%)
Houses renter occupied (% change since 2000)
Vacant housing units - For rent (%)
Vacant housing units - For rent (% change since 2000)
Vacant housing units - For sale only (%)
Vacant housing units - For sale only (% change since 2000)
Vacant housing units - Rented or sold, not occupied (%)
Vacant housing units - Rented or sold, not occupied (% change since 2000)
Vacant housing units - For seasonal, recreational, or occasional use (%)
Vacant housing units - For seasonal, recreational, or occasional use (% change since 2000)
Vacant housing units - For migrant workers (%)
Vacant housing units - For migrant workers (% change since 2000)
Vacant housing units - Other vacant (%)
Vacant housing units - Other vacant (% change since 2000)
Median monthly housing costs ($)
Median household income for houses/condos with a mortgage ($)
Median household income for houses/condos without a mortgage ($)
Median household income ($)
Median household income ($) - White
Median household income ($) - Black or African American
Median household income ($) - Asian
Median household income ($) - Hispanic or Latino
Median household income ($) - American Indian and Alaska Native
Median household income ($) - Multirace
Median household income ($) - Other Race
Mortgage status - with mortgage (%)
Mortgage status - with second mortgage (%)
Mortgage status - with home equity loan (%)
Mortgage status - with both second mortgage and home equity loan (%)
Mortgage status - without a mortgage (%)
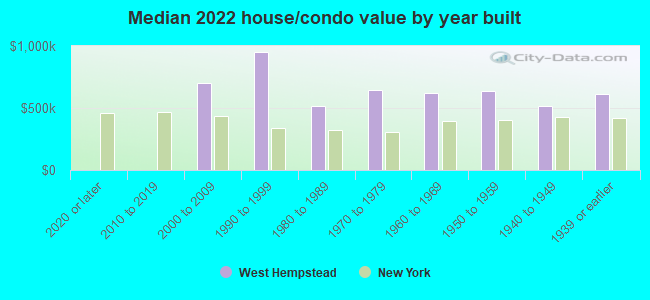
Median year house/condo built
Median year apartment built
Household type by relationship - Male householder living alone (%)
Household type by relationship - Male householder not living alone (%)
Household type by relationship - Female householder living alone (%)
Household type by relationship - Female householder not living alone (%)
Household type by relationship - Opposite-Sex spouse (%)
Household type by relationship - Same-Sex spouse (%)
Household type by relationship - Opposite-Sex unmarried partner (%)
Household type by relationship - Same-Sex unmarried partner (%)
Household type by relationship - In group quarters (%)
Size of family households - 2-person household (%)
Size of family households - 3-person household (%)
Size of family households - 4-person household (%)
Size of family households - 5-person household (%)
Size of family households - 6-person household (%)
Size of family households - 7-or-more-person household (%)
Size of nonfamily households - 1-person household (%)
Size of nonfamily households - 2-person household (%)
Size of nonfamily households - 3-person household (%)
Size of nonfamily households - 4-person household (%)
Size of nonfamily households - 5-person household (%)
Size of nonfamily households - 6-person household (%)
Size of nonfamily households - 7-or-moreperson household (%)
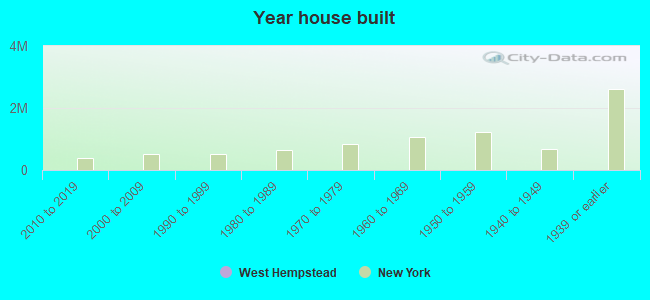
Year house built - Built 2010 or later (%)
Year house built - Built 2000 to 2009 (%)
Year house built - Built 1990 to 1999 (%)
Year house built - Built 1980 to 1989 (%)
Year house built - Built 1970 to 1979 (%)
Year house built - Built 1960 to 1969 (%)
Year house built - Built 1950 to 1959 (%)
Year house built - Built 1940 to 1949 (%)
Year house built - Built 1939 or earlier (%)
Median number of rooms in houses and condos
Median number of rooms in apartments
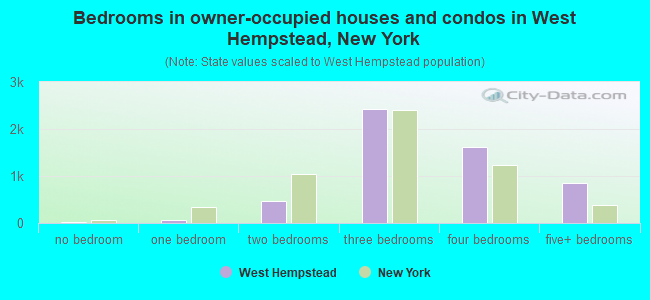
Median number of bedrooms in owner occupied houses
Mean number of bedrooms in owner occupied houses
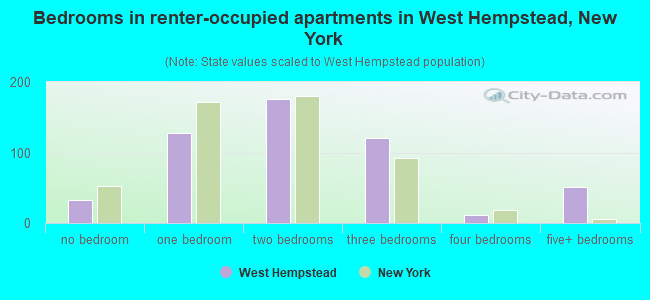
Median number of bedrooms in renter occupied houses
Mean number of bedrooms in renter occupied houses
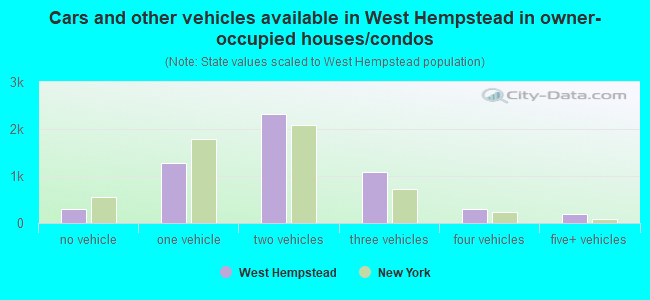
Median number of vehichles in owner occupied houses
Mean number of vehichles in owner occupied houses
Median number of vehichles in renter occupied houses
Mean number of vehichles in renter occupied houses
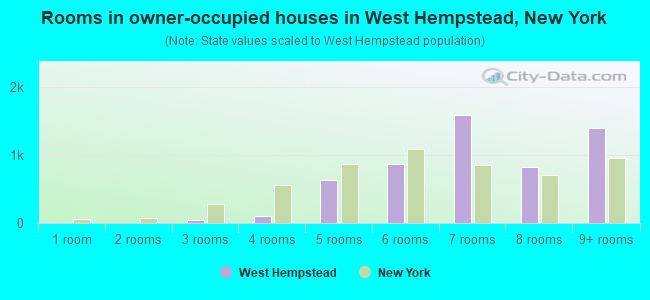
Rooms in owner-occupied houses - 1 room (%)
Rooms in owner-occupied houses - 2 rooms (%)
Rooms in owner-occupied houses - 3 rooms (%)
Rooms in owner-occupied houses - 4 rooms (%)
Rooms in owner-occupied houses - 5 rooms (%)
Rooms in owner-occupied houses - 6 rooms (%)
Rooms in owner-occupied houses - 7 rooms (%)
Rooms in owner-occupied houses - 8 rooms (%)
Rooms in owner-occupied houses - 9+ rooms (%)
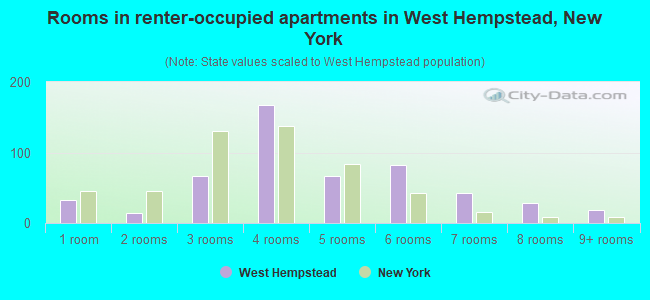
Rooms in renter-occupied houses - 1 room (%)
Rooms in renter-occupied houses - 2 rooms (%)
Rooms in renter-occupied houses - 3 rooms (%)
Rooms in renter-occupied houses - 4 rooms (%)
Rooms in renter-occupied houses - 5 rooms (%)
Rooms in renter-occupied houses - 6 rooms (%)
Rooms in renter-occupied houses - 7 rooms (%)
Rooms in renter-occupied houses - 8 rooms (%)
Rooms in renter-occupied houses - 9+ rooms (%)
Bedrooms in owner-occupied houses - no bedrooms (%)
Bedrooms in owner-occupied houses - 1 bedroom (%)
Bedrooms in owner-occupied houses - 2 bedrooms (%)
Bedrooms in owner-occupied houses - 3 bedrooms (%)
Bedrooms in owner-occupied houses - 4 bedrooms (%)
Bedrooms in owner-occupied houses - 5+ bedrooms (%)
Bedrooms in renter-occupied houses - no bedrooms (%)
Bedrooms in renter-occupied houses - 1 bedroom (%)
Bedrooms in renter-occupied houses - 2 bedrooms (%)
Bedrooms in renter-occupied houses - 3 bedrooms (%)
Bedrooms in renter-occupied houses - 4 bedrooms (%)
Bedrooms in renter-occupied houses - 5+ bedrooms (%)
Vehicles available in owner-occupied houses - no vehicle available (%)
Vehicles available in owner-occupied houses - 1 vehicle available(%)
Vehicles available in owner-occupied houses - 2 Vehicles available (%)
Vehicles available in owner-occupied houses - 3 Vehicles available (%)
Vehicles available in owner-occupied houses - 4 Vehicles available (%)
Vehicles available in owner-occupied houses - 5+ Vehicles available (%)
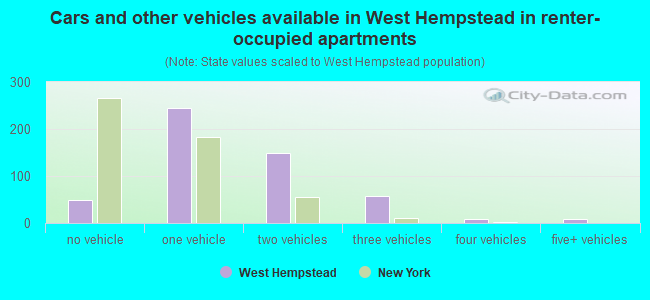
Vehicles available in renter-occupied houses - no vehicle available (%)
Vehicles available in renter-occupied houses - 1 vehicle available (%)
Vehicles available in renter-occupied houses - 2 Vehicles available (%)
Vehicles available in renter-occupied houses - 3 Vehicles available (%)
Vehicles available in renter-occupied houses - 4 Vehicles available (%)
Vehicles available in renter-occupied houses - 5+ Vehicles available (%)
Housing units in structures - 1, detached (%)
Housing units in structures - 1, attached (%)
Housing units in structures - 2 (%)
Housing units in structures - 3 or 4 (%)
Housing units in structures - 5 to 9 (%)
Housing units in structures - 10 to 19 (%)
Housing units in structures - 20 to 49 (%)
Housing units in structures - 50 or more (%)
Housing units in structures - Mobile home (%)
Housing units in structures - Boat, RV, van, etc. (%)
Housing units in structures - Owners - 1, detached (%)
Housing units in structures - Owners - 1, attached (%)
Housing units in structures - Owners - 2 (%)
Housing units in structures - Owners - 3 or 4 (%)
Housing units in structures - Owners - 5 to 9 (%)
Housing units in structures - Owners - 10 to 19 (%)
Housing units in structures - Owners - 20 to 49 (%)
Housing units in structures - Owners - 50 or more (%)
Housing units in structures - Owners - Mobile home (%)
Housing units in structures - Owners - Boat, RV, van, etc. (%)
Housing units in structures - Renters - 1, detached (%)
Housing units in structures - Renters - 1, attached (%)
Housing units in structures - Renters - 2 (%)
Housing units in structures - Renters - 3 or 4 (%)
Housing units in structures - Renters - 5 to 9 (%)
Housing units in structures - Renters - 10 to 19 (%)
Housing units in structures - Renters - 20 to 49 (%)
Housing units in structures - Renters - 50 or more (%)
Housing units in structures - Renters - Mobile home (%)
Housing units in structures - Renters - Boat, RV, van, etc. (%)
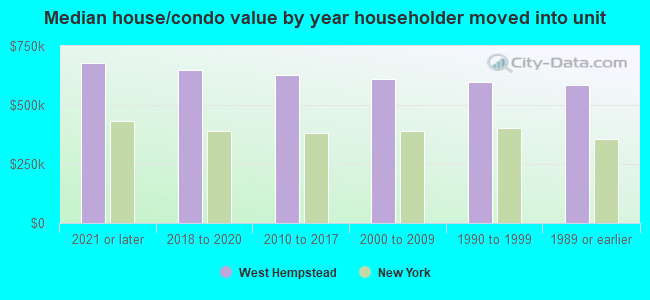
House/condo owner moved in on average (years ago)
Renter moved in on average (years ago)
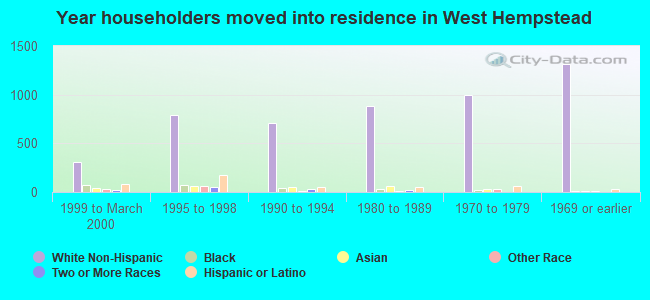
Year householder moved into unit - Moved in 1999 to March 2000 (%)
Year householder moved into unit - Moved in 1999 to March 2000 (%) - White
Year householder moved into unit - Moved in 1999 to March 2000 (%) - Black or African American
Year householder moved into unit - Moved in 1999 to March 2000 (%) - Asian
Year householder moved into unit - Moved in 1999 to March 2000 (%) - Hispanic or Latino
Year householder moved into unit - Moved in 1999 to March 2000 (%) - American Indian and Alaska Native
Year householder moved into unit - Moved in 1999 to March 2000 (%) - Multirace
Year householder moved into unit - Moved in 1999 to March 2000 (%) - Other Race
Year householder moved into unit - Moved in 1995 to 1998 (%)
Year householder moved into unit - Moved in 1995 to 1998 (%) - White
Year householder moved into unit - Moved in 1995 to 1998 (%) - Black or African American
Year householder moved into unit - Moved in 1995 to 1998 (%) - Asian
Year householder moved into unit - Moved in 1995 to 1998 (%) - Hispanic or Latino
Year householder moved into unit - Moved in 1995 to 1998 (%) - American Indian and Alaska Native
Year householder moved into unit - Moved in 1995 to 1998 (%) - Multirace
Year householder moved into unit - Moved in 1995 to 1998 (%) - Other Race
Year householder moved into unit - Moved in 1990 to 1994 (%)
Year householder moved into unit - Moved in 1990 to 1994 (%) - White
Year householder moved into unit - Moved in 1990 to 1994 (%) - Black or African American
Year householder moved into unit - Moved in 1990 to 1994 (%) - Asian
Year householder moved into unit - Moved in 1990 to 1994 (%) - Hispanic or Latino
Year householder moved into unit - Moved in 1990 to 1994 (%) - American Indian and Alaska Native
Year householder moved into unit - Moved in 1990 to 1994 (%) - Multirace
Year householder moved into unit - Moved in 1990 to 1994 (%) - Other Race
Year householder moved into unit - Moved in 1980 to 1989 (%)
Year householder moved into unit - Moved in 1980 to 1989 (%) - White
Year householder moved into unit - Moved in 1980 to 1989 (%) - Black or African American
Year householder moved into unit - Moved in 1980 to 1989 (%) - Asian
Year householder moved into unit - Moved in 1980 to 1989 (%) - Hispanic or Latino
Year householder moved into unit - Moved in 1980 to 1989 (%) - American Indian and Alaska Native
Year householder moved into unit - Moved in 1980 to 1989 (%) - Multirace
Year householder moved into unit - Moved in 1980 to 1989 (%) - Other Race
Year householder moved into unit - Moved in 1970 to 1979 (%)
Year householder moved into unit - Moved in 1970 to 1979 (%) - White
Year householder moved into unit - Moved in 1970 to 1979 (%) - Black or African American
Year householder moved into unit - Moved in 1970 to 1979 (%) - Asian
Year householder moved into unit - Moved in 1970 to 1979 (%) - Hispanic or Latino
Year householder moved into unit - Moved in 1970 to 1979 (%) - American Indian and Alaska Native
Year householder moved into unit - Moved in 1970 to 1979 (%) - Multirace
Year householder moved into unit - Moved in 1970 to 1979 (%) - Other Race
Year householder moved into unit - Moved in 1969 or earlier (%)
Year householder moved into unit - Moved in 1969 or earlier (%) - White
Year householder moved into unit - Moved in 1969 or earlier (%) - Black or African American
Year householder moved into unit - Moved in 1969 or earlier (%) - Asian
Year householder moved into unit - Moved in 1969 or earlier (%) - Hispanic or Latino
Year householder moved into unit - Moved in 1969 or earlier (%) - American Indian and Alaska Native
Year householder moved into unit - Moved in 1969 or earlier (%) - Multirace
Year householder moved into unit - Moved in 1969 or earlier (%) - Other Race
Housing units lacking complete plumbing facilities (%)
Housing units lacking complete kitchen facilities (%)
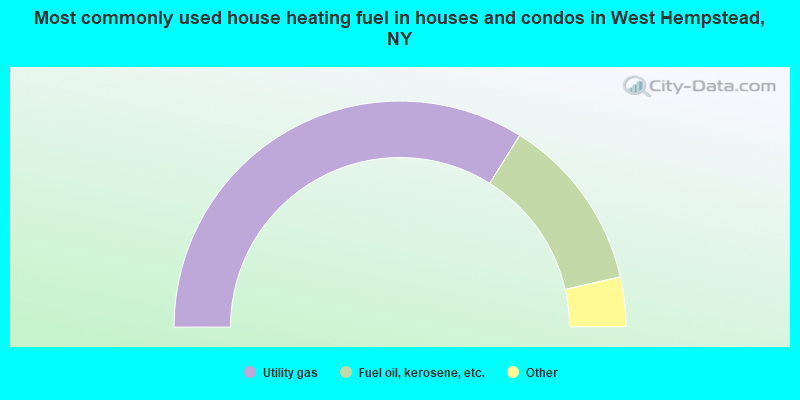
House heating fuel used in houses and condos - Utility gas (%)
House heating fuel used in houses and condos - Bottled, tank, or LP gas (%)
House heating fuel used in houses and condos - Electricity (%)
House heating fuel used in houses and condos - Fuel oil, kerosene, etc. (%)
House heating fuel used in houses and condos - Coal or coke (%)
House heating fuel used in houses and condos - Wood (%)
House heating fuel used in houses and condos - Solar energy (%)
House heating fuel used in houses and condos - Other fuel (%)
House heating fuel used in houses and condos - No fuel used (%)
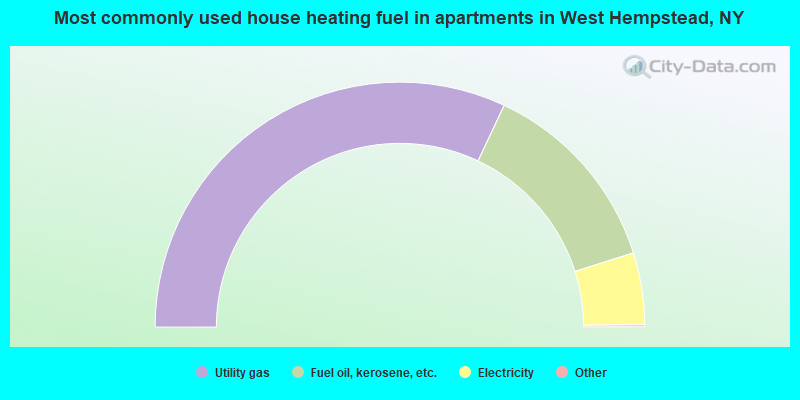
House heating fuel used in apartments - Utility gas (%)
House heating fuel used in apartments - Bottled, tank, or LP gas (%)
House heating fuel used in apartments - Electricity (%)
House heating fuel used in apartments - Fuel oil, kerosene, etc. (%)
House heating fuel used in apartments - Coal or coke (%)
House heating fuel used in apartments - Wood (%)
House heating fuel used in apartments - Solar energy (%)
House heating fuel used in apartments - Other fuel (%)
House heating fuel used in apartments - No fuel used (%)
Median year house/condo built: 1952Median year apartment built: 1962Household type by relationship:
Households: 20,313
Male householders: 2,778 (288 living alone ), Female householders: 3,153 (536 living alone )3,866 spouses (3,858 opposite-sex spouses ), 284 unmarried partners , (256 opposite-sex unmarried partners ), 7,864 children (7,596 natural , 33 adopted , 234 stepchildren ), 230 grandchildren , 361 brothers or sisters , 431 parents , 0 foster children , 684 other relatives , 610 non-relatives In group quarters: 47
Size of family households: 1,450 2-persons , 889 3-persons , 1,341 4-persons , 773 5-persons , 282 6-persons , 210 7-or-more-persons .
Size of nonfamily households: 861 1-person , 74 2-persons , 4 3-persons , 25 4-persons , 7 5-persons , 10 6-persons , 12 7-or-more-persons .
3,567 married couples with children. single-parent households (280 men , 551 women ).
69.1% of residents of West Hempstead speak English at home. of residents speak Spanish at home (63% speak English very well , 22% speak English well , 12% speak English not well , 3% don't speak English at all ).of residents speak other Indo-European language at home (72% speak English very well , 19% speak English well , 10% speak English not well ).of residents speak Asian or Pacific Island language at home (59% speak English very well , 27% speak English well , 13% speak English not well , 1% don't speak English at all ).of residents speak other language at home (89% speak English very well , 6% speak English well , 5% speak English not well ).
Foreign born population: 3,894 (19.2%)of them are naturalized citizens )
Median number of rooms in houses and condos:
Median number of rooms in apartments
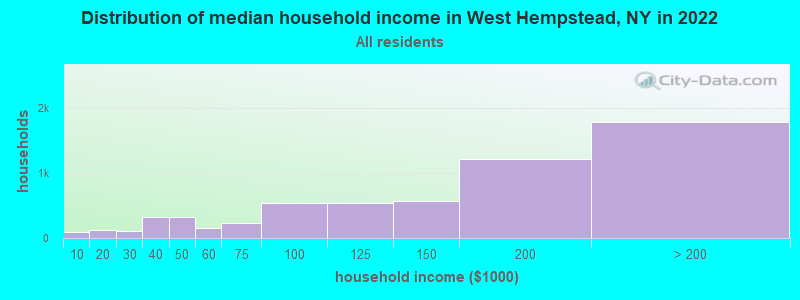
West Hempstead, NY household income distribution 91 Less than $10,000128 $10,000 to $19,999102 $20,000 to $29,999318 $30,000 to $39,999324 $40,000 to $49,999156 $50,000 to $59,999232 $60,000 to $74,999535 $75,000 to $99,999533 $100,000 to $124,999567 $125,000 to $149,9991,215 $150,000 to $199,9991,789 $200,000 or more
Home value of owner - occupied houses in 2022 in West Hempstead, NY 27 Less than $10,00031 $40,000 to $49,99943 $50,000 to $59,99913 $60,000 to $69,9997 $80,000 to $89,9994 $90,000 to $99,99983 $100,000 to $124,99919 $125,000 to $149,99922 $175,000 to $199,99925 $200,000 to $249,99916 $250,000 to $299,99975 $300,000 to $399,999935 $400,000 to $499,9993,061 $500,000 to $749,999766 $750,000 to $999,999188 $1,000,000 to $1,499,9997 $1,500,000 to $1,999,9994 $2,000,000 or moreRent paid by renters in 2022 in West Hempstead, NY 11 $1,000 to $1,24913 $1,250 to $1,499277 $1,500 to $1,9996 $2,000 to $2,49982 $2,500 to $2,99993 $3,000 to $3,49937 $3,500 or more13 No cash rent
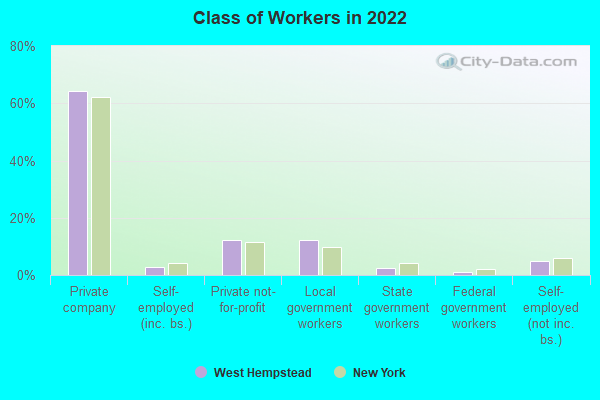
Percentage of workers working in this county: 61.6%Number of people working at home: 1,423 (14.6% of all workers )
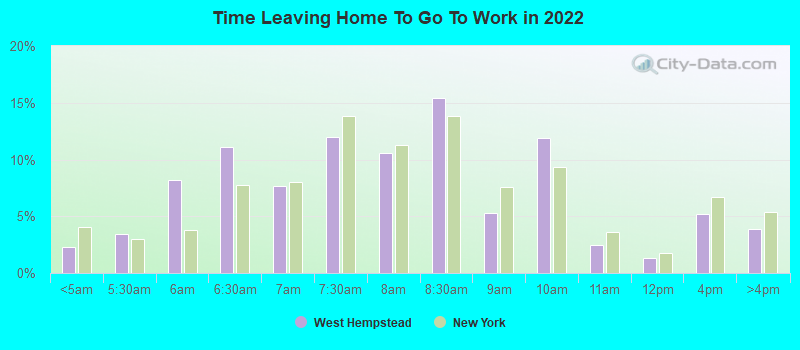
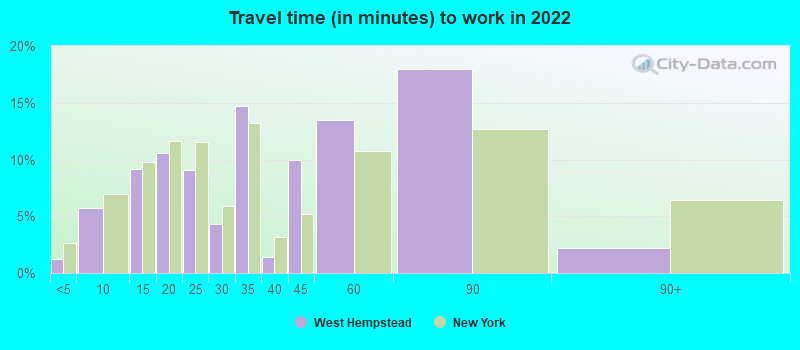
Travel time to work (commute)
Less than 5 minutes: 1375 to 9 minutes: 26110 to 14 minutes: 75515 to 19 minutes: 99020 to 24 minutes: 1,02625 to 29 minutes: 48530 to 34 minutes: 1,01635 to 39 minutes: 23340 to 44 minutes: 26445 to 59 minutes: 1,02160 to 89 minutes: 1,54190 or more minutes: 675
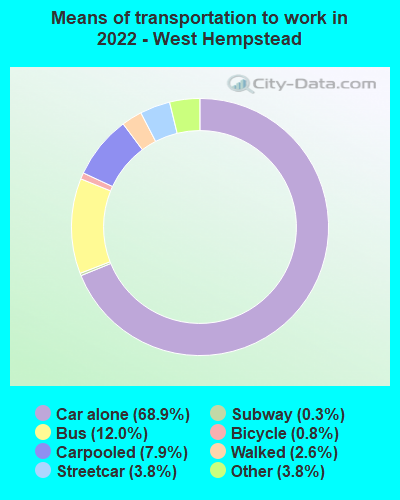
Means of transportation to work:
Drove a car alone: 2,464 (50.2%)Carpooled: 274 (5.6%)Bus : 415 (8.5%)Subway or elevated rail : 119 (2.4%)Long-distance train or commuter rail : 10 (0.2%)Taxi: 196 (4.0%)Bicycle: 41 (0.8%)Walked: 99 (2.0%)Worked at home: 1,423 (29.0%)
Unemployment by race in 2022
Unemployment rate for White non-Hispanic residents 5.2% Males7.5% FemalesUnemployment rate for Black residents 6.8% Males1.2% FemalesUnemployment rate for American Indian and Alaska Native residents 52.4% FemalesUnemployment rate for other race residents 3.3% MalesUnemployment rate for two or more race residents 1.9% Males4.8% FemalesUnemployment rate for Hispanic or Latino residents 2.5% Males2.0% Females
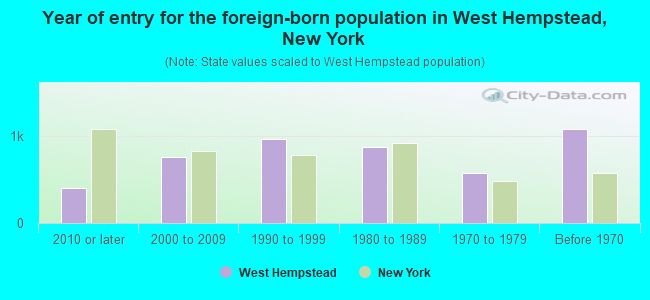
Year of entry for the foreign-born population in West Hempstead, New York
403 2010 or later 758 2000 to 2009 973 1990 to 1999 879 1980 to 1989 572 1970 to 1979 1,083 Before 1970
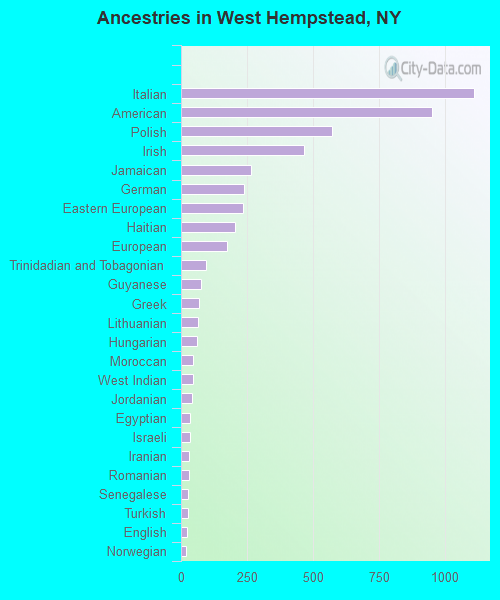
First ancestries reported:
Italian: 1,113 (12.3%)
American: 953 (10.5%)
Polish: 572 (6.3%)
Irish: 467 (5.2%)
Jamaican: 267 (2.9%)
German: 240 (2.6%)
Eastern European: 237 (2.6%)
Haitian: 206 (2.3%)
European: 174 (1.9%)
Trinidadian and Tobagonian: 96 (1.1%)
Guyanese: 77 (0.8%)
Greek: 70 (0.8%)
Lithuanian: 65 (0.7%)
Hungarian: 61 (0.7%)
Moroccan: 46 (0.5%)
West Indian: 44 (0.5%)
Jordanian: 42 (0.5%)
Egyptian: 35 (0.4%)
Israeli: 34 (0.4%)
Iranian: 31 (0.3%)
Romanian: 29 (0.3%)
Senegalese: 28 (0.3%)
Turkish: 25 (0.3%)
English: 24 (0.3%)
Norwegian: 19 (0.2%)
Iraqi: 18 (0.2%)
Ukrainian: 18 (0.2%)
Arab: 17 (0.2%)
Russian: 16 (0.2%)
Albanian: 15 (0.2%)
Austrian: 12 (0.1%)
Palestinian: 11 (0.1%)
Cypriot: 10 (0.1%)
South African: 9 (0.10%)
Canadian: 7 (0.08%)
Czechoslovakian: 5 (0.06%)
Slavic: 5 (0.06%)
Slovak: 5 (0.06%)
Barbadian: 3 (0.03%)
Scotch-Irish: 2 (0.02%) Most common places of birth for foreign-born residents (%): Colombia West Hempstead:
8.4% (316)New York:
2.5% (111,920)
El Salvador West Hempstead:
8.2% (309)New York:
2.4% (108,067)
Dominican Republic West Hempstead:
7.3% (275)New York:
11.1% (501,040)
Jamaica West Hempstead:
7.2% (271)New York:
5.0% (227,557)
India West Hempstead:
7.1% (266)New York:
3.5% (158,432)
Philippines West Hempstead:
6.2% (235)New York:
2.0% (91,070)
Haiti West Hempstead:
5.6% (211)New York:
2.8% (126,936)
Honduras West Hempstead:
5.3% (200)New York:
1.2% (55,571)
Israel West Hempstead:
4.7% (177)New York:
0.7% (29,743)
Italy West Hempstead:
4.0% (149)New York:
1.8% (81,374)
Guyana West Hempstead:
3.9% (148)New York:
3.8% (172,129)
Trinidad and Tobago West Hempstead:
2.4% (90)New York:
2.0% (91,428)
Canada West Hempstead:
2.0% (76)New York:
1.3% (59,107)
Guatemala West Hempstead:
2.0% (74)New York:
1.4% (61,245)
Ecuador West Hempstead:
1.8% (69)New York:
3.9% (177,448)
Ukraine West Hempstead:
1.8% (66)New York:
1.7% (78,421)
Egypt West Hempstead:
1.6% (62)New York:
0.6% (27,385)
Peru West Hempstead:
1.6% (62)New York:
1.2% (54,759)
Poland West Hempstead:
1.6% (61)New York:
1.4% (65,102)
Morocco West Hempstead:
1.6% (61)New York:
0.2% (10,005)
Place of birth for U.S.-born residents:
This state: 15,152Other state: 851Northeast: 328Midwest: 232South: 223West: 72 90.6% of West Hempstead residents lived in the same house 1 years ago.
Out of people who lived in different houses, 29.1% lived in this county.
Out of people who lived in different counties, 92.7% lived in New York.
West Hempstead:
90.6%State average:
89.6%
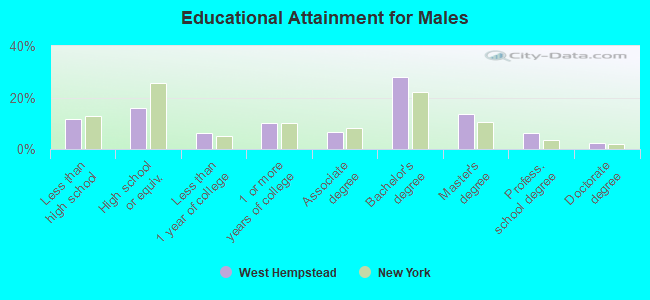
Education attainment for males 25 years and older:
No schooling: 275Nursery to 4th grade: 245th and 6th grade: 587th and 8th grade: 419th grade: 3910th grade: 2011th grade: 12512th grade, no diploma: 181High school graduate (or equivalency): 1,049Less than 1 year of college: 404Some college more than 1 year, no degree: 674Associate degree: 431Bachelor's degree: 1,848Master's degree: 907Professional school degree: 401Doctorate degree: 157
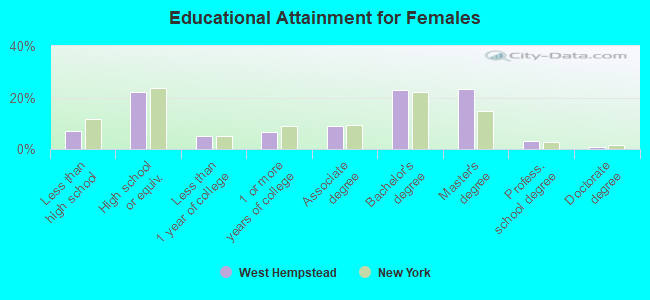
Education attainment for females 25 years and older:
No schooling: 259Nursery to 4th grade: 115th and 6th grade: 237th and 8th grade: 159th grade: 7910th grade: 611th grade: 1412th grade, no diploma: 74High school graduate (or equivalency): 1,536Less than 1 year of college: 337Some college more than 1 year, no degree: 464Associate degree: 618Bachelor's degree: 1,581Master's degree: 1,602Professional school degree: 201Doctorate degree: 65
Housing units in structures:
One, detached: 5,633One, attached: 18Two: 1983 or 4: 365 to 9: 11510 to 19: 5620 to 49: 4950 or more: 89Mobile homes: 10House/condo owner moved in on average 18 years ago
Renter moved in on average 3 years ago
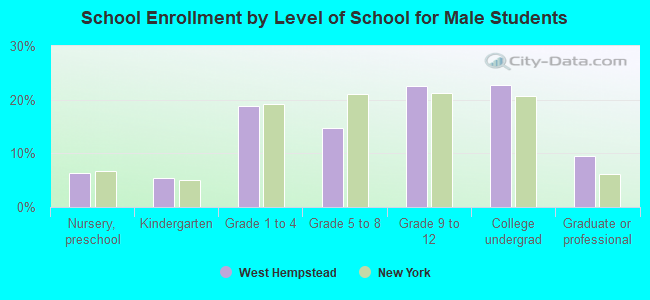
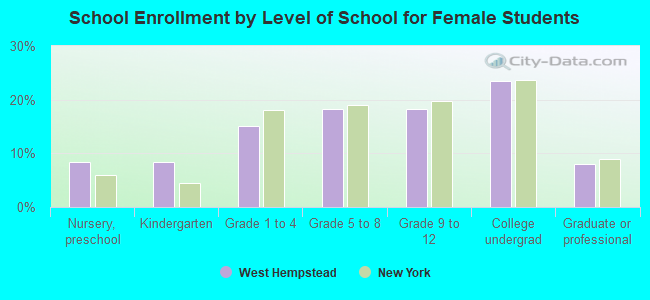
Private vs. public school enrollment:
Students in private schools in grades 1 to 8 (elementary and middle school): 770 Students in private schools in grades 9 to 12 (high school): 490 Students in private undergraduate colleges: 609