Housing density: 1,600 houses/condos per square mile
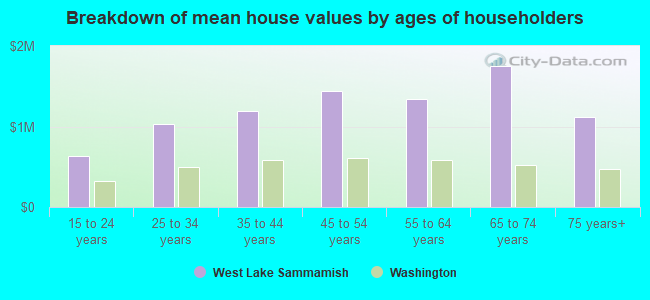
Median price asked for vacant for-sale houses and condos in 2022 in this county: $843,880.
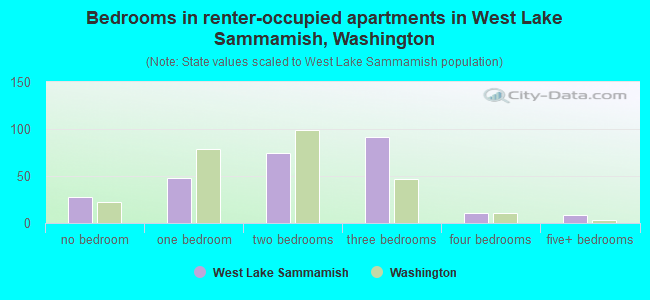
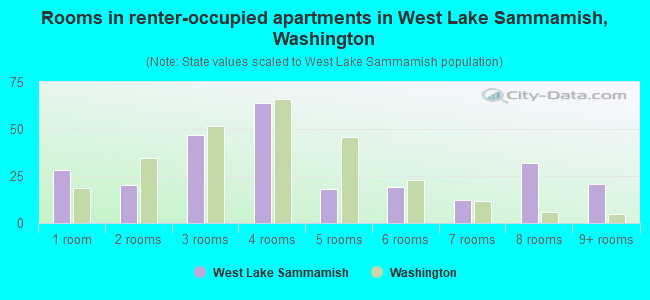
Median contract rent in 2022: over $2,000 (lower quartile is $1,585, upper quartile is over $2,000)
Median rent asked for vacant for-rent units in 2022: $3,532
Median gross rent in West Lake Sammamish, WA in 2022: over $2,000
Housing units in West Lake Sammamish with a mortgage: 1,431 (204 second mortgage, 129 home equity loan, 0 both second mortgage and home equity loan) Houses without a mortgage: 248
Compare current foreclosures near West Lake Sammamish, WA:
In family households: 1,455,162 (324,509 male householders, 137,001 female householders)
357,491 spouses, 491,900 children (462,739 natural, 12,743 adopted, 16,418 stepchildren), 22,208 grandchildren, 21,116 brothers or sisters, 17,956 parents, foster children, 25,527 other relatives, 45,636 non-relatives
In nonfamily households: 438,956 (162,683 male householders (115,616 living alone)), 165,039 female householders (129,083 living alone)), 111,234 nonrelatives
In group quarters: 37,131 (10,490 institutionalized population)
277,933 married couples with children.
81,653 single-parent households (19,170 men, 62,483 women).
85.9% of residents of West Lake Sammamish speak English at home.
2.0% of residents speak Spanish at home (73% speak English very well, 27% speak English well).
5.3% of residents speak other Indo-European language at home (67% speak English very well, 21% speak English well, 12% speak English not well).
6.2% of residents speak Asian or Pacific Island language at home (52% speak English very well, 37% speak English well, 10% speak English not well, 2% don't speak English at all).
0.6% of residents speak other language at home (16% speak English very well, 84% speak English well).
Foreign born population: 1,827 (23.4%)
(54.2% of them are naturalized citizens)
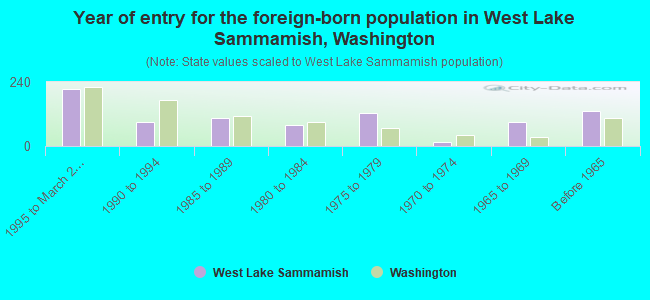
Year of entry for the foreign-born population in West Lake Sammamish, Washington
2121995 to March 2000
911990 to 1994
1051985 to 1989
781980 to 1984
1241975 to 1979
151970 to 1974
901965 to 1969
130Before 1965
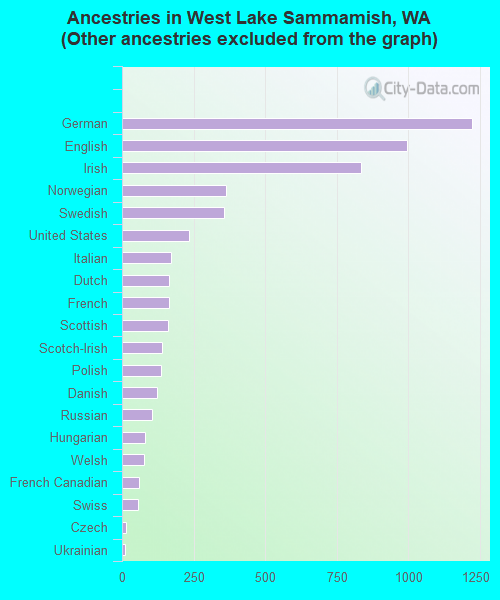
First ancestries reported:
Other: 1,577 (22.4%)
German: 1,220 (17.3%)
English: 996 (14.1%)
Irish: 834 (11.8%)
Norwegian: 364 (5.2%)
Swedish: 355 (5.0%)
United States: 235 (3.3%)
Italian: 171 (2.4%)
Dutch: 164 (2.3%)
French: 163 (2.3%)
Scottish: 160 (2.3%)
Scotch-Irish: 138 (2.0%)
Polish: 135 (1.9%)
Danish: 123 (1.7%)
Russian: 104 (1.5%)
Hungarian: 79 (1.1%)
Welsh: 78 (1.1%)
French Canadian: 59 (0.8%)
Swiss: 56 (0.8%)
Czech: 13 (0.2%)
Ukrainian: 12 (0.2%)
Subsaharan African: 9 (0.1%)
Most common places of birth for foreign-born residents (%):
Canada
West Lake Sammamish:
22.5% (190)
Washington:
7.7% (47,568)
India
West Lake Sammamish:
8.8% (74)
Washington:
2.4% (14,714)
Philippines
West Lake Sammamish:
7.9% (67)
Washington:
7.6% (46,733)
Korea
West Lake Sammamish:
5.9% (50)
Washington:
6.2% (38,172)
Iran
West Lake Sammamish:
4.4% (37)
Washington:
0.7% (4,573)
Other Eastern Africa
West Lake Sammamish:
4.3% (36)
Washington:
1.0% (6,438)
Taiwan
West Lake Sammamish:
4.1% (35)
Washington:
1.4% (8,353)
Japan
West Lake Sammamish:
4.1% (35)
Washington:
2.8% (16,936)
Hong Kong
West Lake Sammamish:
3.7% (31)
Washington:
1.0% (6,263)
Thailand
West Lake Sammamish:
3.7% (31)
Washington:
1.0% (6,294)
Polynesia
West Lake Sammamish:
3.1% (26)
Washington:
0.3% (1,748)
United Kingdom
West Lake Sammamish:
3.0% (25)
Washington:
3.3% (20,321)
Brazil
West Lake Sammamish:
2.6% (22)
Washington:
0.3% (1,763)
China, excluding Hong Kong and Taiwan
West Lake Sammamish:
2.5% (21)
Washington:
3.3% (20,530)
Israel
West Lake Sammamish:
2.5% (21)
Washington:
0.1% (869)
Pakistan
West Lake Sammamish:
2.2% (19)
Washington:
0.3% (1,975)
Netherlands
West Lake Sammamish:
2.0% (17)
Washington:
0.6% (3,795)
Ireland
West Lake Sammamish:
1.9% (16)
Washington:
0.4% (2,328)
Place of birth for U.S.-born residents:
This state: 2,655
Other state: 2,449
Northeast: 242
Midwest: 657
South: 326
West: 1,224
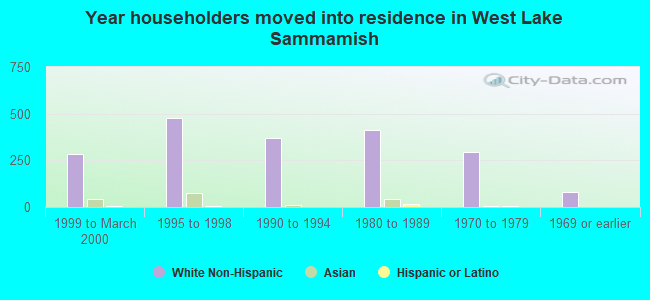
59% of West Lake Sammamish residents lived in the same house 5 years ago. Out of people who lived in different houses, 73% lived in this county. Out of people who lived in different counties, 30% lived in Washington.
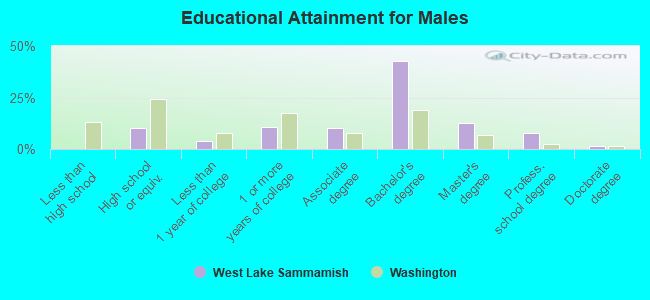
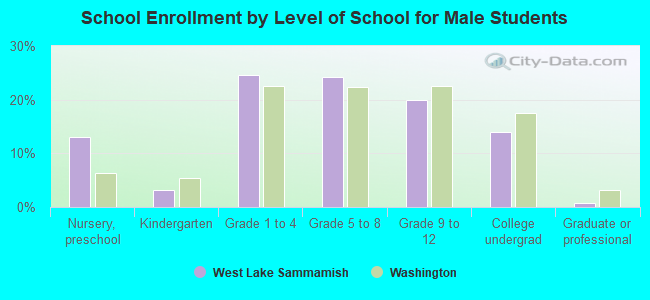
Education attainment for males 25 years and older:
No schooling: 0
Nursery to 4th grade: 0
5th and 6th grade: 0
7th and 8th grade: 0
9th grade: 0
10th grade: 0
11th grade: 0
12th grade, no diploma: 0
High school graduate (or equivalency): 198
Less than 1 year of college: 74
Some college more than 1 year, no degree: 204
Associate degree: 201
Bachelor's degree: 830
Master's degree: 248
Professional school degree: 149
Doctorate degree: 30
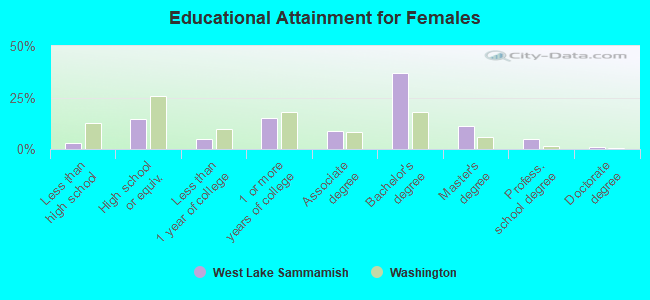
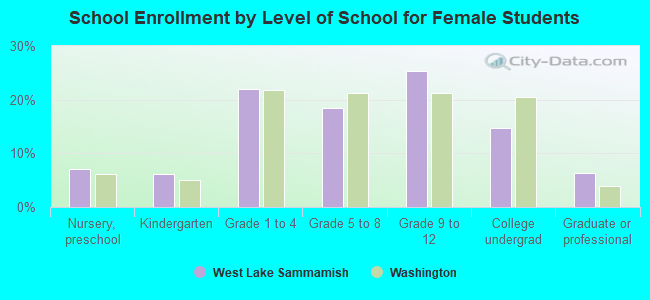
Education attainment for females 25 years and older:
No schooling: 10
Nursery to 4th grade: 0
5th and 6th grade: 7
7th and 8th grade: 18
9th grade: 0
10th grade: 7
11th grade: 0
12th grade, no diploma: 17
High school graduate (or equivalency): 315
Less than 1 year of college: 108
Some college more than 1 year, no degree: 325
Associate degree: 196
Bachelor's degree: 805
Master's degree: 246
Professional school degree: 106
Doctorate degree: 25
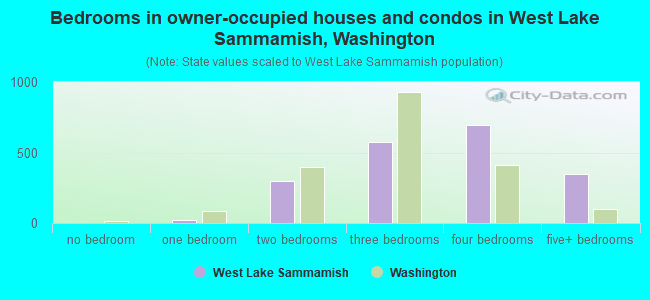
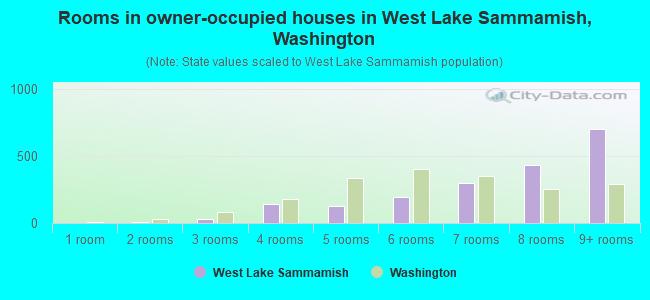
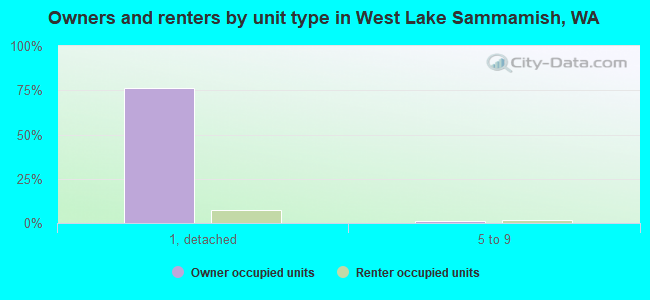
Housing units in structures:
One, detached: 1,883
One, attached: 56
Two: 18
3 or 4: 17
5 to 9: 65
10 to 19: 89
20 to 49: 93
50 or more: 39
Housing units lacking complete kitchen facilities: 1.0%