Jump to a detailed profile or search site with Google Custom Search

West Newbury, MA (Massachusetts) Houses and Residents

Estimated median house or condo value in 2022: $879,064 (it was $313,000 in 2000)
West Newbury:

$879,064
Massachusetts:

$534,700
Lower value quartile - upper value quartile: $612,065 - $1,005,733

Total population: 4,235 (Urban population: 1,891, Rural population: 2,258 (63 farm, 2,195 nonfarm))

Houses: 1,423 (1,392 occupied: 1,294 owner occupied, 98 renter occupied)

% of renters here:

7%
State:

38%

Housing density: 105 houses/condos per square mile

Median price asked for vacant for-sale houses and condos in 2022 in this county: $495,592.

Median contract rent in 2022: $1,824 (lower quartile is $1,457, upper quartile is over $2,000)


Median rent asked for vacant for-rent units in 2022: $1,510


Median gross rent in West Newbury, MA in 2022: over $2,000

Housing units in West Newbury with a mortgage: 851 (78 second mortgage, 70 home equity loan, 6 both second mortgage and home equity loan)
Houses without a mortgage: 311

Compare current foreclosures near West Newbury, MA:

Check out more offers near West Newbury, MA.
Powered by Foreclosure.com


West Newbury, Massachusetts Age and Sex of Residents

Household type by relationship:

Households: 726,687
  • In family households: 606,990 (122,043 male householders, 65,962 female householders)
    136,841 spouses, 221,565 children (210,337 natural, 5,012 adopted, 6,216 stepchildren), 11,988 grandchildren, 7,913 brothers or sisters, 8,558 parents, foster children, 9,566 other relatives, 17,265 non-relatives
  • In nonfamily households: 119,697 (41,801 male householders (32,274 living alone)), 56,150 female householders (48,012 living alone)), 21,746 nonrelatives
  • In group quarters: 16,472 (6,766 institutionalized population)

125,244 married couples with children.
42,832 single-parent households (7,363 men, 35,469 women).

96.0% of residents of West Newbury speak English at home.
0.7% of residents speak Spanish at home (56% speak English very well, 26% speak English well, 19% speak English not well).
2.5% of residents speak other Indo-European language at home (63% speak English very well, 37% speak English not well).
0.2% of residents speak Asian or Pacific Island language at home (100% speak English very well).
0.7% of residents speak other language at home (100% speak English very well).

Foreign born population: 227 (4.9%)
(93.4% of them are naturalized citizens)

Median number of rooms in houses and condos:
Here:

7.7
State:

6.5

Median number of rooms in apartments
Here:

4.1
State:

4.0

Owner-occupied Renter-occupied
Bedrooms in owner-occupied houses and condos in West Newbury, Massachusetts
  • Bedrooms in owner-occupied houses and condos in West Newbury, Massachusetts
  • 0no bedroom
  • 231 bedroom
  • 1542 bedrooms
  • 6113 bedrooms
  • 4574 bedrooms
  • 495+ bedrooms
Bedrooms in renter-occupied apartments in West Newbury, Massachusetts
  • Bedrooms in renter-occupied apartments in West Newbury, Massachusetts
  • 0no bedroom
  • 401 bedroom
  • 152 bedrooms
  • 283 bedrooms
  • 114 bedrooms
  • 45+ bedrooms
Owner-occupied Renter-occupied
Cars and other vehicles available in West Newbury in owner-occupied houses/condos
  • Cars and other vehicles available in West Newbury in owner-occupied houses/condos
  • 27no vehicle
  • 2341 vehicle
  • 6832 vehicles
  • 2463 vehicles
  • 844 vehicles
  • 205+ vehicles
Cars and other vehicles available in West Newbury in renter-occupied apartments
  • Cars and other vehicles available in West Newbury in renter-occupied apartments
  • 5no vehicle
  • 331 vehicle
  • 342 vehicles
  • 143 vehicles
  • 124 vehicles
  • 05+ vehicles
Owner-occupied Renter-occupied
Rooms in owner-occupied houses in West Newbury, Massachusetts
  • Rooms in owner-occupied houses in West Newbury, Massachusetts
  • 01 room
  • 02 rooms
  • 133 rooms
  • 164 rooms
  • 1375 rooms
  • 1786 rooms
  • 2987 rooms
  • 3448 rooms
  • 3089+ rooms
Rooms in renter-occupied apartments in West Newbury, Massachusetts
  • Rooms in renter-occupied apartments in West Newbury, Massachusetts
  • 01 room
  • 92 rooms
  • 313 rooms
  • 54 rooms
  • 185 rooms
  • 226 rooms
  • 97 rooms
  • 48 rooms
  • 09+ rooms
Year house built
Breakdown of mean house values by ages of householders
Owners and renters by unit type in West Newbury, MA
  • West Newbury, MA household income distribution

  • Distribution of median household income in West Newbury, MA in 2022
  • 26,407Less than $10,000
  • 35,118$10,000 to $19,999
  • 36,204$20,000 to $29,999
  • 34,429$30,000 to $39,999
  • 28,604$40,000 to $49,999
  • 27,732$50,000 to $59,999
  • 44,681$60,000 to $74,999
  • 66,934$75,000 to $99,999
  • 53,415$100,000 to $124,999
  • 49,335$125,000 to $149,999
  • 62,116$150,000 to $199,999
  • 100,177$200,000 or more

Percentage of workers working in this county: 68.1%
Number of people working at home: 428 (16.3% of all workers)

Travel time to work (commute)

  • Less than 5 minutes: 91
  • 5 to 9 minutes: 107
  • 10 to 14 minutes: 185
  • 15 to 19 minutes: 303
  • 20 to 24 minutes: 175
  • 25 to 29 minutes: 188
  • 30 to 34 minutes: 212
  • 35 to 39 minutes: 89
  • 40 to 44 minutes: 127
  • 45 to 59 minutes: 227
  • 60 to 89 minutes: 311
  • 90 or more minutes: 39

Means of transportation to work:

  • Drove a car alone: 1,847 (85.6%)
  • Carpooled: 178 (8.3%)
  • Railroad: 7 (0.3%)
  • Walked: 22 (1.0%)
  • Worked at home: 103 (4.8%)
Class of Workers in 2000
Year of entry for the foreign-born population in West Newbury, Massachusetts
  • Year of entry for the foreign-born population in West Newbury, Massachusetts
  • 01995 to March 2000
  • 61990 to 1994
  • 01985 to 1989
  • 271980 to 1984
  • 181975 to 1979
  • 71970 to 1974
  • 61965 to 1969
  • 54Before 1965
Ancestries in West Newbury, MA

First ancestries reported:

  • Irish: 1,072 (20.9%)
  • English: 991 (19.3%)
  • Italian: 632 (12.3%)
  • Other: 361 (7.0%)
  • German: 296 (5.8%)
  • French: 286 (5.6%)
  • Scottish: 267 (5.2%)
  • United States: 236 (4.6%)
  • Polish: 176 (3.4%)
  • Swedish: 132 (2.6%)
  • French Canadian: 107 (2.1%)
  • Scotch-Irish: 104 (2.0%)
  • Greek: 100 (1.9%)
  • Lithuanian: 65 (1.3%)
  • Czech: 44 (0.9%)
  • Norwegian: 44 (0.9%)
  • Portuguese: 43 (0.8%)
  • Dutch: 39 (0.8%)
  • Russian: 36 (0.7%)
  • Arab: 31 (0.6%)
  • Slovak: 20 (0.4%)
  • Welsh: 16 (0.3%)
  • Danish: 12 (0.2%)
  • West Indian: 12 (0.2%)
  • Ukrainian: 7 (0.1%)
  • Hungarian: 6 (0.1%)
  • Swiss: 6 (0.1%)

Most common places of birth for foreign-born residents (%):

Canada
West Newbury:

35.6% (42)
Massachusetts:

5.2% (40,247)

United Kingdom
West Newbury:

11.9% (14)
Massachusetts:

3.3% (25,403)

Dominican Republic
West Newbury:

10.2% (12)
Massachusetts:

6.0% (46,744)

Colombia
West Newbury:

8.5% (10)
Massachusetts:

2.0% (15,286)

Lebanon
West Newbury:

5.9% (7)
Massachusetts:

0.9% (6,691)

Greece
West Newbury:

5.1% (6)
Massachusetts:

1.7% (12,975)

Russia
West Newbury:

5.1% (6)
Massachusetts:

2.3% (17,449)

Guatemala
West Newbury:

5.1% (6)
Massachusetts:

1.7% (12,868)

Iran
West Newbury:

4.2% (5)
Massachusetts:

0.6% (4,416)

Australia
West Newbury:

4.2% (5)
Massachusetts:

0.2% (1,855)

Brazil
West Newbury:

4.2% (5)
Massachusetts:

4.7% (36,669)

Place of birth for U.S.-born residents:

  • This state: 3,048
  • Other state: 947
  • Northeast: 612
  • Midwest: 152
  • South: 133
  • West: 50

72% of West Newbury residents lived in the same house 5 years ago.
   Out of people who lived in different houses, 60% lived in this county.
   Out of people who lived in different counties, 53% lived in Massachusetts.

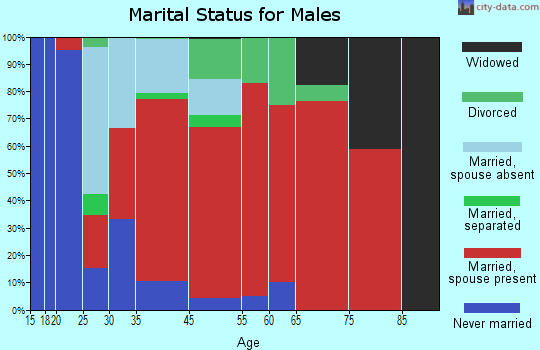
Education attainment for males 25 years and older:

  • No schooling: 0
  • Nursery to 4th grade: 0
  • 5th and 6th grade: 12
  • 7th and 8th grade: 0
  • 9th grade: 6
  • 10th grade: 0
  • 11th grade: 6
  • 12th grade, no diploma: 11
  • High school graduate (or equivalency): 229
  • Less than 1 year of college: 54
  • Some college more than 1 year, no degree: 148
  • Associate degree: 104
  • Bachelor's degree: 435
  • Master's degree: 254
  • Professional school degree: 58
  • Doctorate degree: 40
Educational Attainment for Males

Education attainment for females 25 years and older:

  • No schooling: 0
  • Nursery to 4th grade: 0
  • 5th and 6th grade: 4
  • 7th and 8th grade: 5
  • 9th grade: 0
  • 10th grade: 13
  • 11th grade: 20
  • 12th grade, no diploma: 17
  • High school graduate (or equivalency): 242
  • Less than 1 year of college: 42
  • Some college more than 1 year, no degree: 150
  • Associate degree: 129
  • Bachelor's degree: 503
  • Master's degree: 258
  • Professional school degree: 31
  • Doctorate degree: 16
Educational Attainment for Females
West Newbury marital status for males
West Newbury marital status for females

Housing units in structures:

  • One, detached: 1,323
  • One, attached: 43
  • Two: 28
  • 3 or 4: 13
  • 10 to 19: 10
  • Mobile homes: 6

Median worth of mobile homes: $435,225

Housing units lacking complete plumbing facilities: 0.9%

Housing units lacking complete kitchen facilities: 0.4%
Year householders moved into residence in West Newbury
Houses and condos Apartments
Most commonly used house heating fuel in houses and condos in West Newbury, MA
  • 88.9%Fuel oil, kerosene, etc.
  • 3.5%Electricity
  • 2.7%Bottled, tank, or LP gas
  • 2.6%Wood
  • 2.4%Utility gas
Most commonly used house heating fuel in apartments in West Newbury, MA
  • 73.5%Fuel oil, kerosene, etc.
  • 13.3%Bottled, tank, or LP gas
  • 5.1%Electricity
  • 4.1%Utility gas
  • 4.1%Wood

Private vs. public school enrollment:

Students in private schools in grades 1 to 8 (elementary and middle school): 22
Here:

3.6%
Massachusetts:

10.8%

Students in private schools in grades 9 to 12 (high school): 26
Here:

10.8%
Massachusetts:

12.2%

Students in private undergraduate colleges: 7
Here:

5.1%
Massachusetts:

48.2%
School Enrollment by Level of School for Male Students
School Enrollment by Level of School for Female Students
Age and Sex of Sensory-Disabled Noninstitutionalized Residents
Age and Sex of Physically-Disabled Noninstitutionalized Residents
Age and Sex of Mentally-Disabled Noninstitutionalized Residents
Age and Sex of Self-Care Disabled Noninstitutionalized Residents
Age and Sex of Go-Outside-Home Disabled Noninstitutionalized Residents
Age and Sex of Noninstitutionalized Residents with Employment Disability