West St. Paul, MN (Minnesota) Houses and Residents
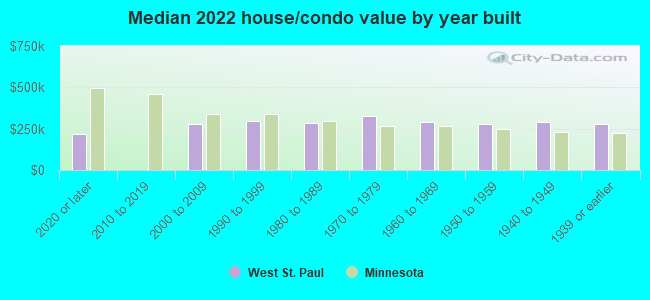
| West St. Paul: | $288,220 |
| Minnesota: | $314,600 |
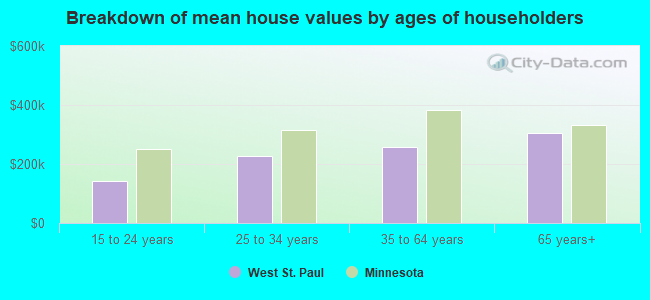
Mean price in 2022:
Detached houses: $324,910
Here: $324,910 State: $374,552 Townhouses or other attached units: $233,882
Here: $233,882 State: $312,049 In 2-unit structures: $526,612
Here: $526,612 State: $323,045 In 3-to-4-unit structures: $168,392
Here: $168,392 State: $238,971 In 5-or-more-unit structures: $204,403
Here: $204,403 State: $258,516
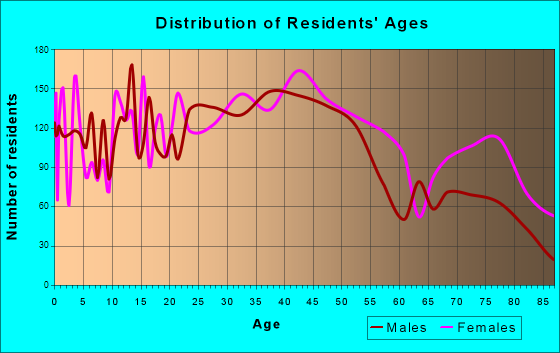
Total population: 19,806 (Urban population: 19,405, Rural population: 0)
Houses: 10,036 (9,578 occupied: 5,906 owner occupied, 3,710 renter occupied)
| % of renters here: | 39% |
| State: | 28% |
Housing density: 2,004 houses/condos per square mile
Median price asked for vacant for-sale houses and condos in 2022: $201,615.
Median contract rent in 2022: $1,146 (lower quartile is $908, upper quartile is $1,404)
Median rent asked for vacant for-rent units in 2022: $1,221
Median gross rent in West St. Paul, MN in 2022: $1,244
Housing units in West St. Paul with a mortgage: 4,141 (436 second mortgage, 0 home equity loan, 377 both second mortgage and home equity loan)
Houses without a mortgage: 94
Median household income for houses/condos with a mortgage: $99,218
Median household income for apartments without a mortgage: $72,083
Median monthly housing costs: $1,313
Compare current foreclosures near West St. Paul, MN:
| Photo | Address | Area | Beds / Baths | Price | Details |
|---|---|---|---|---|---|

|
#1
Groveland Ave Apt 1708
Minneapolis, MN 55403
|
739 sq. feet
|
1 baths 1 beds |
$93,100
|
show details |

|
#2
76th Street E. Unit
Inver Grove Heights, MN 55076
|
1,048 sq. feet
|
2 baths 2 beds |
$219,900
|
show details |

|
#3
York Ave S Apt 122
Minneapolis, MN 55435
|
956 sq. feet
|
1 baths 1 beds |
$157,000
|
show details |

|
#4
Charles Ave
Saint Paul, MN 55103
|
906 sq. feet
|
1 baths 2 beds |
$224,500
|
show details |

|
#5
Bedford Ave
Minneapolis, MN 55436
|
1,726 sq. feet
|
1 baths 3 beds |
$289,900
|
show details |

|
#6
Maple Island Rd
Burnsville, MN 55306
|
1,302 sq. feet
|
2 baths 2 beds |
$294,900
|
show details |

|
#7
26th Ave S
Minneapolis, MN 55406
|
1,232 sq. feet
|
1 baths 2 beds |
$309,900
|
show details |

|
#8
W 44th St Apt 7
Minneapolis, MN 55410
|
710 sq. feet
|
1 baths 2 beds |
$147,500
|
show details |

|
#9
Granite St
Saint Paul, MN 55117
|
2,136 sq. feet
|
2 baths 4 beds |
$172,000
|
show details |

|
#10
1st Ave S
Minneapolis, MN 55408
|
1,932 sq. feet
|
2 baths 3 beds |
$344,900
|
show details |
| Photo | Address | Area | Beds / Baths | Price | Details |
|---|---|---|---|---|---|

|
#11
Wacouta St Unit Unit Gl-D
Saint Paul, MN 55101
|
- sq. feet
|
1 baths 1 beds |
$179,900
|
show details |

|
#12
Elm Creek Ln
Lakeville, MN 55044
|
1,424 sq. feet
|
1 baths 2 beds |
show details | |

|
#13
Rice Creek Ter
Saint Paul, MN 55112
|
2,248 sq. feet
|
2 baths 4 beds |
show details | |

|
#14
Margaret St
Saint Paul, MN 55106
|
1,275 sq. feet
|
1 baths 3 beds |
show details | |

|
#15
Wheelock Ln Apt 303
Saint Paul, MN 55117
|
907 sq. feet
|
1 baths 2 beds |
show details | |

|
#16
Gladiola Ct
Saint Paul, MN 55124
|
1,680 sq. feet
|
2 baths 4 beds |
show details | |

|
#17
Wells St
Saint Paul, MN 55130
|
1,302 sq. feet
|
2 baths 4 beds |
show details | |

|
#18
Newton Ave N
Minneapolis, MN 55411
|
1,380 sq. feet
|
1 baths 3 beds |
show details | |

|
#19
18th Ave S
Minneapolis, MN 55407
|
3,066 sq. feet
|
2 baths 5 beds |
show details | |

|
#20
Hadley Ave N
Saint Paul, MN 55128
|
1,232 sq. feet
|
2 baths 4 beds |
show details |
| Photo | Address | Area | Beds / Baths | Price | Details |
|---|---|---|---|---|---|

|
#21
Bellaire Ave
Saint Paul, MN 55109
|
2,019 sq. feet
|
2 baths 4 beds |
show details | |

|
#22
Hadley Ave N
Saint Paul, MN 55128
|
1,232 sq. feet
|
2 baths 3 beds |
show details | |

|
#23
Esther Ln
Saint Paul, MN 55125
|
1,002 sq. feet
|
2 baths 3 beds |
show details | |

|
#24
Bedford St
Saint Paul, MN 55130
|
- sq. feet
|
1 baths 3 beds |
show details | |

|
#25
Case Ave E
Saint Paul, MN 55119
|
1,196 sq. feet
|
1 baths 2 beds |
show details | |

|
#26
Gerdine Path W
Rosemount, MN 55068
|
1,110 sq. feet
|
1 baths 3 beds |
show details | |

|
#27
Grand Way Apt 332
Minneapolis, MN 55416
|
1,028 sq. feet
|
2 baths 2 beds |
show details | |

|
#28
Marshall Ave
Saint Paul, MN 55104
|
1,102 sq. feet
|
1 baths 3 beds |
show details | |

|
#29
Edmund Ave
Saint Paul, MN 55104
|
2,132 sq. feet
|
2 baths 4 beds |
show details | |

|
#30
Hyde Ave S
Cottage Grove, MN 55016
|
998 sq. feet
|
2 baths 3 beds |
show details |
| Photo | Address | Area | Beds / Baths | Price | Details |
|---|---|---|---|---|---|

|
#31
Girard Ave N
Minneapolis, MN 55411
|
768 sq. feet
|
1 baths 2 beds |
show details | |

|
#32
Oakley Ave
Saint Paul, MN 55104
|
1,990 sq. feet
|
3 baths 4 beds |
show details | |

|
#33
Winchell St
Saint Paul, MN 55106
|
1,126 sq. feet
|
1 baths 3 beds |
show details | |

|
#34
Garfield Ave
Minneapolis, MN 55419
|
1,729 sq. feet
|
2 baths 3 beds |
show details | |

|
#35
Fremont Ave N Apt 311
Minneapolis, MN 55412
|
1,066 sq. feet
|
1 baths 1 beds |
show details | |

|
#36
Penn Ave N
Minneapolis, MN 55411
|
1,089 sq. feet
|
1 baths 3 beds |
show details | |

|
#37
Irving Ave N
Minneapolis, MN 55411
|
1,278 sq. feet
|
2 baths 4 beds |
show details | |

|
#38
Perry Ave N
Minneapolis, MN 55422
|
1,668 sq. feet
|
2 baths 3 beds |
show details | |

|
#39
Jupiter Rd NE
Minneapolis, MN 55432
|
1,263 sq. feet
|
2 baths 3 beds |
show details | |

|
#40
Lake St
Saint Paul, MN 55119
|
1,008 sq. feet
|
1 baths 3 beds |
show details |
| Photo | Address | Area | Beds / Baths | Price | Details |
|---|---|---|---|---|---|

|
#41
5th Street Ln N
Lake Elmo, MN 55042
|
1,784 sq. feet
|
3 baths 3 beds |
show details | |

|
#42
Orange Ave E
Saint Paul, MN 55119
|
1,039 sq. feet
|
1 baths 3 beds |
show details | |

|
#43
S 7th St Unit 322
Minneapolis, MN 55415
|
978 sq. feet
|
1 baths 2 beds |
show details | |

|
#44
Bloomington Ave
Minneapolis, MN 55407
|
1,820 sq. feet
|
2 baths 4 beds |
show details | |

|
#45
Rankin Rd
Minneapolis, MN 55418
|
1,012 sq. feet
|
1 baths 3 beds |
show details | |

|
#46
34th Pl N
Minneapolis, MN 55422
|
816 sq. feet
|
1 baths 2 beds |
show details | |

|
#47
34th Pl N
Minneapolis, MN 55422
|
816 sq. feet
|
1 baths 2 beds |
show details | |

|
#48
Laurel Ave
Saint Paul, MN 55104
|
2,932 sq. feet
|
2 baths 4 beds |
show details | |

|
#49
Burns Ave
Saint Paul, MN 55106
|
2,672 sq. feet
|
2 baths 5 beds |
show details | |

|
Check over 1 million property listings on Foreclosure.com!
|
browse all offers | |||


 | Ultra-Early Stages of House-hunting: City vs. 'Burbs (37 replies) |
| West St. Paul to Mendota Heights area.... for house purchase (13 replies) |
| Cottage Grove , MN 2022 (5 replies) |
| Is St. Paul a better place to live than Minneapolis now? (29 replies) |
| Minnesota's first in the nation Rental Bans (67 replies) |
| So many Suburbs - Too many choices (40 replies) |
Median year apartment built: 1978
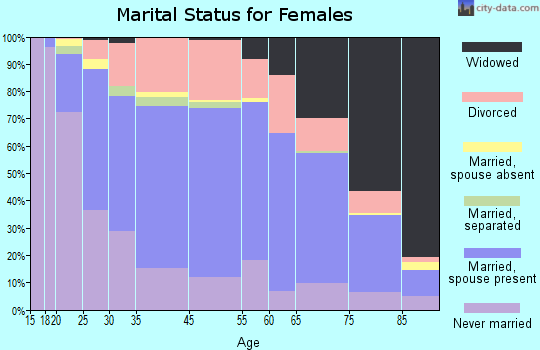
Household type by relationship:
Households: 21,017- Male householders: 4,135 (1,222 living alone), Female householders: 5,254 (2,505 living alone)
3,308 spouses (3,255 opposite-sex spouses), 617 unmarried partners, (561 opposite-sex unmarried partners), 5,230 children (4,942 natural, 128 adopted, 159 stepchildren), 521 grandchildren, 316 brothers or sisters, 214 parents, 7 foster children, 413 other relatives, 637 non-relatives
- In group quarters: 359
Size of family households: 2,201 2-persons, 1,223 3-persons, 1,079 4-persons, 237 5-persons, 118 6-persons, 149 7-or-more-persons.
Size of nonfamily households: 3,745 1-person, 777 2-persons, 90 3-persons, 21 4-persons.
2,792 married couples with children.
625 single-parent households (311 men, 314 women).
85.2% of residents of West St. Paul speak English at home.
12.5% of residents speak Spanish at home (44% speak English very well, 17% speak English well, 28% speak English not well, 10% don't speak English at all).
1.2% of residents speak other Indo-European language at home (100% speak English very well).
1.2% of residents speak Asian or Pacific Island language at home (63% speak English very well, 31% speak English well, 4% speak English not well, 2% don't speak English at all).
2.1% of residents speak other language at home (89% speak English very well, 2% speak English well, 9% speak English not well).
Foreign born population: 1,891 (9.0%)
(42.9% of them are naturalized citizens)
| Here: | 6.6 |
| State: | 7.1 |
| Here: | 3.4 |
| State: | 3.8 |
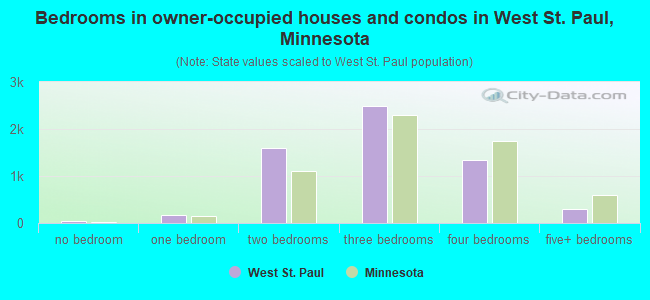
- Bedrooms in owner-occupied houses and condos in West St. Paul, Minnesota
- 33no bedroom
- 1601 bedroom
- 1,5972 bedrooms
- 2,4853 bedrooms
- 1,3324 bedrooms
- 2995+ bedrooms
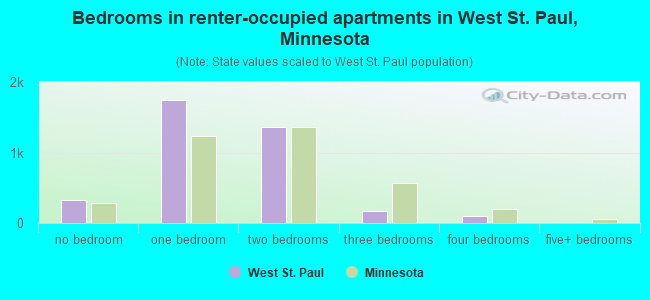
- Bedrooms in renter-occupied apartments in West St. Paul, Minnesota
- 322no bedroom
- 1,7461 bedroom
- 1,3632 bedrooms
- 1773 bedrooms
- 1034 bedrooms
- 05+ bedrooms
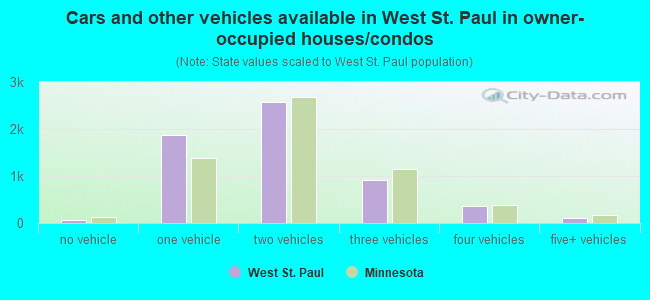
- Cars and other vehicles available in West St. Paul in owner-occupied houses/condos
- 73no vehicle
- 1,8691 vehicle
- 2,5662 vehicles
- 9183 vehicles
- 3694 vehicles
- 1115+ vehicles
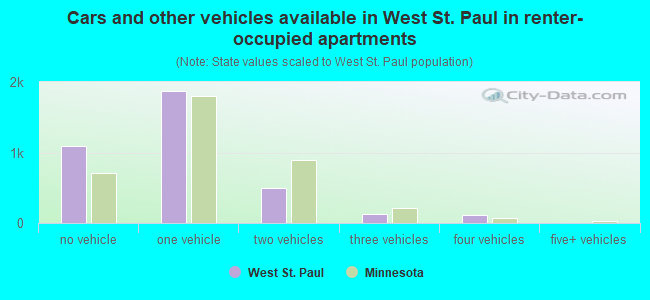
- Cars and other vehicles available in West St. Paul in renter-occupied apartments
- 1,087no vehicle
- 1,8711 vehicle
- 5022 vehicles
- 1303 vehicles
- 1204 vehicles
- 05+ vehicles
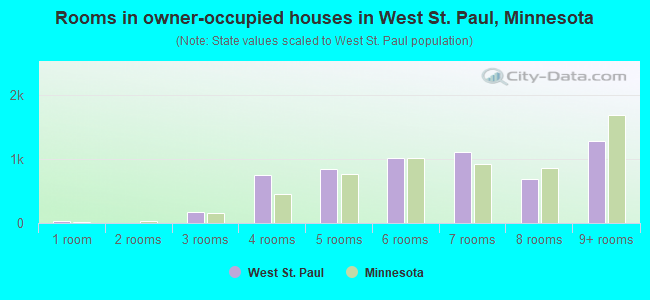
- Rooms in owner-occupied houses in West St. Paul, Minnesota
- 331 room
- 02 rooms
- 1723 rooms
- 7494 rooms
- 8415 rooms
- 1,0166 rooms
- 1,1217 rooms
- 6898 rooms
- 1,2879+ rooms
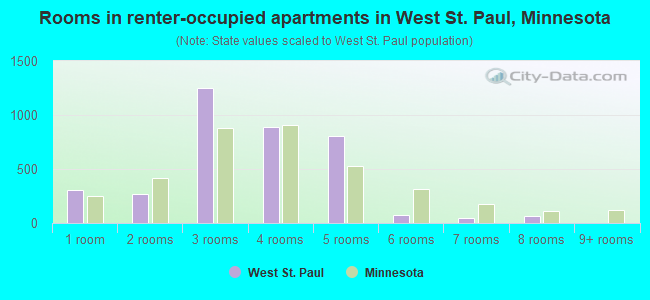
- Rooms in renter-occupied apartments in West St. Paul, Minnesota
- 3031 room
- 2722 rooms
- 1,2513 rooms
- 8894 rooms
- 8065 rooms
- 746 rooms
- 427 rooms
- 698 rooms
- 39+ rooms
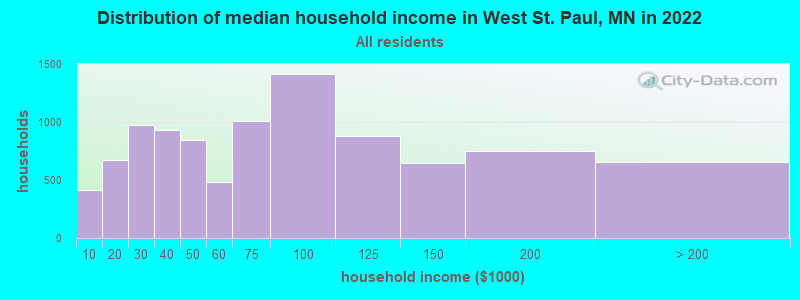
West St. Paul, MN household income distribution

- 416Less than $10,000
- 671$10,000 to $19,999
- 973$20,000 to $29,999
- 934$30,000 to $39,999
- 844$40,000 to $49,999
- 481$50,000 to $59,999
- 1,007$60,000 to $74,999
- 1,412$75,000 to $99,999
- 877$100,000 to $124,999
- 647$125,000 to $149,999
- 747$150,000 to $199,999
- 657$200,000 or more
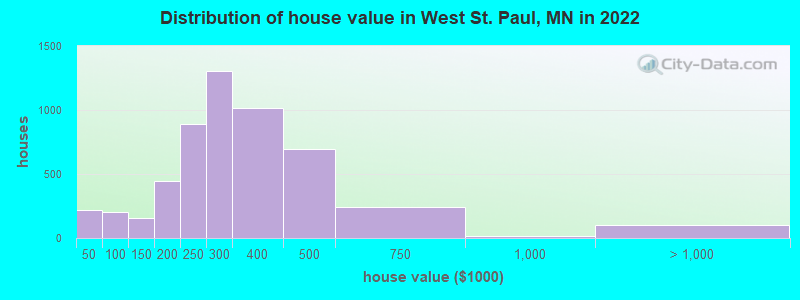
Home value of owner - occupied houses in 2022 in West St. Paul, MN
-
- 19Less than $10,000
- 8$15,000 to $19,999
- 94$20,000 to $24,999
- 60$30,000 to $34,999
- 13$35,000 to $39,999
- 19$40,000 to $49,999
- 34$50,000 to $59,999
- 10$70,000 to $79,999
- 107$80,000 to $89,999
- 32$90,000 to $99,999
- 107$100,000 to $124,999
- 45$125,000 to $149,999
- 221$150,000 to $174,999
- 221$175,000 to $199,999
- 893$200,000 to $249,999
- 1,302$250,000 to $299,999
- 1,011$300,000 to $399,999
- 694$400,000 to $499,999
- 244$500,000 to $749,999
- 19$750,000 to $999,999
- 83$1,000,000 to $1,499,999
- 17$1,500,000 to $1,999,999
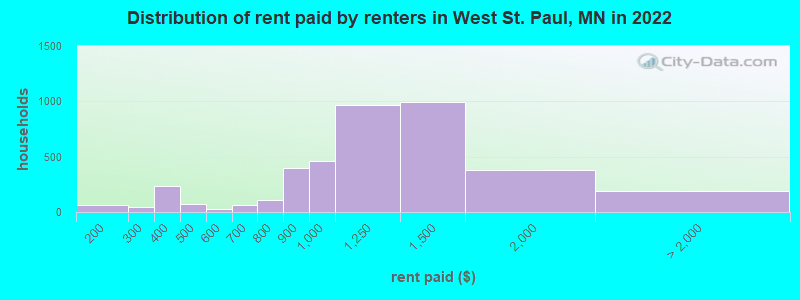
Rent paid by renters in 2022 in West St. Paul, MN
-
- 65$150 to $199
- 48$200 to $249
- 103$300 to $349
- 131$350 to $399
- 71$400 to $449
- 25$500 to $549
- 35$600 to $649
- 25$650 to $699
- 34$700 to $749
- 73$750 to $799
- 395$800 to $899
- 461$900 to $999
- 965$1,000 to $1,249
- 996$1,250 to $1,499
- 382$1,500 to $1,999
- 52$2,000 to $2,499
- 52$2,500 to $2,999
- 85No cash rent
Percentage of workers working in this county: 49.0%
Number of people working at home: 2,220 (20.5% of all workers)
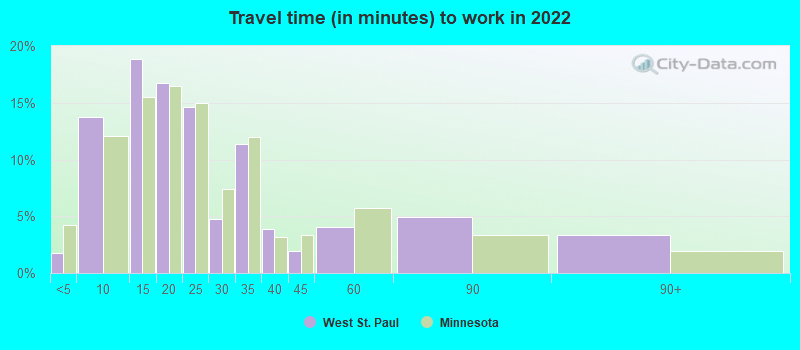
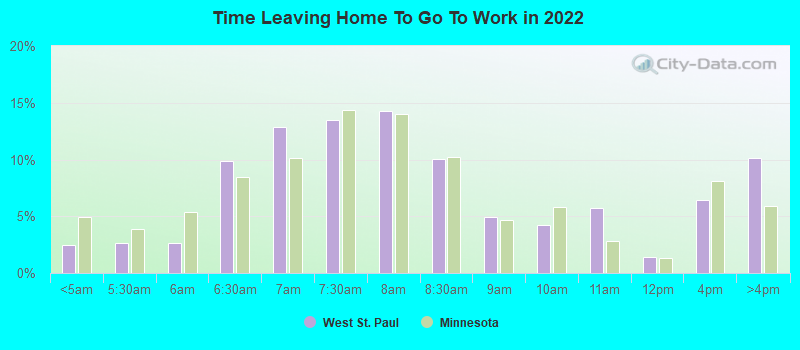
Travel time to work (commute)
- Less than 5 minutes: 267
- 5 to 9 minutes: 824
- 10 to 14 minutes: 1,005
- 15 to 19 minutes: 1,912
- 20 to 24 minutes: 1,398
- 25 to 29 minutes: 707
- 30 to 34 minutes: 1,328
- 35 to 39 minutes: 247
- 40 to 44 minutes: 302
- 45 to 59 minutes: 177
- 60 to 89 minutes: 290
- 90 or more minutes: 138
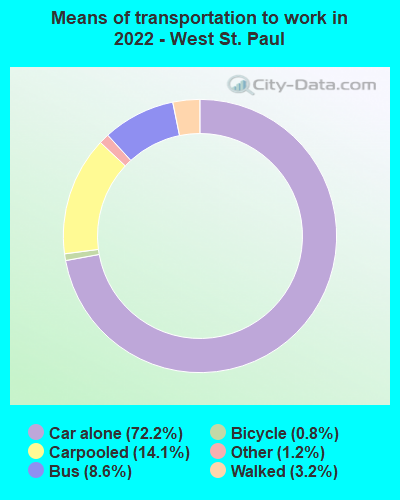
Means of transportation to work:
- Drove a car alone: 5,044 (53.7%)
- Carpooled: 1,142 (12.2%)
- Bus: 556 (5.9%)
- Taxi: 145 (1.5%)
- Bicycle: 45 (0.5%)
- Walked: 213 (2.3%)
- Worked at home: 2,220 (23.7%)
- Unemployment by race in 2022
- Unemployment rate for White non-Hispanic residents
- 5.6%Males
- 1.7%Females
- Unemployment rate for American Indian and Alaska Native residents
- 3.1%Males
- Unemployment rate for Asian residents
- 8.7%Females
- Unemployment rate for other race residents
- 18.3%Males
- Unemployment rate for two or more race residents
- 6.4%Males
- 1.8%Females
- Unemployment rate for Hispanic or Latino residents
- 18.5%Males
- 2.0%Females
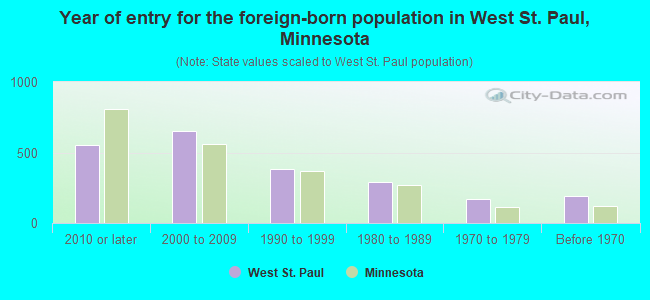
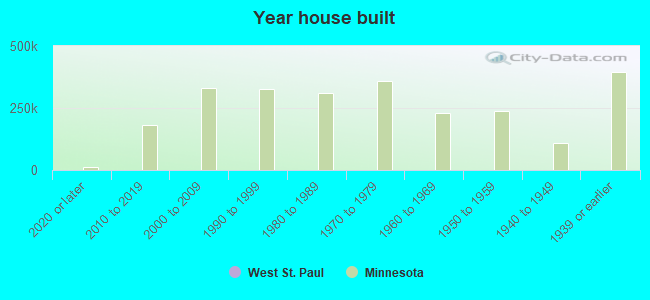
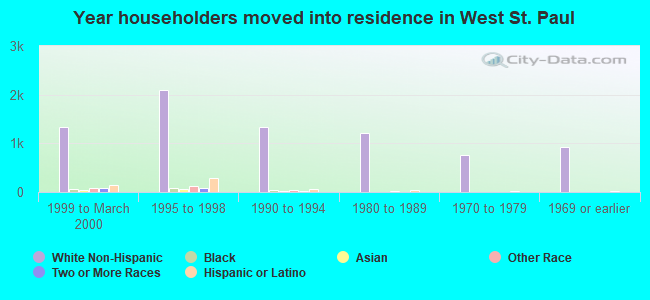
- Year of entry for the foreign-born population in West St. Paul, Minnesota
- 5502010 or later
- 6552000 to 2009
- 3831990 to 1999
- 2931980 to 1989
- 1691970 to 1979
- 189Before 1970
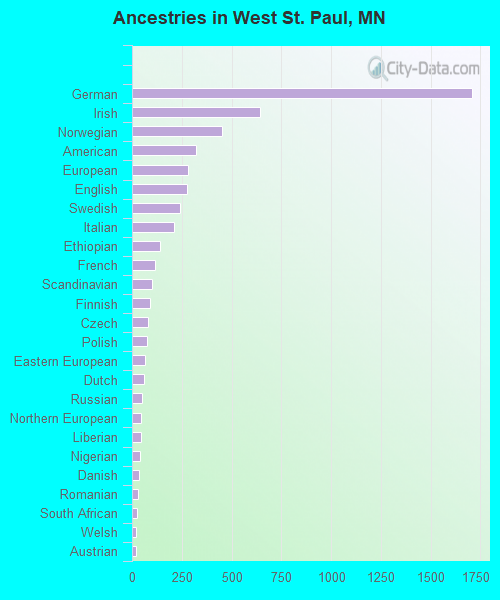
First ancestries reported:
- German: 1,708 (18.5%)
- Irish: 643 (7.0%)
- Norwegian: 450 (4.9%)
- American: 320 (3.5%)
- European: 283 (3.1%)
- English: 275 (3.0%)
- Swedish: 242 (2.6%)
- Italian: 209 (2.3%)
- Ethiopian: 140 (1.5%)
- French: 116 (1.3%)
- Scandinavian: 101 (1.1%)
- Finnish: 89 (1.0%)
- Czech: 79 (0.9%)
- Polish: 75 (0.8%)
- Eastern European: 64 (0.7%)
- Dutch: 58 (0.6%)
- Russian: 48 (0.5%)
- Northern European: 46 (0.5%)
- Liberian: 44 (0.5%)
- Nigerian: 41 (0.4%)
- Danish: 36 (0.4%)
- Romanian: 31 (0.3%)
- South African: 25 (0.3%)
- Welsh: 20 (0.2%)
- Austrian: 19 (0.2%)
- French Canadian: 19 (0.2%)
- African: 18 (0.2%)
- British: 16 (0.2%)
- Afghan: 12 (0.1%)
- Haitian: 12 (0.1%)
- Slavic: 10 (0.1%)
- Lithuanian: 8 (0.09%)
- Brazilian: 7 (0.08%)
- German Russian: 6 (0.07%)
- Luxembourger: 5 (0.05%)
- Hungarian: 5 (0.05%)
Most common places of birth for foreign-born residents (%):
| West St. Paul: | 35.4% (652) |
| Minnesota: | 12.1% (58,312) |
| West St. Paul: | 10.0% (185) |
| Minnesota: | 5.1% (24,630) |
| West St. Paul: | 6.1% (113) |
| Minnesota: | 0.8% (4,085) |
| West St. Paul: | 6.0% (110) |
| Minnesota: | 2.0% (9,850) |
| West St. Paul: | 5.7% (105) |
| Minnesota: | 0.5% (2,552) |
| West St. Paul: | 5.0% (92) |
| Minnesota: | 0.9% (4,264) |
| West St. Paul: | 3.1% (57) |
| Minnesota: | 1.3% (6,329) |
| West St. Paul: | 2.9% (53) |
| Minnesota: | 6.7% (32,141) |
| West St. Paul: | 2.4% (44) |
| Minnesota: | 0.2% (807) |
| West St. Paul: | 2.4% (44) |
| Minnesota: | 0.3% (1,621) |
| West St. Paul: | 2.2% (41) |
| Minnesota: | 1.4% (6,670) |
| West St. Paul: | 2.1% (38) |
| Minnesota: | 0.4% (1,963) |
| West St. Paul: | 1.8% (34) |
| Minnesota: | 0.8% (3,651) |
| West St. Paul: | 1.6% (30) |
| Minnesota: | 0.2% (967) |
Place of birth for U.S.-born residents:
- This state: 13,681
- Other state: 5,085
- Northeast: 414
- Midwest: 2,568
- South: 1,080
- West: 1,039
84.0% of West St. Paul residents lived in the same house 1 years ago.
Out of people who lived in different houses, 16.0% lived in this county.
Out of people who lived in different counties, 81.8% lived in Minnesota.
| West St. Paul: | 84.0% |
| State average: | 87.4% |
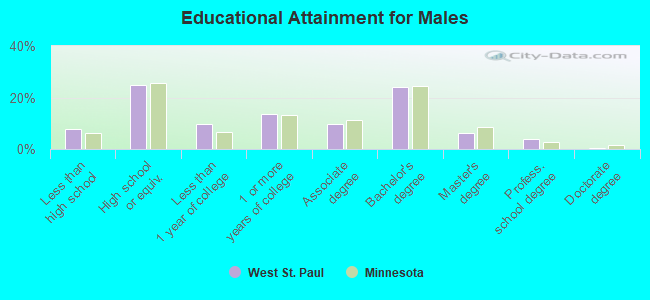
Education attainment for males 25 years and older:
- No schooling: 11
- Nursery to 4th grade: 48
- 5th and 6th grade: 99
- 7th and 8th grade: 77
- 9th grade: 123
- 10th grade: 22
- 11th grade: 65
- 12th grade, no diploma: 88
- High school graduate (or equivalency): 1,704
- Less than 1 year of college: 651
- Some college more than 1 year, no degree: 917
- Associate degree: 655
- Bachelor's degree: 1,654
- Master's degree: 431
- Professional school degree: 254
- Doctorate degree: 38
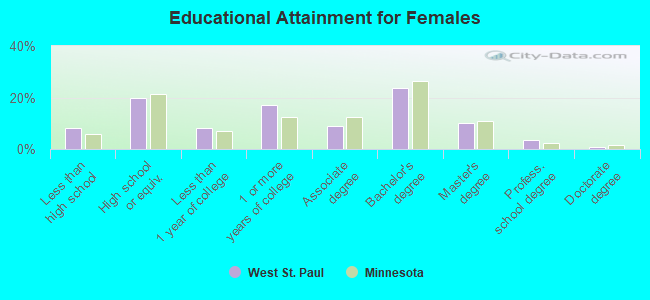
Education attainment for females 25 years and older:
- No schooling: 25
- Nursery to 4th grade: 3
- 5th and 6th grade: 8
- 7th and 8th grade: 52
- 9th grade: 34
- 10th grade: 127
- 11th grade: 370
- 12th grade, no diploma: 80
- High school graduate (or equivalency): 1,662
- Less than 1 year of college: 703
- Some college more than 1 year, no degree: 1,461
- Associate degree: 747
- Bachelor's degree: 2,008
- Master's degree: 843
- Professional school degree: 282
- Doctorate degree: 67
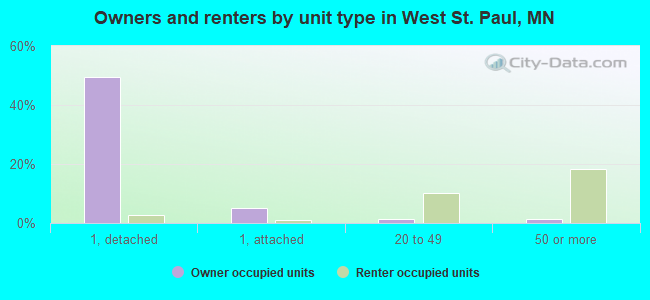
Housing units in structures:
- One, detached: 5,153
- One, attached: 603
- Two: 110
- 3 or 4: 248
- 5 to 9: 143
- 10 to 19: 816
- 20 to 49: 1,040
- 50 or more: 1,920
Housing units lacking complete kitchen facilities in 2022: 2.9%
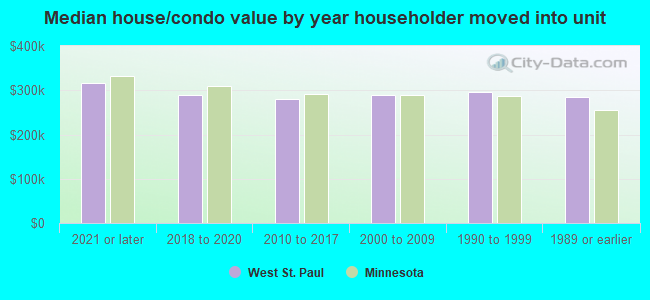
House/condo owner moved in on average 10 years ago
Renter moved in on average 4 years ago
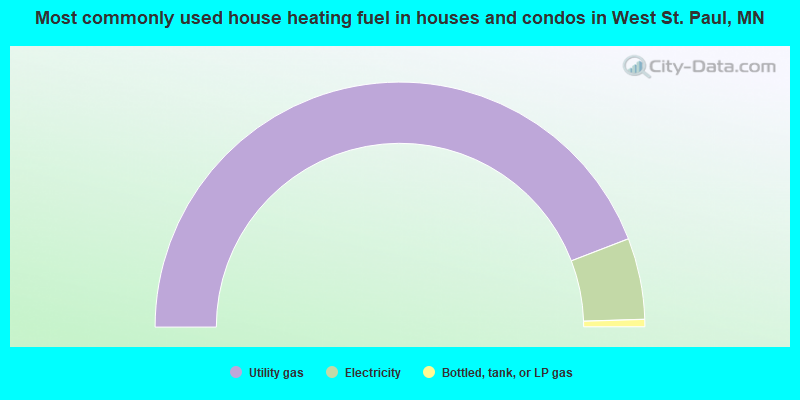
- 88.3%Utility gas
- 10.7%Electricity
- 1.0%Bottled, tank, or LP gas
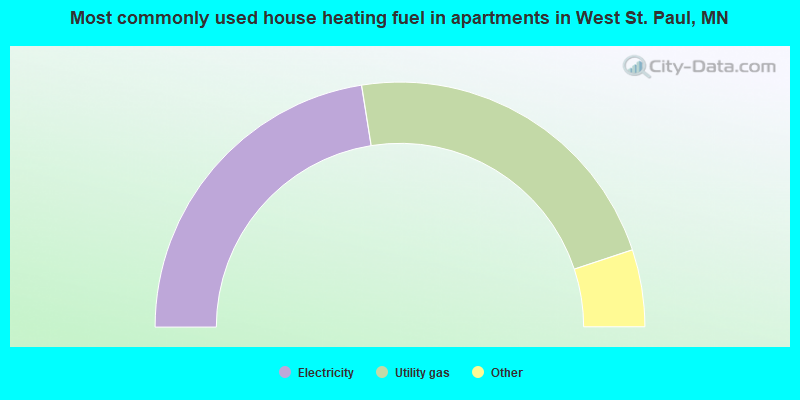
- 45.0%Electricity
- 44.8%Utility gas
- 3.8%No fuel used
- 3.2%Bottled, tank, or LP gas
- 3.1%Other fuel
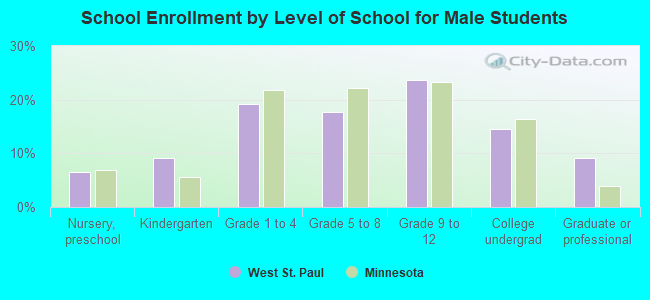
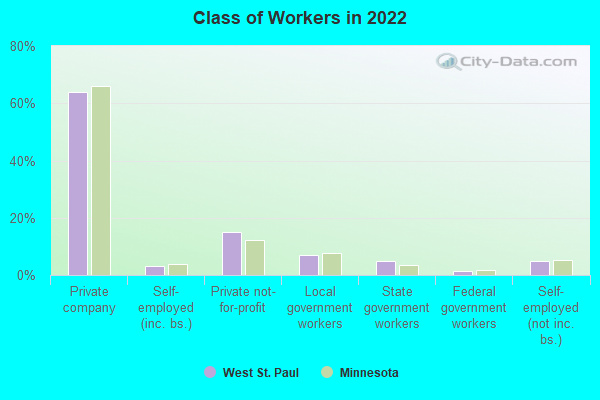
Private vs. public school enrollment:
| Here: | 14.9% |
| Minnesota: | 12.9% |
| Here: | 18.5% |
| Minnesota: | 8.6% |
| Here: | 18.5% |
| Minnesota: | 26.2% |