Westport, CT (Connecticut) Houses and Residents
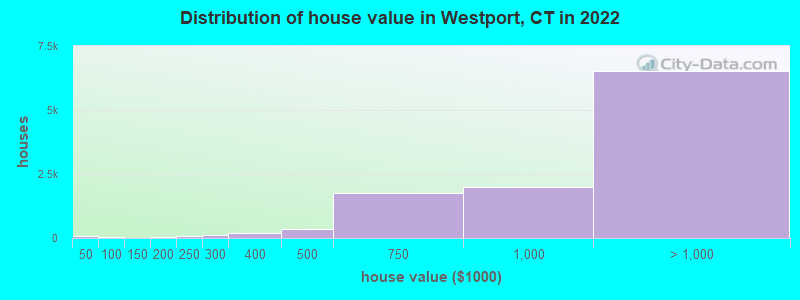
Estimated median house or condo value in 2022: $1,334,969 (it was $617,500 in 2000 )
Westport:
$1,334,969Connecticut:
$347,200
Lower value quartile - upper value quartile: $871,759 - $1,755,630Mean price in 2022: Detached houses: $1,913,826 Here:
$1,913,826State:
$503,946
Townhouses or other attached units: $1,377,334 Here:
$1,377,334State:
$304,959
In 2-unit structures: $1,014,903 Here:
$1,014,903State:
$304,133
In 3-to-4-unit structures: $748,062 Here:
$748,062State:
$272,970
In 5-or-more-unit structures: $450,482 Here:
$450,482State:
$249,308
Mobile homes: $287,003 Here:
$287,003State:
$151,361
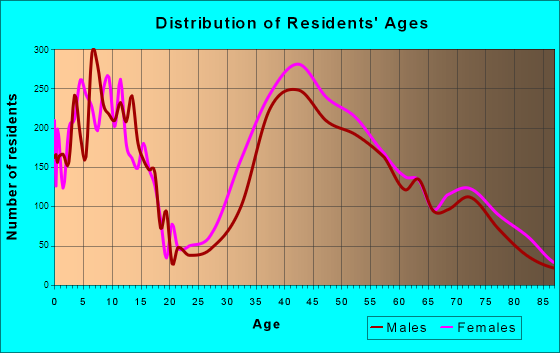
Total population: 26,391 (Urban population: 25,749, Rural population: 0)
Houses: 11,120 (10,087 occupied: 8,698 owner occupied, 1,511 renter occupied )
% of renters here:
15%State:
34%
Housing density: 556 houses/condos per square mile
Median price asked for vacant for-sale houses and condos in 2022: $1,666,819.
Median contract rent in 2022: over $2,000 (lower quartile is $1,458, upper quartile is over $2,000)
Median rent asked for vacant for-rent units in 2022: $4,430
Median gross rent in Westport, CT in 2022: over $2,000
Housing units in Westport with a mortgage: 5,509 (62 second mortgage, 1,242 home equity loan, 51 both second mortgage and home equity loan )Houses without a mortgage: 2,837
Median household income for houses/condos with a mortgage: $294,469
Median household income for apartments without a mortgage: $194,330
Median monthly housing costs: $3,689
Data:
Median house or condo value ($)
Median house or condo value ($ change since 2000)
Median house or condo value ($) - White
Median house or condo value ($) - Black or African American
Median house or condo value ($) - Asian
Median house or condo value ($) - Hispanic or Latino
Median house or condo value ($) - American Indian and Alaska Native
Median house or condo value ($) - Multirace
Median house or condo value ($) - Other Race
Median price asked for mobile homes ($)
Household density (households per square mile)
Mean house or condo value by units in structure - 1, detached ($)
Mean house or condo value by units in structure - 1, attached ($)
Mean house or condo value by units in structure - 2 ($)
Mean house or condo value by units in structure by units in structure - 3 or 4 ($)
Mean house or condo value by units in structure - 5 or more ($)
Mean house or condo value by units in structure - Boat, RV, van, etc. ($)
Mean house or condo value by units in structure - Mobile home ($)
Median contract rent ($)
Median contract rent - Lower quartile ($)
Median contract rent - Upper quartile ($)
Median gross rent ($)
Urban houses (%)
Rural houses (%)
Houses occupied (%)
Houses occupied (% change since 2000)
Houses owner occupied (%)
Houses owner occupied (% change since 2000)
Houses renter occupied (%)
Houses renter occupied (% change since 2000)
Vacant housing units - For rent (%)
Vacant housing units - For rent (% change since 2000)
Vacant housing units - For sale only (%)
Vacant housing units - For sale only (% change since 2000)
Vacant housing units - Rented or sold, not occupied (%)
Vacant housing units - Rented or sold, not occupied (% change since 2000)
Vacant housing units - For seasonal, recreational, or occasional use (%)
Vacant housing units - For seasonal, recreational, or occasional use (% change since 2000)
Vacant housing units - For migrant workers (%)
Vacant housing units - For migrant workers (% change since 2000)
Vacant housing units - Other vacant (%)
Vacant housing units - Other vacant (% change since 2000)
Median monthly housing costs ($)
Median household income for houses/condos with a mortgage ($)
Median household income for houses/condos without a mortgage ($)
Median household income ($)
Median household income ($) - White
Median household income ($) - Black or African American
Median household income ($) - Asian
Median household income ($) - Hispanic or Latino
Median household income ($) - American Indian and Alaska Native
Median household income ($) - Multirace
Median household income ($) - Other Race
Mortgage status - with mortgage (%)
Mortgage status - with second mortgage (%)
Mortgage status - with home equity loan (%)
Mortgage status - with both second mortgage and home equity loan (%)
Mortgage status - without a mortgage (%)
Median year house/condo built
Median year apartment built
Household type by relationship - Male householder living alone (%)
Household type by relationship - Male householder not living alone (%)
Household type by relationship - Female householder living alone (%)
Household type by relationship - Female householder not living alone (%)
Household type by relationship - Opposite-Sex spouse (%)
Household type by relationship - Same-Sex spouse (%)
Household type by relationship - Opposite-Sex unmarried partner (%)
Household type by relationship - Same-Sex unmarried partner (%)
Household type by relationship - In group quarters (%)
Size of family households - 2-person household (%)
Size of family households - 3-person household (%)
Size of family households - 4-person household (%)
Size of family households - 5-person household (%)
Size of family households - 6-person household (%)
Size of family households - 7-or-more-person household (%)
Size of nonfamily households - 1-person household (%)
Size of nonfamily households - 2-person household (%)
Size of nonfamily households - 3-person household (%)
Size of nonfamily households - 4-person household (%)
Size of nonfamily households - 5-person household (%)
Size of nonfamily households - 6-person household (%)
Size of nonfamily households - 7-or-moreperson household (%)
Year house built - Built 2010 or later (%)
Year house built - Built 2000 to 2009 (%)
Year house built - Built 1990 to 1999 (%)
Year house built - Built 1980 to 1989 (%)
Year house built - Built 1970 to 1979 (%)
Year house built - Built 1960 to 1969 (%)
Year house built - Built 1950 to 1959 (%)
Year house built - Built 1940 to 1949 (%)
Year house built - Built 1939 or earlier (%)
Median number of rooms in houses and condos
Median number of rooms in apartments
Median number of bedrooms in owner occupied houses
Mean number of bedrooms in owner occupied houses
Median number of bedrooms in renter occupied houses
Mean number of bedrooms in renter occupied houses
Median number of vehichles in owner occupied houses
Mean number of vehichles in owner occupied houses
Median number of vehichles in renter occupied houses
Mean number of vehichles in renter occupied houses
Rooms in owner-occupied houses - 1 room (%)
Rooms in owner-occupied houses - 2 rooms (%)
Rooms in owner-occupied houses - 3 rooms (%)
Rooms in owner-occupied houses - 4 rooms (%)
Rooms in owner-occupied houses - 5 rooms (%)
Rooms in owner-occupied houses - 6 rooms (%)
Rooms in owner-occupied houses - 7 rooms (%)
Rooms in owner-occupied houses - 8 rooms (%)
Rooms in owner-occupied houses - 9+ rooms (%)
Rooms in renter-occupied houses - 1 room (%)
Rooms in renter-occupied houses - 2 rooms (%)
Rooms in renter-occupied houses - 3 rooms (%)
Rooms in renter-occupied houses - 4 rooms (%)
Rooms in renter-occupied houses - 5 rooms (%)
Rooms in renter-occupied houses - 6 rooms (%)
Rooms in renter-occupied houses - 7 rooms (%)
Rooms in renter-occupied houses - 8 rooms (%)
Rooms in renter-occupied houses - 9+ rooms (%)
Bedrooms in owner-occupied houses - no bedrooms (%)
Bedrooms in owner-occupied houses - 1 bedroom (%)
Bedrooms in owner-occupied houses - 2 bedrooms (%)
Bedrooms in owner-occupied houses - 3 bedrooms (%)
Bedrooms in owner-occupied houses - 4 bedrooms (%)
Bedrooms in owner-occupied houses - 5+ bedrooms (%)
Bedrooms in renter-occupied houses - no bedrooms (%)
Bedrooms in renter-occupied houses - 1 bedroom (%)
Bedrooms in renter-occupied houses - 2 bedrooms (%)
Bedrooms in renter-occupied houses - 3 bedrooms (%)
Bedrooms in renter-occupied houses - 4 bedrooms (%)
Bedrooms in renter-occupied houses - 5+ bedrooms (%)
Vehicles available in owner-occupied houses - no vehicle available (%)
Vehicles available in owner-occupied houses - 1 vehicle available(%)
Vehicles available in owner-occupied houses - 2 Vehicles available (%)
Vehicles available in owner-occupied houses - 3 Vehicles available (%)
Vehicles available in owner-occupied houses - 4 Vehicles available (%)
Vehicles available in owner-occupied houses - 5+ Vehicles available (%)
Vehicles available in renter-occupied houses - no vehicle available (%)
Vehicles available in renter-occupied houses - 1 vehicle available (%)
Vehicles available in renter-occupied houses - 2 Vehicles available (%)
Vehicles available in renter-occupied houses - 3 Vehicles available (%)
Vehicles available in renter-occupied houses - 4 Vehicles available (%)
Vehicles available in renter-occupied houses - 5+ Vehicles available (%)
Housing units in structures - 1, detached (%)
Housing units in structures - 1, attached (%)
Housing units in structures - 2 (%)
Housing units in structures - 3 or 4 (%)
Housing units in structures - 5 to 9 (%)
Housing units in structures - 10 to 19 (%)
Housing units in structures - 20 to 49 (%)
Housing units in structures - 50 or more (%)
Housing units in structures - Mobile home (%)
Housing units in structures - Boat, RV, van, etc. (%)
Housing units in structures - Owners - 1, detached (%)
Housing units in structures - Owners - 1, attached (%)
Housing units in structures - Owners - 2 (%)
Housing units in structures - Owners - 3 or 4 (%)
Housing units in structures - Owners - 5 to 9 (%)
Housing units in structures - Owners - 10 to 19 (%)
Housing units in structures - Owners - 20 to 49 (%)
Housing units in structures - Owners - 50 or more (%)
Housing units in structures - Owners - Mobile home (%)
Housing units in structures - Owners - Boat, RV, van, etc. (%)
Housing units in structures - Renters - 1, detached (%)
Housing units in structures - Renters - 1, attached (%)
Housing units in structures - Renters - 2 (%)
Housing units in structures - Renters - 3 or 4 (%)
Housing units in structures - Renters - 5 to 9 (%)
Housing units in structures - Renters - 10 to 19 (%)
Housing units in structures - Renters - 20 to 49 (%)
Housing units in structures - Renters - 50 or more (%)
Housing units in structures - Renters - Mobile home (%)
Housing units in structures - Renters - Boat, RV, van, etc. (%)
House/condo owner moved in on average (years ago)
Renter moved in on average (years ago)
Year householder moved into unit - Moved in 1999 to March 2000 (%)
Year householder moved into unit - Moved in 1999 to March 2000 (%) - White
Year householder moved into unit - Moved in 1999 to March 2000 (%) - Black or African American
Year householder moved into unit - Moved in 1999 to March 2000 (%) - Asian
Year householder moved into unit - Moved in 1999 to March 2000 (%) - Hispanic or Latino
Year householder moved into unit - Moved in 1999 to March 2000 (%) - American Indian and Alaska Native
Year householder moved into unit - Moved in 1999 to March 2000 (%) - Multirace
Year householder moved into unit - Moved in 1999 to March 2000 (%) - Other Race
Year householder moved into unit - Moved in 1995 to 1998 (%)
Year householder moved into unit - Moved in 1995 to 1998 (%) - White
Year householder moved into unit - Moved in 1995 to 1998 (%) - Black or African American
Year householder moved into unit - Moved in 1995 to 1998 (%) - Asian
Year householder moved into unit - Moved in 1995 to 1998 (%) - Hispanic or Latino
Year householder moved into unit - Moved in 1995 to 1998 (%) - American Indian and Alaska Native
Year householder moved into unit - Moved in 1995 to 1998 (%) - Multirace
Year householder moved into unit - Moved in 1995 to 1998 (%) - Other Race
Year householder moved into unit - Moved in 1990 to 1994 (%)
Year householder moved into unit - Moved in 1990 to 1994 (%) - White
Year householder moved into unit - Moved in 1990 to 1994 (%) - Black or African American
Year householder moved into unit - Moved in 1990 to 1994 (%) - Asian
Year householder moved into unit - Moved in 1990 to 1994 (%) - Hispanic or Latino
Year householder moved into unit - Moved in 1990 to 1994 (%) - American Indian and Alaska Native
Year householder moved into unit - Moved in 1990 to 1994 (%) - Multirace
Year householder moved into unit - Moved in 1990 to 1994 (%) - Other Race
Year householder moved into unit - Moved in 1980 to 1989 (%)
Year householder moved into unit - Moved in 1980 to 1989 (%) - White
Year householder moved into unit - Moved in 1980 to 1989 (%) - Black or African American
Year householder moved into unit - Moved in 1980 to 1989 (%) - Asian
Year householder moved into unit - Moved in 1980 to 1989 (%) - Hispanic or Latino
Year householder moved into unit - Moved in 1980 to 1989 (%) - American Indian and Alaska Native
Year householder moved into unit - Moved in 1980 to 1989 (%) - Multirace
Year householder moved into unit - Moved in 1980 to 1989 (%) - Other Race
Year householder moved into unit - Moved in 1970 to 1979 (%)
Year householder moved into unit - Moved in 1970 to 1979 (%) - White
Year householder moved into unit - Moved in 1970 to 1979 (%) - Black or African American
Year householder moved into unit - Moved in 1970 to 1979 (%) - Asian
Year householder moved into unit - Moved in 1970 to 1979 (%) - Hispanic or Latino
Year householder moved into unit - Moved in 1970 to 1979 (%) - American Indian and Alaska Native
Year householder moved into unit - Moved in 1970 to 1979 (%) - Multirace
Year householder moved into unit - Moved in 1970 to 1979 (%) - Other Race
Year householder moved into unit - Moved in 1969 or earlier (%)
Year householder moved into unit - Moved in 1969 or earlier (%) - White
Year householder moved into unit - Moved in 1969 or earlier (%) - Black or African American
Year householder moved into unit - Moved in 1969 or earlier (%) - Asian
Year householder moved into unit - Moved in 1969 or earlier (%) - Hispanic or Latino
Year householder moved into unit - Moved in 1969 or earlier (%) - American Indian and Alaska Native
Year householder moved into unit - Moved in 1969 or earlier (%) - Multirace
Year householder moved into unit - Moved in 1969 or earlier (%) - Other Race
Housing units lacking complete plumbing facilities (%)
Housing units lacking complete kitchen facilities (%)
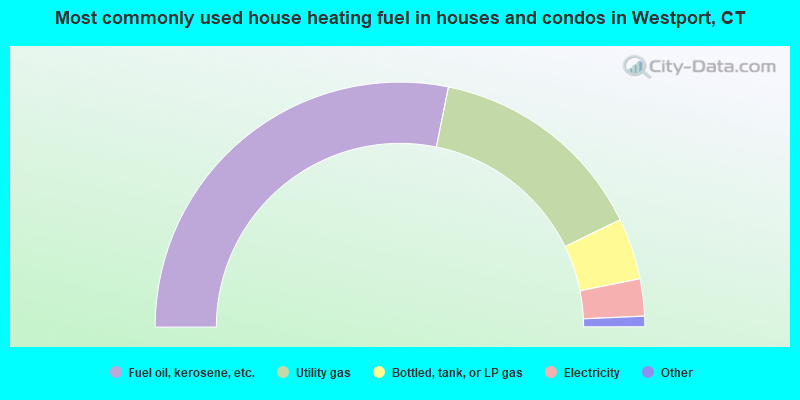
House heating fuel used in houses and condos - Utility gas (%)
House heating fuel used in houses and condos - Bottled, tank, or LP gas (%)
House heating fuel used in houses and condos - Electricity (%)
House heating fuel used in houses and condos - Fuel oil, kerosene, etc. (%)
House heating fuel used in houses and condos - Coal or coke (%)
House heating fuel used in houses and condos - Wood (%)
House heating fuel used in houses and condos - Solar energy (%)
House heating fuel used in houses and condos - Other fuel (%)
House heating fuel used in houses and condos - No fuel used (%)
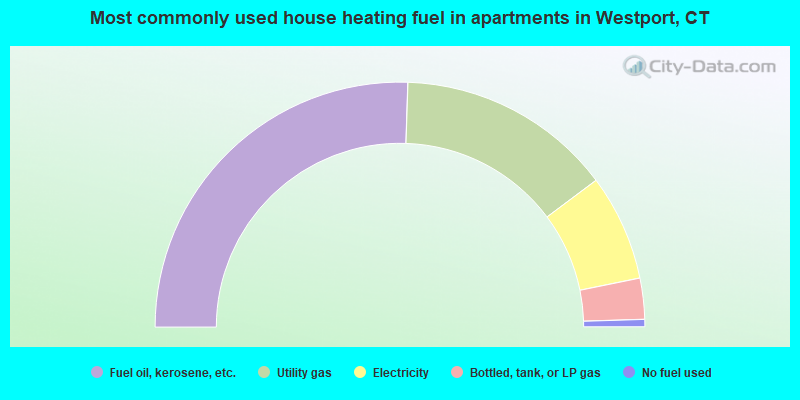
House heating fuel used in apartments - Utility gas (%)
House heating fuel used in apartments - Bottled, tank, or LP gas (%)
House heating fuel used in apartments - Electricity (%)
House heating fuel used in apartments - Fuel oil, kerosene, etc. (%)
House heating fuel used in apartments - Coal or coke (%)
House heating fuel used in apartments - Wood (%)
House heating fuel used in apartments - Solar energy (%)
House heating fuel used in apartments - Other fuel (%)
House heating fuel used in apartments - No fuel used (%)
Latest news about housing in Westport, CT collected exclusively by city-data.com from local newspapers, TV, and radio stations
Median year house/condo built: 1965Median year apartment built: 1965Household type by relationship:
Households: 28,282
Male householders: 5,089 (703 living alone ), Female householders: 4,920 (1,387 living alone )6,880 spouses (6,868 opposite-sex spouses ), 265 unmarried partners , (208 opposite-sex unmarried partners ), 9,742 children (9,380 natural , 205 adopted , 156 stepchildren ), 149 grandchildren , 72 brothers or sisters , 279 parents , 0 foster children , 219 other relatives , 448 non-relatives In group quarters: 214
Size of family households: 2,980 2-persons , 1,726 3-persons , 1,997 4-persons , 778 5-persons , 205 6-persons , 66 7-or-more-persons .
Size of nonfamily households: 2,217 1-person , 293 2-persons , 22 3-persons .
6,368 married couples with children. single-parent households (335 men , 388 women ).
85.6% of residents of Westport speak English at home. of residents speak Spanish at home (90% speak English very well , 10% speak English well ).of residents speak other Indo-European language at home (85% speak English very well , 9% speak English well , 3% speak English not well , 2% don't speak English at all ).of residents speak Asian or Pacific Island language at home (69% speak English very well , 16% speak English well , 12% speak English not well , 2% don't speak English at all ).of residents speak other language at home (45% speak English very well , 55% speak English well ).
Foreign born population: 4,185 (14.8%)of them are naturalized citizens )
Median number of rooms in houses and condos:
Median number of rooms in apartments
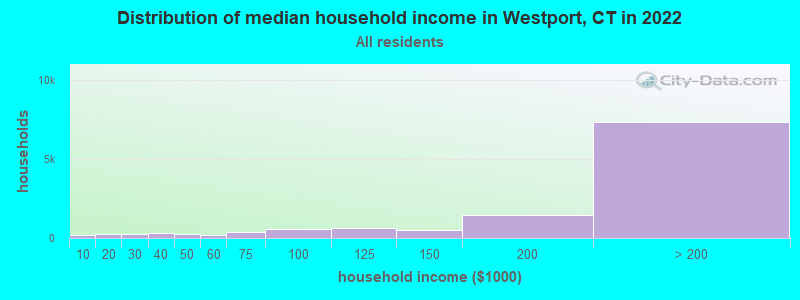
Westport, CT household income distribution 210 Less than $10,000244 $10,000 to $19,999281 $20,000 to $29,999301 $30,000 to $39,999226 $40,000 to $49,999159 $50,000 to $59,999365 $60,000 to $74,999562 $75,000 to $99,999661 $100,000 to $124,999480 $125,000 to $149,9991,456 $150,000 to $199,9997,337 $200,000 or more
Home value of owner - occupied houses in 2022 in Westport, CT 27 Less than $10,0006 $15,000 to $19,99917 $25,000 to $29,9996 $30,000 to $34,99910 $40,000 to $49,9999 $50,000 to $59,9994 $80,000 to $89,9998 $100,000 to $124,9996 $125,000 to $149,99920 $150,000 to $174,99928 $175,000 to $199,99961 $200,000 to $249,999100 $250,000 to $299,999179 $300,000 to $399,999333 $400,000 to $499,9991,754 $500,000 to $749,9991,999 $750,000 to $999,9992,902 $1,000,000 to $1,499,9991,580 $1,500,000 to $1,999,9992,024 $2,000,000 or moreRent paid by renters in 2022 in Westport, CT 28 $400 to $4497 $450 to $49925 $550 to $59917 $650 to $69922 $750 to $79956 $800 to $89949 $900 to $999150 $1,000 to $1,249181 $1,250 to $1,499445 $1,500 to $1,999423 $2,000 to $2,499156 $2,500 to $2,999324 $3,000 to $3,499346 $3,500 or more45 No cash rent
Percentage of workers working in this county: 65.7%Number of people working at home: 4,675 (36.8% of all workers )
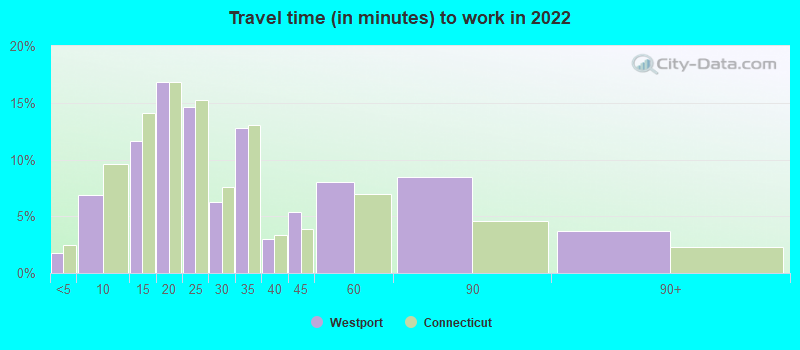
Travel time to work (commute)
Less than 5 minutes: 2745 to 9 minutes: 92310 to 14 minutes: 1,04915 to 19 minutes: 97820 to 24 minutes: 1,03825 to 29 minutes: 36530 to 34 minutes: 71935 to 39 minutes: 34740 to 44 minutes: 40445 to 59 minutes: 67660 to 89 minutes: 1,10390 or more minutes: 2,091
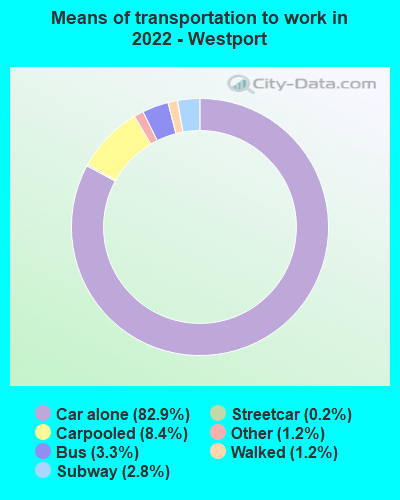
Means of transportation to work:
Drove a car alone: 13,326 (68.8%)Carpooled: 1,315 (6.8%)Bus : 380 (2.0%)Subway or elevated rail : 95 (0.5%)Long-distance train or commuter rail : 314 (1.6%)Taxi: 256 (1.3%)Walked: 220 (1.1%)Worked at home: 4,794 (24.8%)
Unemployment by race in 2022
Unemployment rate for White non-Hispanic residents 3.4% Males2.4% FemalesUnemployment rate for Black residents 18.9% MalesUnemployment rate for Asian residents 15.3% MalesUnemployment rate for two or more race residents 15.4% Males2.2% FemalesUnemployment rate for Hispanic or Latino residents 6.5% Males12.7% Females
Year of entry for the foreign-born population in Westport, Connecticut
1,451 2010 or later 864 2000 to 2009 734 1990 to 1999 559 1980 to 1989 387 1970 to 1979 977 Before 1970
First ancestries reported:
Italian: 1,230 (10.0%)
Eastern European: 1,187 (9.6%)
English: 926 (7.5%)
Irish: 924 (7.5%)
American: 910 (7.4%)
European: 566 (4.6%)
British: 442 (3.6%)
German: 415 (3.4%)
Russian: 398 (3.2%)
Polish: 285 (2.3%)
Greek: 207 (1.7%)
Scottish: 162 (1.3%)
Dutch: 115 (0.9%)
Haitian: 114 (0.9%)
Hungarian: 105 (0.9%)
Scotch-Irish: 80 (0.6%)
French: 73 (0.6%)
Romanian: 62 (0.5%)
Swedish: 61 (0.5%)
Lebanese: 59 (0.5%)
Armenian: 59 (0.5%)
Canadian: 54 (0.4%)
French Canadian: 50 (0.4%)
Ukrainian: 49 (0.4%)
Norwegian: 48 (0.4%)
Danish: 44 (0.4%)
Arab: 37 (0.3%)
Lithuanian: 35 (0.3%)
Austrian: 34 (0.3%)
Portuguese: 32 (0.3%)
Czech: 29 (0.2%)
Australian: 28 (0.2%)
Egyptian: 28 (0.2%)
Macedonian: 26 (0.2%)
Cajun: 26 (0.2%)
Latvian: 24 (0.2%)
Belgian: 23 (0.2%)
Jamaican: 23 (0.2%)
Israeli: 21 (0.2%)
Welsh: 21 (0.2%)
Slovak: 20 (0.2%)
Brazilian: 20 (0.2%)
Palestinian: 19 (0.2%)
Northern European: 17 (0.1%)
Serbian: 14 (0.1%)
Moroccan: 13 (0.1%)
Iranian: 13 (0.1%)
Croatian: 13 (0.1%)
Turkish: 13 (0.1%)
Celtic: 11 (0.09%)
South African: 11 (0.09%)
West Indian: 7 (0.06%)
Finnish: 6 (0.05%)
Most common places of birth for foreign-born residents (%): United Kingdom, excluding England and Scotland Westport:
14.7% (580)Connecticut:
100.0% (-1)
China, excluding Hong Kong and Taiwan Westport:
7.7% (304)Connecticut:
100.0% (-1)
India Westport:
7.7% (303)Connecticut:
100.0% (-1)
England Westport:
5.3% (208)Connecticut:
100.0% (-1)
Canada Westport:
4.8% (190)Connecticut:
100.0% (-1)
Denmark Westport:
3.9% (153)Connecticut:
100.0% (-1)
Korea Westport:
3.3% (129)Connecticut:
100.0% (-1)
Colombia Westport:
3.2% (125)Connecticut:
100.0% (-1)
Germany Westport:
2.7% (106)Connecticut:
100.0% (-1)
Hong Kong Westport:
2.1% (84)Connecticut:
100.0% (-1)
Other Eastern Europe Westport:
2.1% (83)Connecticut:
100.0% (-1)
Russia Westport:
2.1% (82)Connecticut:
100.0% (-1)
Greece Westport:
1.9% (75)Connecticut:
100.0% (-1)
Italy Westport:
1.8% (72)Connecticut:
100.0% (-1)
Brazil Westport:
1.8% (71)Connecticut:
100.0% (-1)
Place of birth for U.S.-born residents:
This state: 8,159Other state: 15,021Northeast: 10,756Midwest: 1,581South: 1,416West: 1,360 90.4% of Westport residents lived in the same house 1 years ago.
Out of people who lived in different houses, 35.3% lived in this county.
Out of people who lived in different counties, 2.8% lived in Connecticut.
Westport:
90.4%State average:
88.4%
Education attainment for males 25 years and older:
No schooling: 62Nursery to 4th grade: 05th and 6th grade: 57th and 8th grade: 59th grade: 2310th grade: 1811th grade: 2012th grade, no diploma: 55High school graduate (or equivalency): 581Less than 1 year of college: 182Some college more than 1 year, no degree: 426Associate degree: 159Bachelor's degree: 3,214Master's degree: 2,865Professional school degree: 1,326Doctorate degree: 361
Education attainment for females 25 years and older:
No schooling: 60Nursery to 4th grade: 175th and 6th grade: 77th and 8th grade: 529th grade: 710th grade: 1211th grade: 612th grade, no diploma: 33High school graduate (or equivalency): 988Less than 1 year of college: 185Some college more than 1 year, no degree: 602Associate degree: 406Bachelor's degree: 4,535Master's degree: 2,647Professional school degree: 835Doctorate degree: 226
Housing units in structures:
One, detached: 9,550One, attached: 599Two: 3763 or 4: 2075 to 9: 8110 to 19: 10420 to 49: 4450 or more: 109Mobile homes: 45Median worth of mobile homes: $404,198
Housing units lacking complete plumbing facilities in 2022: 0.7%Housing units lacking complete kitchen facilities in 2022: 0.7%House/condo owner moved in on average 12 years ago
Renter moved in on average 4 years ago
Private vs. public school enrollment:
Students in private schools in grades 1 to 8 (elementary and middle school): 374 Here:
10.3%Connecticut:
9.5%
Students in private schools in grades 9 to 12 (high school): 205 Here:
9.8%Connecticut:
12.9%
Students in private undergraduate colleges: 539 Here:
47.4%Connecticut:
35.5%