Westport, MA (Massachusetts) Houses and Residents
| Westport: | $489,267 |
| Massachusetts: | $534,700 |
Total population: 15,532 (Urban population: 6,570, Rural population: 7,613 (142 farm, 7,471 nonfarm))
Houses: 6,143 (5,386 occupied: 4,461 owner occupied, 925 renter occupied)
| % of renters here: | 17% |
| State: | 38% |
Housing density: 123 houses/condos per square mile
Median price asked for vacant for-sale houses and condos in 2022 in this county: $509,684.
Median contract rent in 2022: $1,210 (lower quartile is $927, upper quartile is $1,635)
Median rent asked for vacant for-rent units in 2022: $1,047
Median gross rent in Westport, MA in 2022: $1,469
Housing units in Westport with a mortgage: 2,708 (289 second mortgage, 420 home equity loan, 0 both second mortgage and home equity loan)
Houses without a mortgage: 1,204


Household type by relationship:
Households: 532,417- In family households: 444,740 (93,440 male householders, 47,898 female householders)
101,208 spouses, 160,791 children (151,812 natural, 3,293 adopted, 5,686 stepchildren), 9,612 grandchildren, 4,550 brothers or sisters, 5,590 parents, foster children, 4,929 other relatives, 12,847 non-relatives
- In nonfamily households: 87,677 (32,955 male householders (25,495 living alone)), 38,717 female householders (32,941 living alone)), 16,005 nonrelatives
- In group quarters: 15,868 (6,219 institutionalized population)
88,038 married couples with children.
33,142 single-parent households (5,908 men, 27,234 women).
85.5% of residents of Westport speak English at home.
0.8% of residents speak Spanish at home (94% speak English very well, 6% speak English not well).
12.7% of residents speak other Indo-European language at home (72% speak English very well, 16% speak English well, 11% speak English not well, 1% don't speak English at all).
0.5% of residents speak Asian or Pacific Island language at home (64% speak English very well, 36% speak English well).
0.5% of residents speak other language at home (100% speak English very well).
Foreign born population: 1,455 (9.5%)
(78.0% of them are naturalized citizens)
| Here: | 6.4 |
| State: | 6.5 |
| Here: | 4.4 |
| State: | 4.0 |

- Bedrooms in owner-occupied houses and condos in Westport, Massachusetts
- 0no bedroom
- 1351 bedroom
- 9272 bedrooms
- 2,5343 bedrooms
- 6844 bedrooms
- 1815+ bedrooms

- Bedrooms in renter-occupied apartments in Westport, Massachusetts
- 19no bedroom
- 2051 bedroom
- 4412 bedrooms
- 1893 bedrooms
- 444 bedrooms
- 275+ bedrooms

- Cars and other vehicles available in Westport in owner-occupied houses/condos
- 161no vehicle
- 1,0641 vehicle
- 2,1462 vehicles
- 8193 vehicles
- 2314 vehicles
- 405+ vehicles

- Cars and other vehicles available in Westport in renter-occupied apartments
- 69no vehicle
- 4851 vehicle
- 2902 vehicles
- 373 vehicles
- 444 vehicles
- 05+ vehicles

- Rooms in owner-occupied houses in Westport, Massachusetts
- 01 room
- 152 rooms
- 733 rooms
- 2954 rooms
- 1,0975 rooms
- 1,1536 rooms
- 7317 rooms
- 4738 rooms
- 6249+ rooms

- Rooms in renter-occupied apartments in Westport, Massachusetts
- 101 room
- 922 rooms
- 1153 rooms
- 3174 rooms
- 1405 rooms
- 1096 rooms
- 617 rooms
- 178 rooms
- 649+ rooms


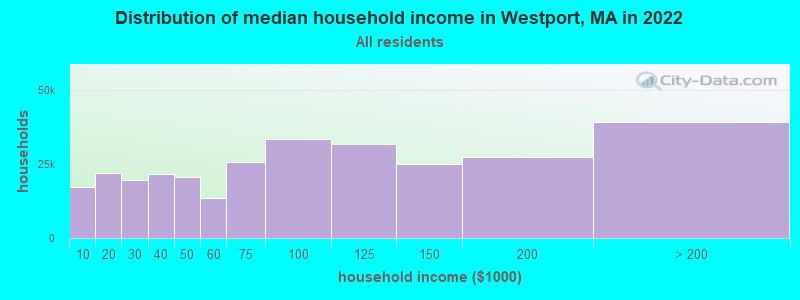
Westport, MA household income distribution

- 17,337Less than $10,000
- 21,787$10,000 to $19,999
- 19,606$20,000 to $29,999
- 21,761$30,000 to $39,999
- 20,469$40,000 to $49,999
- 13,580$50,000 to $59,999
- 25,593$60,000 to $74,999
- 33,488$75,000 to $99,999
- 31,781$100,000 to $124,999
- 25,138$125,000 to $149,999
- 27,490$150,000 to $199,999
- 39,177$200,000 or more
Percentage of workers working in this county: 75.6%
Number of people working at home: 960 (11.5% of all workers)
Travel time to work (commute)
- Less than 5 minutes: 92
- 5 to 9 minutes: 490
- 10 to 14 minutes: 978
- 15 to 19 minutes: 1,379
- 20 to 24 minutes: 1,242
- 25 to 29 minutes: 411
- 30 to 34 minutes: 789
- 35 to 39 minutes: 156
- 40 to 44 minutes: 271
- 45 to 59 minutes: 449
- 60 to 89 minutes: 331
- 90 or more minutes: 269
Means of transportation to work:
- Drove a car alone: 6,134 (85.8%)
- Carpooled: 599 (8.4%)
- Bus or trolley bus: 36 (0.5%)
- Subway or elevated: 9 (0.1%)
- Walked: 59 (0.8%)
- Other means: 20 (0.3%)
- Worked at home: 296 (4.1%)


- Year of entry for the foreign-born population in Westport, Massachusetts
- 441995 to March 2000
- 321990 to 1994
- 391985 to 1989
- 731980 to 1984
- 2421975 to 1979
- 2331970 to 1974
- 2491965 to 1969
- 235Before 1965

First ancestries reported:
- Portuguese: 4,918 (30.0%)
- English: 2,423 (14.8%)
- French: 2,247 (13.7%)
- Irish: 1,802 (11.0%)
- French Canadian: 1,339 (8.2%)
- Other: 783 (4.8%)
- Italian: 657 (4.0%)
- Polish: 654 (4.0%)
- United States: 447 (2.7%)
- German: 299 (1.8%)
- Scottish: 260 (1.6%)
- Scotch-Irish: 143 (0.9%)
- Dutch: 64 (0.4%)
- Greek: 63 (0.4%)
- Arab: 62 (0.4%)
- Swedish: 60 (0.4%)
- Norwegian: 50 (0.3%)
- Czech: 35 (0.2%)
- Subsaharan African: 29 (0.2%)
- Welsh: 20 (0.1%)
- Hungarian: 19 (0.1%)
- Swiss: 11 (0.07%)
- Danish: 9 (0.05%)
- Russian: 9 (0.05%)
- Lithuanian: 6 (0.04%)
- West Indian: 5 (0.03%)
Most common places of birth for foreign-born residents (%):
| Westport: | 70.6% (810) |
| Massachusetts: | 8.6% (66,627) |
| Westport: | 4.3% (49) |
| Massachusetts: | 3.6% (28,086) |
| Westport: | 3.2% (37) |
| Massachusetts: | 0.4% (2,765) |
| Westport: | 2.4% (27) |
| Massachusetts: | 3.3% (25,403) |
| Westport: | 2.3% (26) |
| Massachusetts: | 5.1% (39,255) |
| Westport: | 1.7% (20) |
| Massachusetts: | 1.9% (14,883) |
| Westport: | 1.7% (19) |
| Massachusetts: | 1.7% (13,456) |
Place of birth for U.S.-born residents:
- This state: 11,285
- Other state: 1,708
- Northeast: 1,322
- Midwest: 142
- South: 132
- West: 112
70% of Westport residents lived in the same house 5 years ago.
Out of people who lived in different houses, 82% lived in this county.
Out of people who lived in different counties, 30% lived in Massachusetts.
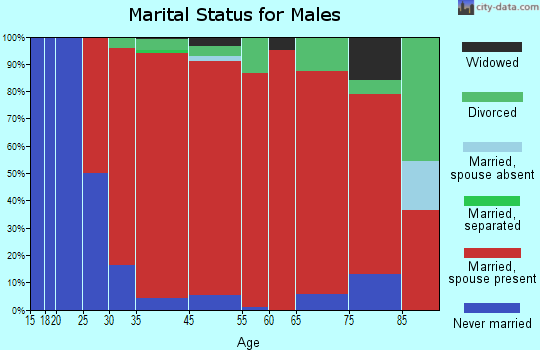
Education attainment for males 25 years and older:
- No schooling: 111
- Nursery to 4th grade: 55
- 5th and 6th grade: 86
- 7th and 8th grade: 286
- 9th grade: 100
- 10th grade: 206
- 11th grade: 136
- 12th grade, no diploma: 72
- High school graduate (or equivalency): 1,489
- Less than 1 year of college: 241
- Some college more than 1 year, no degree: 505
- Associate degree: 373
- Bachelor's degree: 615
- Master's degree: 387
- Professional school degree: 183
- Doctorate degree: 77

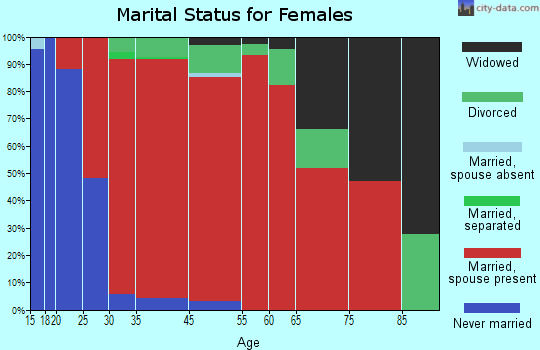
Education attainment for females 25 years and older:
- No schooling: 57
- Nursery to 4th grade: 50
- 5th and 6th grade: 52
- 7th and 8th grade: 317
- 9th grade: 169
- 10th grade: 195
- 11th grade: 168
- 12th grade, no diploma: 122
- High school graduate (or equivalency): 1,544
- Less than 1 year of college: 253
- Some college more than 1 year, no degree: 533
- Associate degree: 467
- Bachelor's degree: 755
- Master's degree: 407
- Professional school degree: 92
- Doctorate degree: 53

Housing units in structures:
- One, detached: 5,199
- One, attached: 160
- Two: 499
- 3 or 4: 138
- 5 to 9: 106
- 10 to 19: 18
- 50 or more: 10
- Mobile homes: 13
Median worth of mobile homes: $262,563
Housing units lacking complete kitchen facilities: 0.4%

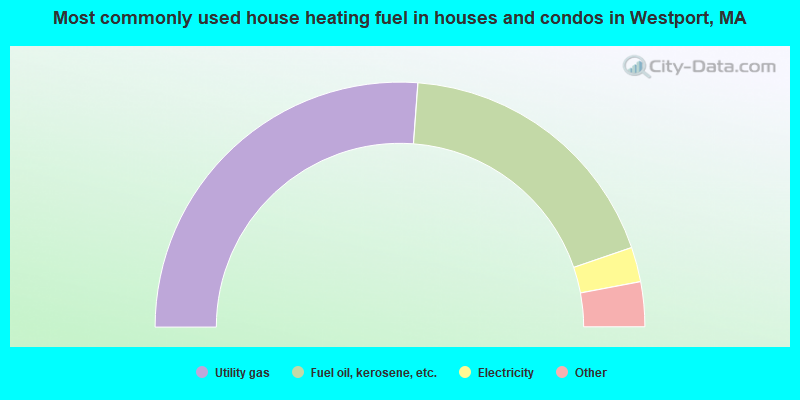
- 52.3%Utility gas
- 37.1%Fuel oil, kerosene, etc.
- 4.6%Electricity
- 3.8%Bottled, tank, or LP gas
- 2.0%Wood
- 0.2%Other fuel
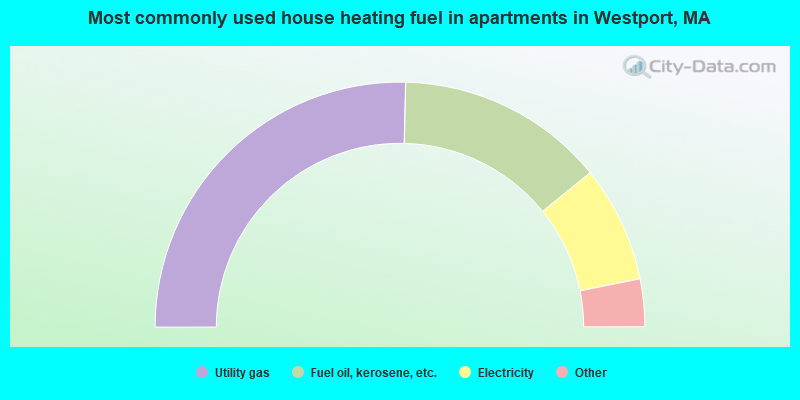
- 50.8%Utility gas
- 27.6%Fuel oil, kerosene, etc.
- 15.4%Electricity
- 2.9%Bottled, tank, or LP gas
- 2.4%Wood
- 1.0%Other fuel
Private vs. public school enrollment:
| Here: | 16.9% |
| Massachusetts: | 10.8% |
| Here: | 21.9% |
| Massachusetts: | 12.2% |
| Here: | 31.6% |
| Massachusetts: | 48.2% |


