White Horse, NJ (New Jersey) Houses and Residents
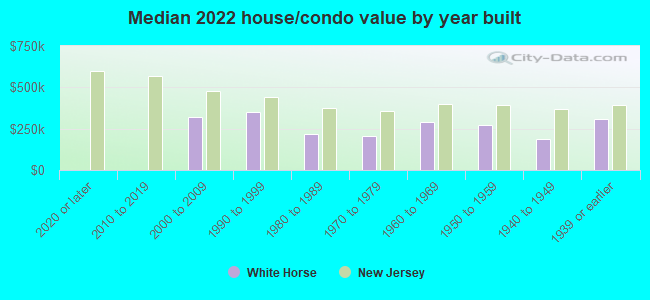
| White Horse: | $278,667 |
| New Jersey: | $428,900 |
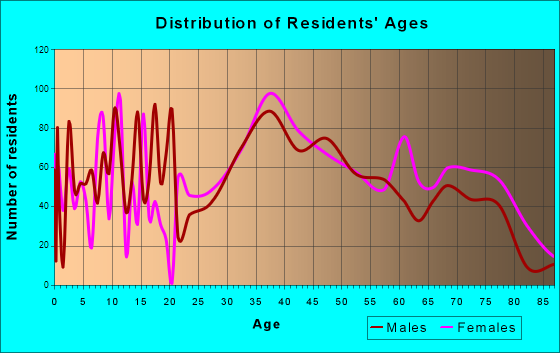
Total population: 9,494 (All urban)
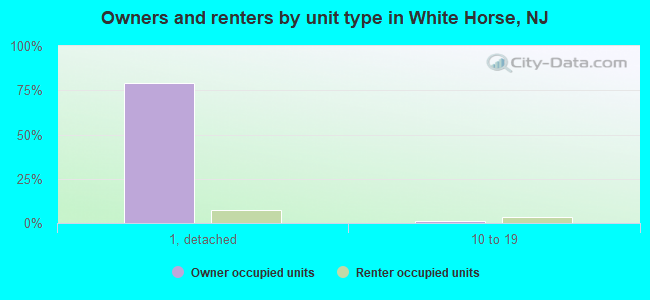
Houses: 4,007 (3,874 occupied: 3,360 owner occupied, 647 renter occupied)
| % of renters here: | 16% |
| State: | 35% |
Housing density: 1,258 houses/condos per square mile
Median price asked for vacant for-sale houses and condos in 2022: $2,706,896.
Median contract rent in 2022: $1,402 (lower quartile is $1,132, upper quartile is $1,846)
Median rent asked for vacant for-rent units in 2022: $1,420
Median gross rent in White Horse, NJ in 2022: $1,515
Housing units in White Horse with a mortgage: 2,265 (219 second mortgage, 18 home equity loan, 199 both second mortgage and home equity loan)
Houses without a mortgage: 71
Median household income for houses/condos with a mortgage: $127,633
Median household income for apartments without a mortgage: $79,451
Median monthly housing costs: $1,647
Compare current foreclosures near White Horse, NJ:
| Photo | Address | Area | Beds / Baths | Price | Details |
|---|---|---|---|---|---|

|
#1
Sumach St
Browns Mills, NJ 08015
|
1,274 sq. feet
|
1 baths 3 beds |
$299,900
|
show details |

|
#2
Moore Ct
Pennington, NJ 08534
|
940 sq. feet
|
1 baths 2 beds |
$195,993
|
show details |

|
#3
Brunswick Ave
Trenton, NJ 08618
|
1,088 sq. feet
|
1 baths 2 beds |
$74,900
|
show details |

|
#4
Arneys Mount Rd
Pemberton, NJ 08068
|
2,514 sq. feet
|
2 baths 3 beds |
$399,000
|
show details |

|
#5
N Cedar St
Bristol, PA 19007
|
841 sq. feet
|
1 baths 1 beds |
$315,500
|
show details |

|
#6
Farragut Ct
Willingboro, NJ 08046
|
954 sq. feet
|
1 baths 2 beds |
$174,900
|
show details |

|
#7
Bunker Hill Ave
Trenton, NJ 08648
|
840 sq. feet
|
1 baths 2 beds |
$275,000
|
show details |

|
#8
Medford Rd
Philadelphia, PA 19154
|
1,360 sq. feet
|
1 baths 3 beds |
$161,441
|
show details |

|
#9
Fairdale Rd
Philadelphia, PA 19154
|
1,152 sq. feet
|
1 baths 3 beds |
$178,593
|
show details |

|
#10
Knights Bridge Dr
Morrisville, PA 19067
|
2,896 sq. feet
|
2 baths 4 beds |
$596,172
|
show details |
| Photo | Address | Area | Beds / Baths | Price | Details |
|---|---|---|---|---|---|

|
#11
Locust Ave
Bensalem, PA 19020
|
1,260 sq. feet
|
1 baths 3 beds |
$295,402
|
show details |

|
#12
Rocky Pool Ln
Levittown, PA 19055
|
992 sq. feet
|
2 baths - beds |
$205,046
|
show details |

|
#13
Portsmouth Ct
Bensalem, PA 19020
|
1,400 sq. feet
|
1 baths 3 beds |
show details | |

|
#14
Fairdale Rd
Philadelphia, PA 19154
|
1,296 sq. feet
|
1 baths 3 beds |
show details | |

|
#15
Marshall Ave
Trenton, NJ 08610
|
672 sq. feet
|
1 baths 3 beds |
show details | |

|
#16
Aspen Ct
Newtown, PA 18940
|
2,020 sq. feet
|
2 baths 3 beds |
show details | |

|
#17
Newportville Rd
Levittown, PA 19056
|
2,034 sq. feet
|
1 baths 3 beds |
show details | |

|
#18
Jewel Rd
Princeton Junction, NJ 08550
|
- sq. feet
|
2 baths 4 beds |
show details | |

|
#19
Franklin Ave
Croydon, PA 19021
|
1,559 sq. feet
|
2 baths 3 beds |
show details | |

|
#20
Morris St
Browns Mills, NJ 08015
|
1,236 sq. feet
|
2 baths 3 beds |
show details |
| Photo | Address | Area | Beds / Baths | Price | Details |
|---|---|---|---|---|---|

|
#21
Garfield Ave
Croydon, PA 19021
|
2,017 sq. feet
|
2 baths 3 beds |
show details | |

|
#22
Heather St
Browns Mills, NJ 08015
|
1,276 sq. feet
|
1 baths 3 beds |
show details | |

|
#23
Beverly Rd
Burlington, NJ 08016
|
1,576 sq. feet
|
1 baths 3 beds |
show details | |

|
#24
N Pennsylvania Ave
Morrisville, PA 19067
|
- sq. feet
|
2 baths 6 beds |
show details | |

|
#25
Hulmeville Rd
Bensalem, PA 19020
|
1,908 sq. feet
|
1 baths 3 beds |
show details | |

|
#26
Hulmeville Rd
Langhorne, PA 19047
|
2,832 sq. feet
|
3 baths 4 beds |
show details | |

|
#27
Carlyle Dr
Wrightstown, NJ 08562
|
2,567 sq. feet
|
2 baths 3 beds |
show details | |

|
#28
As Garfield Street
Croydon, PA Array
|
- sq. feet
|
- baths - beds |
$440,537
|
show details |

|
#29
Windward Ln
Bensalem, PA 19020
|
1,520 sq. feet
|
2 baths 3 beds |
show details | |

|
#30
Waldemire Dr
Philadelphia, PA 19154
|
1,332 sq. feet
|
2 baths 4 beds |
show details |
| Photo | Address | Area | Beds / Baths | Price | Details |
|---|---|---|---|---|---|

|
#31
Dana Ave
Bensalem, PA 19020
|
1,332 sq. feet
|
1 baths 2 beds |
show details | |

|
#32
Howley Dr
Morrisville, PA 19067
|
2,502 sq. feet
|
3 baths 3 beds |
show details | |

|
#33
Farner Ave
Burlington, NJ 08016
|
1,344 sq. feet
|
2 baths 3 beds |
show details | |

|
#34
Fairway Rd
Bensalem, PA 19020
|
2,377 sq. feet
|
2 baths 4 beds |
show details | |

|
#35
Forman Dr
Trenton, NJ 08690
|
1,080 sq. feet
|
1 baths 3 beds |
show details | |

|
#36
E Philadelphia Ave
Morrisville, PA 19067
|
- sq. feet
|
1 baths 3 beds |
show details | |

|
#37
Theresa Dr
Philadelphia, PA 19116
|
1,200 sq. feet
|
2 baths 4 beds |
show details | |

|
#38
Peachtree Ln
Levittown, PA 19054
|
1,468 sq. feet
|
2 baths 2 beds |
show details | |

|
#39
Manor Rd
Beverly, NJ 08010
|
1,368 sq. feet
|
2 baths 3 beds |
show details | |

|
#40
Groendyke Cir
Perrineville, NJ 08535
|
- sq. feet
|
3 baths 6 beds |
show details |
| Photo | Address | Area | Beds / Baths | Price | Details |
|---|---|---|---|---|---|

|
#41
Edgely Rd
Levittown, PA 19057
|
- sq. feet
|
2 baths 3 beds |
show details | |

|
#42
White Beech Dr
Trenton, NJ 08618
|
1,536 sq. feet
|
2 baths 3 beds |
show details | |

|
#43
Lawrenceville Rd
Princeton, NJ 08540
|
2,409 sq. feet
|
3 baths 4 beds |
show details | |

|
#44
Townsend Rd # H1
Philadelphia, PA 19154
|
1,500 sq. feet
|
1 baths 3 beds |
show details | |

|
#45
Ardmore Ave
Trenton, NJ 08629
|
1,392 sq. feet
|
2 baths 3 beds |
show details | |

|
#46
Biscayne Dr
Philadelphia, PA 19154
|
1,224 sq. feet
|
1 baths 3 beds |
show details | |

|
#47
Monmouth Rd
Jobstown, NJ 08041
|
672 sq. feet
|
1 baths 2 beds |
show details | |

|
#48
Arrahbella Avenue
Browns Mills, NJ 08015
|
1,472 sq. feet
|
3 baths 3 beds |
show details | |

|
#49
Toledo Ln
Willingboro, NJ 08046
|
1,685 sq. feet
|
3 baths 3 beds |
show details | |

|
Check over 1 million property listings on Foreclosure.com!
|
browse all offers | |||


 | Stockton University and surrounding areas related question (20 replies) |
| The South Jersey Barbecue Belt: seeking recommendations and/or recollections (30 replies) |
| I am looking for an apartment complex in Camden County (6 replies) |
| PREIT sells Voorhees Town Ctr Mall (64 replies) |
| Oaklyn if schools don't matter? (21 replies) |
| Is Collingswood safe for a single female? (33 replies) |
Median year apartment built: 1968
Household type by relationship:
Households: 9,615- Male householders: 2,029 (500 living alone), Female householders: 1,796 (601 living alone)
2,054 spouses (2,052 opposite-sex spouses), 190 unmarried partners, (175 opposite-sex unmarried partners), 2,675 children (2,490 natural, 25 adopted, 159 stepchildren), 49 grandchildren, 95 brothers or sisters, 404 parents, 0 foster children, 114 other relatives, 199 non-relatives
- In group quarters: 4
Size of family households: 1,072 2-persons, 985 3-persons, 365 4-persons, 357 5-persons, 9 7-or-more-persons.
Size of nonfamily households: 1,084 1-person, 188 2-persons.
1,080 married couples with children.
390 single-parent households (307 men, 83 women).
70.4% of residents of White Horse speak English at home.
20.8% of residents speak Spanish at home (55% speak English very well, 23% speak English well, 22% speak English not well).
3.9% of residents speak other Indo-European language at home (86% speak English very well, 14% speak English not well).
3.2% of residents speak Asian or Pacific Island language at home (60% speak English very well, 40% speak English well).
1.0% of residents speak other language at home (31% speak English very well, 42% speak English well, 27% speak English not well).
Foreign born population: 1,584 (16.5%)
(62.4% of them are naturalized citizens)
| Here: | 6.2 |
| State: | 6.8 |
| Here: | 4.8 |
| State: | 3.9 |
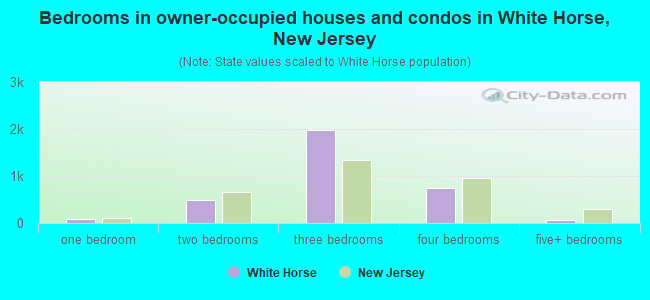
- Bedrooms in owner-occupied houses and condos in White Horse, New Jersey
- 0no bedroom
- 811 bedroom
- 4892 bedrooms
- 1,9813 bedrooms
- 7524 bedrooms
- 565+ bedrooms
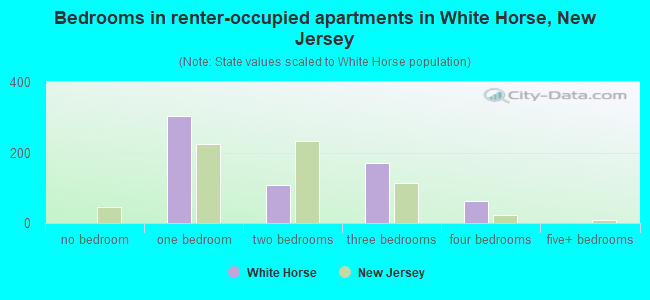
- Bedrooms in renter-occupied apartments in White Horse, New Jersey
- 0no bedroom
- 3041 bedroom
- 1092 bedrooms
- 1713 bedrooms
- 624 bedrooms
- 05+ bedrooms
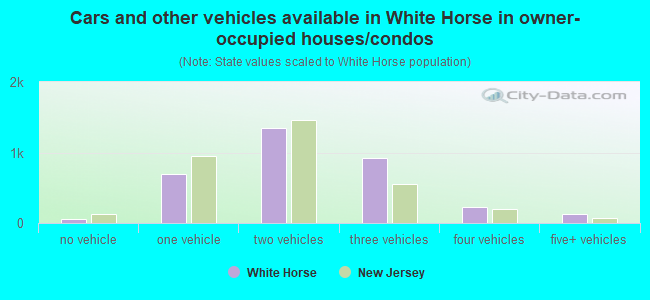
- Cars and other vehicles available in White Horse in owner-occupied houses/condos
- 50no vehicle
- 7021 vehicle
- 1,3482 vehicles
- 9153 vehicles
- 2224 vehicles
- 1235+ vehicles
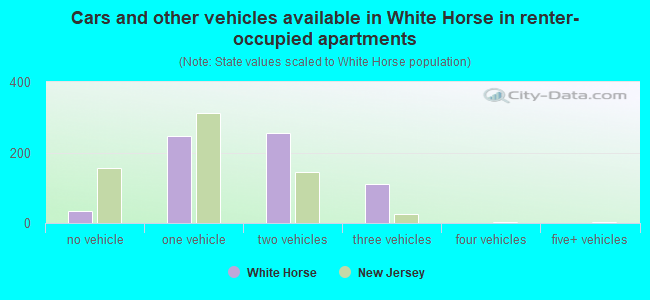
- Cars and other vehicles available in White Horse in renter-occupied apartments
- 35no vehicle
- 2461 vehicle
- 2552 vehicles
- 1113 vehicles
- 04 vehicles
- 05+ vehicles
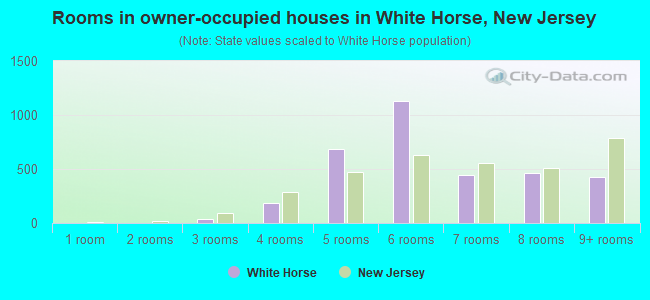
- Rooms in owner-occupied houses in White Horse, New Jersey
- 01 room
- 02 rooms
- 383 rooms
- 1814 rooms
- 6855 rooms
- 1,1296 rooms
- 4427 rooms
- 4628 rooms
- 4239+ rooms
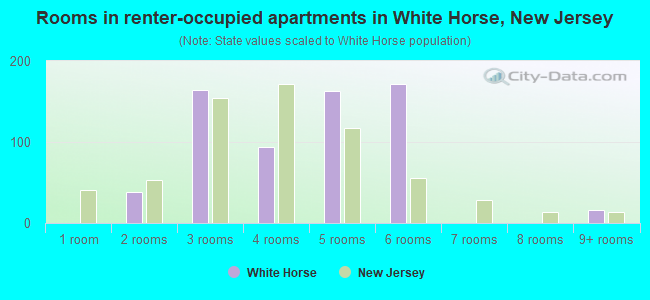
- Rooms in renter-occupied apartments in White Horse, New Jersey
- 01 room
- 382 rooms
- 1643 rooms
- 944 rooms
- 1635 rooms
- 1726 rooms
- 07 rooms
- 08 rooms
- 169+ rooms
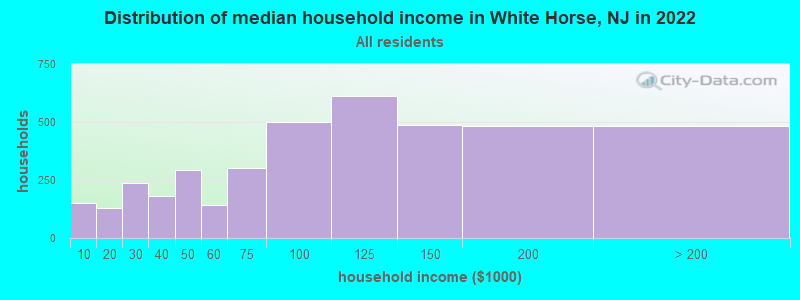
White Horse, NJ household income distribution

- 149Less than $10,000
- 131$10,000 to $19,999
- 235$20,000 to $29,999
- 182$30,000 to $39,999
- 294$40,000 to $49,999
- 144$50,000 to $59,999
- 303$60,000 to $74,999
- 498$75,000 to $99,999
- 610$100,000 to $124,999
- 486$125,000 to $149,999
- 484$150,000 to $199,999
- 483$200,000 or more
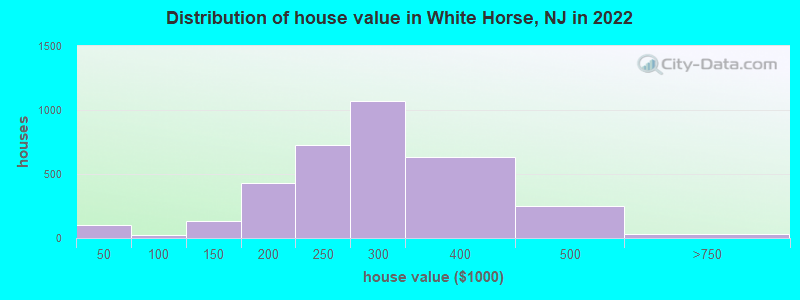
Home value of owner - occupied houses in 2022 in White Horse, NJ
-
- 40Less than $10,000
- 20$15,000 to $19,999
- 20$20,000 to $24,999
- 16$30,000 to $34,999
- 20$90,000 to $99,999
- 24$100,000 to $124,999
- 111$125,000 to $149,999
- 143$150,000 to $174,999
- 282$175,000 to $199,999
- 729$200,000 to $249,999
- 1,072$250,000 to $299,999
- 631$300,000 to $399,999
- 246$400,000 to $499,999
- 33$500,000 to $749,999
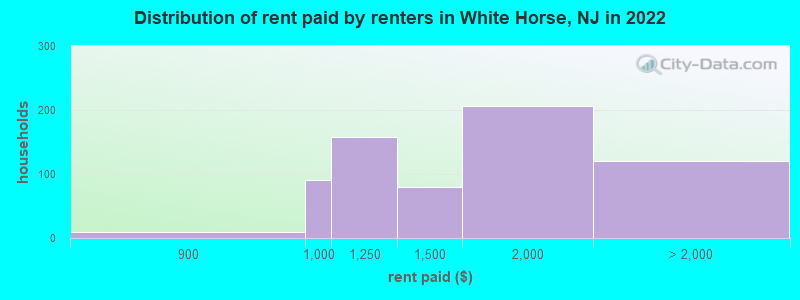
Rent paid by renters in 2022 in White Horse, NJ
-
- 9$800 to $899
- 89$900 to $999
- 158$1,000 to $1,249
- 79$1,250 to $1,499
- 205$1,500 to $1,999
- 51$2,000 to $2,499
- 19$2,500 to $2,999
- 48No cash rent
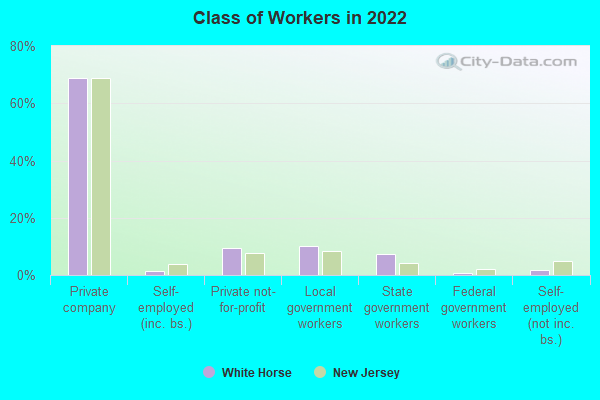
Percentage of workers working in this county: 68.4%
Number of people working at home: 451 (8.7% of all workers)
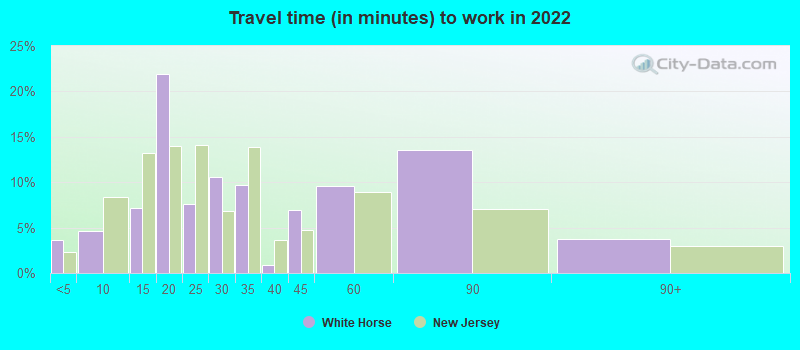
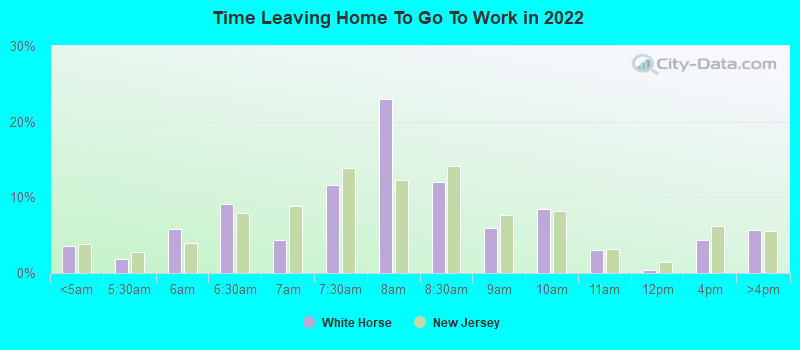
Travel time to work (commute)
- Less than 5 minutes: 41
- 5 to 9 minutes: 217
- 10 to 14 minutes: 884
- 15 to 19 minutes: 542
- 20 to 24 minutes: 755
- 25 to 29 minutes: 184
- 30 to 34 minutes: 693
- 35 to 39 minutes: 107
- 40 to 44 minutes: 404
- 45 to 59 minutes: 423
- 60 to 89 minutes: 351
- 90 or more minutes: 95
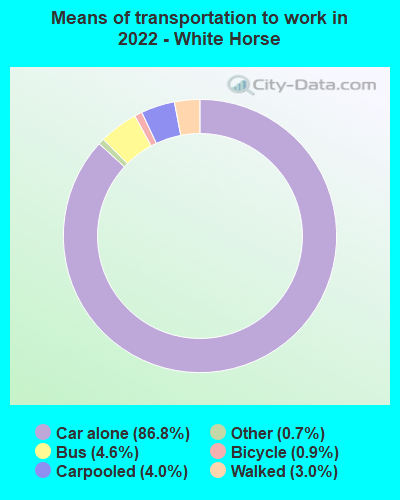
Means of transportation to work:
- Drove a car alone: 1,352 (67.1%)
- Carpooled: 64 (3.2%)
- Bus: 63 (3.1%)
- Taxi: 13 (0.6%)
- Bicycle: 14 (0.7%)
- Walked: 57 (2.8%)
- Worked at home: 451 (22.4%)
- Unemployment by race in 2022
- Unemployment rate for White non-Hispanic residents
- 1.5%Males
- 0.9%Females
- Unemployment rate for Black residents
- 40.2%Males
- Unemployment rate for other race residents
- 6.1%Males
- Unemployment rate for two or more race residents
- 4.6%Males
- Unemployment rate for Hispanic or Latino residents
- 9.0%Males
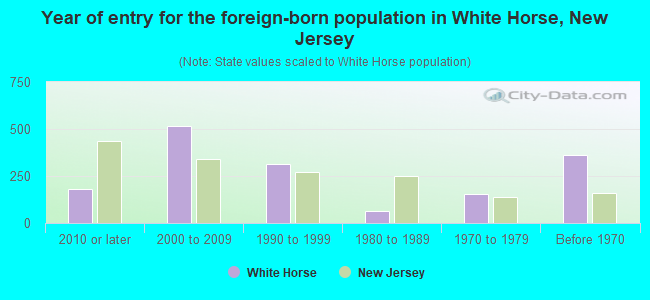
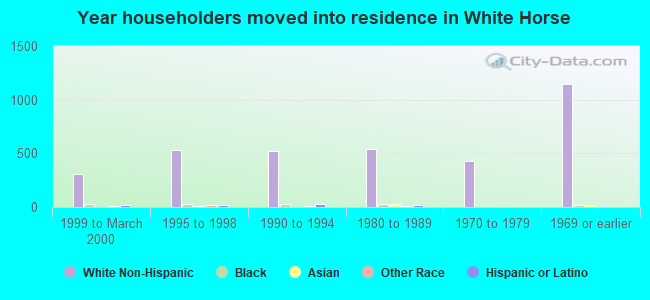
- Year of entry for the foreign-born population in White Horse, New Jersey
- 1832010 or later
- 5142000 to 2009
- 3131990 to 1999
- 641980 to 1989
- 1551970 to 1979
- 363Before 1970
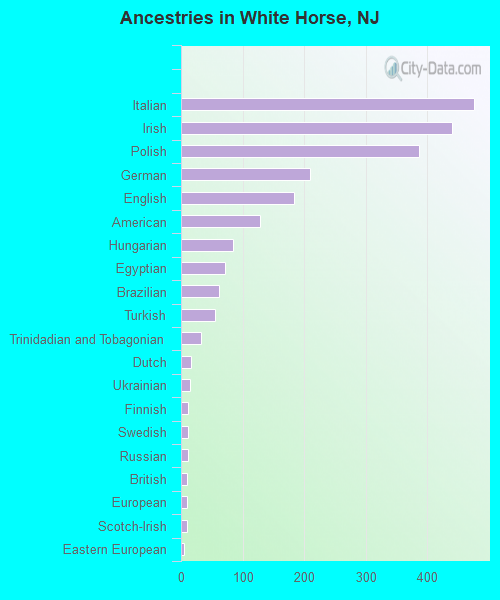
First ancestries reported:
- Italian: 476 (11.3%)
- Irish: 440 (10.5%)
- Polish: 387 (9.2%)
- German: 210 (5.0%)
- English: 184 (4.4%)
- American: 129 (3.1%)
- Hungarian: 84 (2.0%)
- Egyptian: 71 (1.7%)
- Brazilian: 61 (1.4%)
- Turkish: 55 (1.3%)
- Trinidadian and Tobagonian: 32 (0.8%)
- Dutch: 17 (0.4%)
- Ukrainian: 15 (0.4%)
- Finnish: 12 (0.3%)
- Swedish: 12 (0.3%)
- Russian: 11 (0.3%)
- British: 10 (0.2%)
- European: 9 (0.2%)
- Scotch-Irish: 9 (0.2%)
- Eastern European: 5 (0.1%)
Most common places of birth for foreign-born residents (%):
| White Horse: | 27.5% (408) |
| New Jersey: | 2.2% (46,813) |
| White Horse: | 15.2% (225) |
| New Jersey: | 4.4% (95,275) |
| White Horse: | 8.4% (125) |
| New Jersey: | 4.8% (102,527) |
| White Horse: | 6.5% (97) |
| New Jersey: | 2.7% (58,563) |
| White Horse: | 5.8% (86) |
| New Jersey: | 4.0% (85,934) |
| White Horse: | 5.1% (76) |
| New Jersey: | 2.3% (48,811) |
| White Horse: | 4.2% (63) |
| New Jersey: | 2.3% (48,885) |
| White Horse: | 4.0% (59) |
| New Jersey: | 0.8% (16,778) |
| White Horse: | 3.5% (52) |
| New Jersey: | 2.1% (46,020) |
| White Horse: | 3.2% (48) |
| New Jersey: | 0.7% (15,644) |
| White Horse: | 2.7% (40) |
| New Jersey: | 1.6% (33,678) |
| White Horse: | 2.4% (35) |
| New Jersey: | 4.2% (90,817) |
| White Horse: | 2.3% (34) |
| New Jersey: | 0.4% (8,146) |
| White Horse: | 2.2% (33) |
| New Jersey: | 0.8% (17,217) |
| White Horse: | 2.2% (32) |
| New Jersey: | 0.7% (15,533) |
| White Horse: | 1.9% (28) |
| New Jersey: | 0.6% (12,929) |
Place of birth for U.S.-born residents:
- This state: 5,887
- Other state: 1,429
- Northeast: 1,157
- Midwest: 69
- South: 168
- West: 60
90.4% of White Horse residents lived in the same house 1 years ago.
Out of people who lived in different houses, 42.5% lived in this county.
Out of people who lived in different counties, 70.8% lived in New Jersey.
| White Horse: | 90.4% |
| State average: | 90.4% |
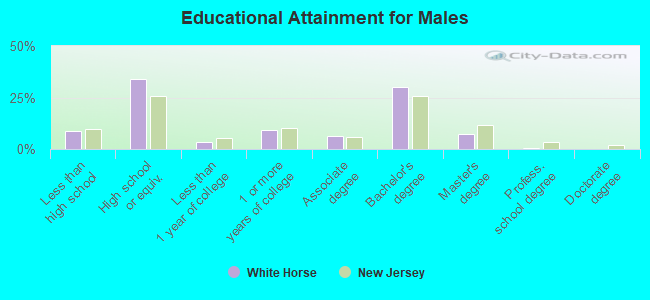
Education attainment for males 25 years and older:
- No schooling: 0
- Nursery to 4th grade: 0
- 5th and 6th grade: 0
- 7th and 8th grade: 84
- 9th grade: 0
- 10th grade: 40
- 11th grade: 90
- 12th grade, no diploma: 101
- High school graduate (or equivalency): 1,195
- Less than 1 year of college: 125
- Some college more than 1 year, no degree: 330
- Associate degree: 219
- Bachelor's degree: 1,057
- Master's degree: 260
- Professional school degree: 12
- Doctorate degree: 8
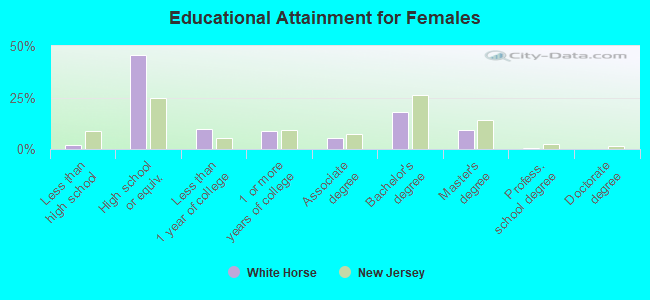
Education attainment for females 25 years and older:
- No schooling: 12
- Nursery to 4th grade: 0
- 5th and 6th grade: 0
- 7th and 8th grade: 0
- 9th grade: 0
- 10th grade: 9
- 11th grade: 0
- 12th grade, no diploma: 44
- High school graduate (or equivalency): 1,728
- Less than 1 year of college: 369
- Some college more than 1 year, no degree: 335
- Associate degree: 208
- Bachelor's degree: 683
- Master's degree: 355
- Professional school degree: 27
- Doctorate degree: 0
Housing units in structures:
- One, detached: 3,390
- One, attached: 213
- Two: 117
- 3 or 4: 37
- 5 to 9: 12
- 10 to 19: 193
- 20 to 49: 32
- Mobile homes: 11
Housing units lacking complete kitchen facilities in 2022: 2.5%
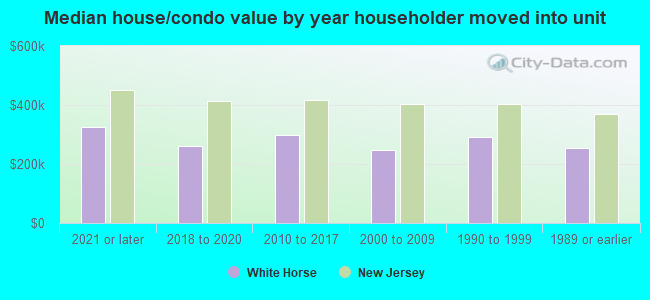
House/condo owner moved in on average 16 years ago
Renter moved in on average 6 years ago
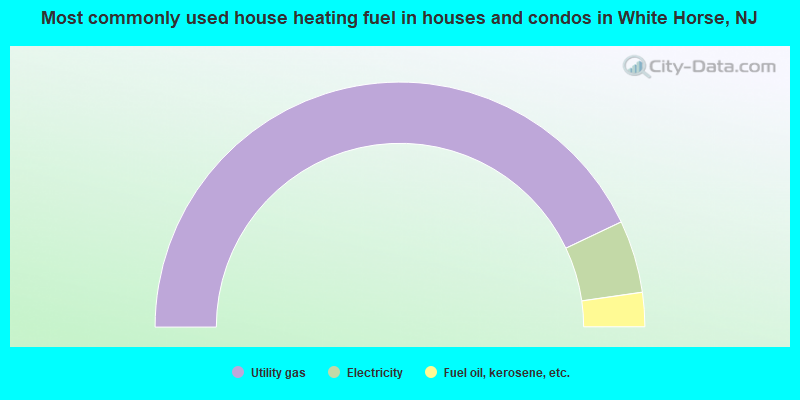
- 85.8%Utility gas
- 9.6%Electricity
- 4.5%Fuel oil, kerosene, etc.
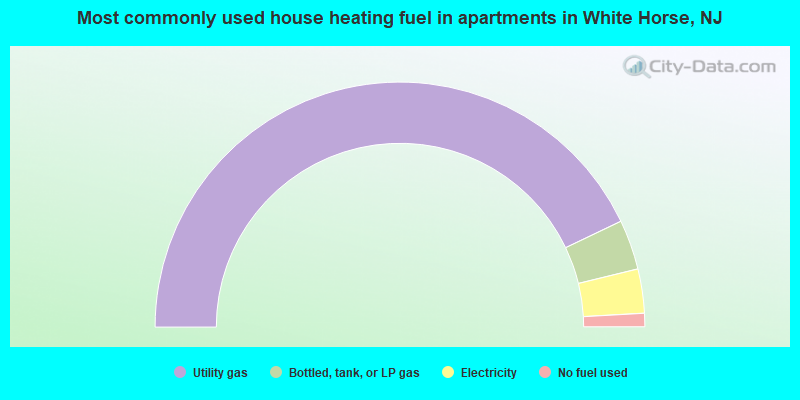
- 85.9%Utility gas
- 6.6%Bottled, tank, or LP gas
- 5.8%Electricity
- 1.8%No fuel used
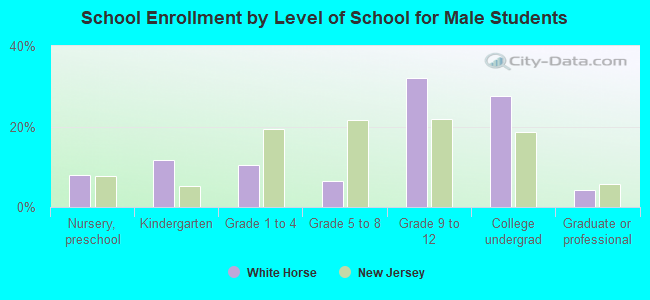
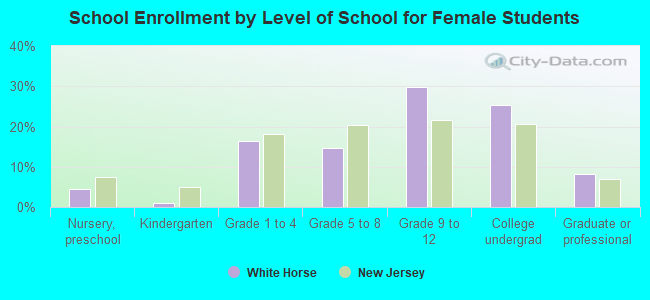
Private vs. public school enrollment:
| Here: | 14.7% |
| New Jersey: | 12.3% |
| Here: | 0.0% |
| New Jersey: | 13.1% |
| Here: | 8.4% |
| New Jersey: | 33.2% |