Willapa Valley, WA (Washington) Houses and Residents
| Willapa Valley: | $351,510 |
| Washington: | $569,500 |
Total population: 1,644 (Urban population: 0, Rural population: 1,601 (98 farm, 1,503 nonfarm))
Houses: 690 (631 occupied: 529 owner occupied, 102 renter occupied)
| % of renters here: | 16% |
| State: | 36% |
Housing density: 3 houses/condos per square mile
Median price asked for vacant for-sale houses and condos in 2022 in this county: $207,142.
Median contract rent in 2022: $828 (lower quartile is $566, upper quartile is $948)
Median rent asked for vacant for-rent units in 2022: $619
Median gross rent in Willapa Valley, WA in 2022: $1,036
Housing units in Willapa Valley with a mortgage: 188 (33 second mortgage, 9 home equity loan, 0 both second mortgage and home equity loan)
Houses without a mortgage: 119


Household type by relationship:
Households: 20,628- In family households: 16,071 (4,230 male householders, 1,477 female householders)
4,525 spouses, 4,303 children (3,836 natural, 190 adopted, 277 stepchildren), 373 grandchildren, 134 brothers or sisters, 153 parents, foster children, 184 other relatives, 558 non-relatives
- In nonfamily households: 4,557 (1,881 male householders (1,482 living alone)), 1,911 female householders (1,650 living alone)), 765 nonrelatives
- In group quarters: 292 (173 institutionalized population)
2,805 married couples with children.
1,099 single-parent households (311 men, 788 women).
94.9% of residents of Willapa Valley speak English at home.
2.9% of residents speak Spanish at home (39% speak English very well, 14% speak English well, 27% speak English not well, 20% don't speak English at all).
1.9% of residents speak other Indo-European language at home (100% speak English very well).
0.3% of residents speak Asian or Pacific Island language at home (100% speak English very well).
Foreign born population: 65 (3.3%)
(21.5% of them are naturalized citizens)
| Here: | 5.3 |
| State: | 6.5 |
| Here: | 5.9 |
| State: | 3.9 |

- Bedrooms in owner-occupied houses and condos in Willapa Valley, Washington
- 10no bedroom
- 221 bedroom
- 1202 bedrooms
- 2693 bedrooms
- 994 bedrooms
- 95+ bedrooms

- Bedrooms in renter-occupied apartments in Willapa Valley, Washington
- 11no bedroom
- 151 bedroom
- 172 bedrooms
- 363 bedrooms
- 234 bedrooms
- 05+ bedrooms

- Cars and other vehicles available in Willapa Valley in owner-occupied houses/condos
- 33no vehicle
- 851 vehicle
- 2242 vehicles
- 1073 vehicles
- 464 vehicles
- 345+ vehicles

- Cars and other vehicles available in Willapa Valley in renter-occupied apartments
- 10no vehicle
- 491 vehicle
- 332 vehicles
- 103 vehicles
- 04 vehicles
- 05+ vehicles

- Rooms in owner-occupied houses in Willapa Valley, Washington
- 01 room
- 222 rooms
- 173 rooms
- 474 rooms
- 1295 rooms
- 1296 rooms
- 887 rooms
- 488 rooms
- 499+ rooms

- Rooms in renter-occupied apartments in Willapa Valley, Washington
- 111 room
- 52 rooms
- 93 rooms
- 114 rooms
- 225 rooms
- 136 rooms
- 117 rooms
- 58 rooms
- 159+ rooms


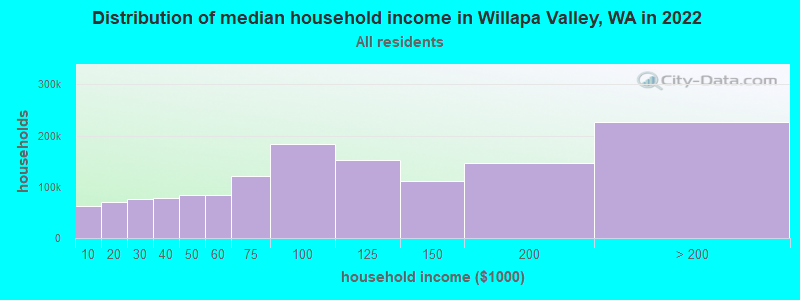
Willapa Valley, WA household income distribution

- 17,717Less than $10,000
- 24,909$10,000 to $19,999
- 27,239$20,000 to $29,999
- 26,068$30,000 to $39,999
- 30,659$40,000 to $49,999
- 26,716$50,000 to $59,999
- 38,351$60,000 to $74,999
- 59,643$75,000 to $99,999
- 50,693$100,000 to $124,999
- 36,861$125,000 to $149,999
- 48,232$150,000 to $199,999
- 58,244$200,000 or more
Percentage of workers working in this county: 79.4%
Number of people working at home: 137 (15.8% of all workers)
Travel time to work (commute)
- Less than 5 minutes: 17
- 5 to 9 minutes: 42
- 10 to 14 minutes: 123
- 15 to 19 minutes: 135
- 20 to 24 minutes: 158
- 25 to 29 minutes: 14
- 30 to 34 minutes: 25
- 35 to 39 minutes: 5
- 40 to 44 minutes: 32
- 45 to 59 minutes: 43
- 60 to 89 minutes: 62
- 90 or more minutes: 35
Means of transportation to work:
- Drove a car alone: 578 (80.3%)
- Carpooled: 77 (10.7%)
- Subway or elevated: 10 (1.4%)
- Motorcycle: 5 (0.7%)
- Other means: 21 (2.9%)
- Worked at home: 29 (4.0%)


- Year of entry for the foreign-born population in Willapa Valley, Washington
- 171995 to March 2000
- 31990 to 1994
- 71985 to 1989
- 01980 to 1984
- 41975 to 1979
- 01970 to 1974
- 41965 to 1969
- 4Before 1965
Most common places of birth for foreign-born residents (%):
| Willapa Valley: | 69.2% (27) |
| Washington: | 24.1% (148,115) |
| Willapa Valley: | 10.3% (4) |
| Washington: | 3.3% (20,321) |
| Willapa Valley: | 10.3% (4) |
| Washington: | 2.8% (16,936) |
| Willapa Valley: | 10.3% (4) |
| Washington: | 0.4% (2,329) |
Place of birth for U.S.-born residents:
- This state: 1,141
- Other state: 417
- Northeast: 29
- Midwest: 160
- South: 59
- West: 169
68% of Willapa Valley residents lived in the same house 5 years ago.
Out of people who lived in different houses, 74% lived in this county.
Out of people who lived in different counties, 67% lived in Washington.
Education attainment for males 25 years and older:
- No schooling: 0
- Nursery to 4th grade: 0
- 5th and 6th grade: 0
- 7th and 8th grade: 26
- 9th grade: 17
- 10th grade: 24
- 11th grade: 9
- 12th grade, no diploma: 23
- High school graduate (or equivalency): 235
- Less than 1 year of college: 44
- Some college more than 1 year, no degree: 73
- Associate degree: 58
- Bachelor's degree: 43
- Master's degree: 12
- Professional school degree: 4
- Doctorate degree: 4

Education attainment for females 25 years and older:
- No schooling: 0
- Nursery to 4th grade: 0
- 5th and 6th grade: 0
- 7th and 8th grade: 28
- 9th grade: 22
- 10th grade: 10
- 11th grade: 17
- 12th grade, no diploma: 26
- High school graduate (or equivalency): 200
- Less than 1 year of college: 57
- Some college more than 1 year, no degree: 62
- Associate degree: 55
- Bachelor's degree: 51
- Master's degree: 16
- Professional school degree: 0
- Doctorate degree: 0


Housing units in structures:
- One, detached: 551
- Mobile homes: 118
- Boats, RVs, vans, etc.: 21
Median worth of mobile homes: $244,770
Housing units lacking complete kitchen facilities: 4.3%

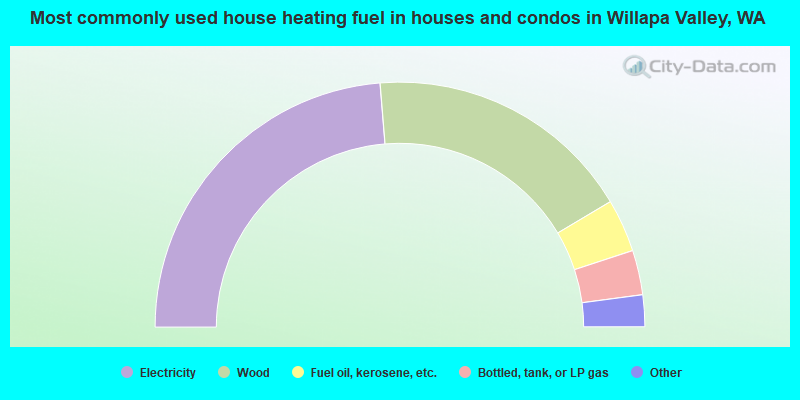
- 47.4%Electricity
- 35.5%Wood
- 7.0%Fuel oil, kerosene, etc.
- 5.9%Bottled, tank, or LP gas
- 2.5%Other fuel
- 1.7%No fuel used
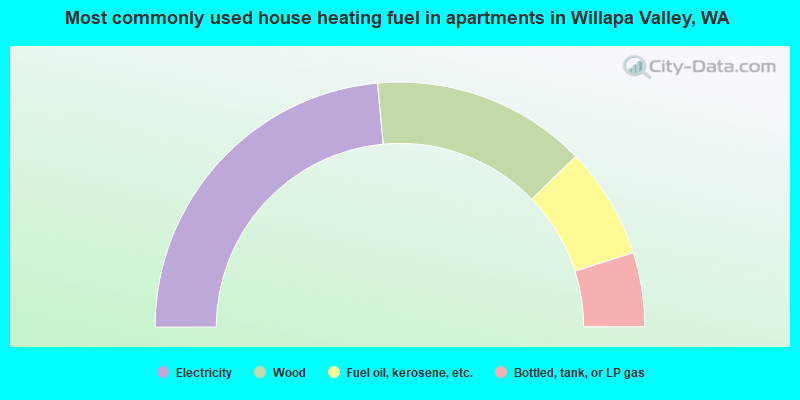
- 47.1%Electricity
- 28.4%Wood
- 14.7%Fuel oil, kerosene, etc.
- 9.8%Bottled, tank, or LP gas
Private vs. public school enrollment:
| Here: | 0.0% |
| Washington: | 9.2% |
| Here: | 3.7% |
| Washington: | 7.0% |
| Here: | 0.0% |
| Washington: | 15.7% |


