Willow Grove, PA (Pennsylvania) Houses and Residents
| Willow Grove: | $327,195 |
| Pennsylvania: | $245,500 |
Mean price in 2022:
Detached houses: $354,486
Here: $354,486 State: $317,202 Townhouses or other attached units: $245,634
Here: $245,634 State: $254,369 In 2-unit structures: $282,568
Here: $282,568 State: $249,182 In 5-or-more-unit structures: $185,567
Here: $185,567 State: $320,068
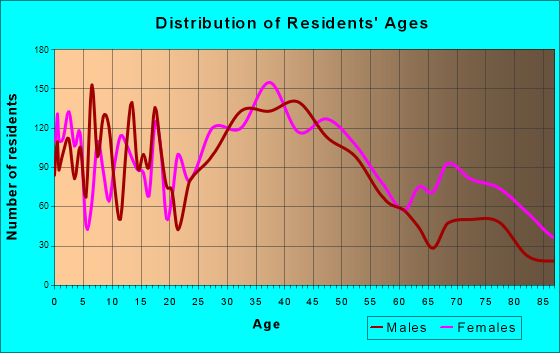
Total population: 15,726 (All urban)
Houses: 5,862 (5,415 occupied: 3,798 owner occupied, 1,652 renter occupied)
| % of renters here: | 30% |
| State: | 31% |
Housing density: 1,620 houses/condos per square mile
Median price asked for vacant for-sale houses and condos in 2022: $179,021.
Median contract rent in 2022: $1,418 (lower quartile is $1,109, upper quartile is $1,807)
Median rent asked for vacant for-rent units in 2022: $1,853
Median gross rent in Willow Grove, PA in 2022: $1,673
Housing units in Willow Grove with a mortgage: 2,485 (426 second mortgage, 9 home equity loan, 356 both second mortgage and home equity loan)
Houses without a mortgage: 130
Median household income for houses/condos with a mortgage: $112,940
Median household income for apartments without a mortgage: $106,546
Median monthly housing costs: $1,637
Compare current foreclosures near Willow Grove, PA:
| Photo | Address | Area | Beds / Baths | Price | Details |
|---|---|---|---|---|---|

|
#1
Carnation Ave
Willow Grove, PA 19090
|
1,200 sq. feet
|
1 baths 3 beds |
show details | |

|
#2
Old Welsh Rd
Willow Grove, PA 19090
|
1,616 sq. feet
|
2 baths 4 beds |
show details | |

|
#3
Madison Rd
Willow Grove, PA 19090
|
2,956 sq. feet
|
2 baths 4 beds |
show details | |

|
#4
School House Ln
Willow Grove, PA 19090
|
1,080 sq. feet
|
1 baths 3 beds |
show details | |

|
#5
High Ave
Willow Grove, PA 19090
|
1,976 sq. feet
|
2 baths 3 beds |
show details | |

|
#6
Arnold Ave
Willow Grove, PA 19090
|
2,791 sq. feet
|
2 baths 4 beds |
show details | |

|
#7
Blair Mill Rd
Willow Grove, PA 19090
|
1,064 sq. feet
|
1 baths 3 beds |
show details | |

|
#8
High Ave
Willow Grove, PA 19090
|
1,976 sq. feet
|
2 baths 3 beds |
show details | |

|
#9
Cowbell Rd
Willow Grove, PA 19090
|
2,080 sq. feet
|
1 baths 4 beds |
show details | |

|
#10
Madison Rd
Willow Grove, PA 19090
|
2,956 sq. feet
|
2 baths 4 beds |
show details |
| Photo | Address | Area | Beds / Baths | Price | Details |
|---|---|---|---|---|---|

|
#11
Phipps Ave
Willow Grove, PA 19090
|
1,432 sq. feet
|
2 baths 3 beds |
show details | |

|
#12
Welsh Rd
Willow Grove, PA 19090
|
2,436 sq. feet
|
2 baths 4 beds |
show details | |

|
#13
Coolidge Ave
Willow Grove, PA 19090
|
1,417 sq. feet
|
1 baths 3 beds |
show details | |

|
#14
Summit Ave
Willow Grove, PA 19090
|
1,568 sq. feet
|
2 baths 4 beds |
show details | |

|
#15
Ellis Rd
Willow Grove, PA 19090
|
1,191 sq. feet
|
2 baths 3 beds |
show details | |

|
#16
Gilpin Rd
Willow Grove, PA 19090
|
1,560 sq. feet
|
1 baths 3 beds |
show details | |

|
#17
Park Ave
Willow Grove, PA 19090
|
1,712 sq. feet
|
1 baths 3 beds |
show details | |

|
#18
Phipps Ave
Willow Grove, PA 19090
|
1,391 sq. feet
|
1 baths 3 beds |
show details | |

|
#19
Silver Ave
Willow Grove, PA 19090
|
- sq. feet
|
- baths - beds |
show details | |

|
#20
W Moreland Rd Apt F313
Willow Grove, PA 19090
|
- sq. feet
|
- baths - beds |
show details |
| Photo | Address | Area | Beds / Baths | Price | Details |
|---|---|---|---|---|---|

|
#21
Old Welsh Rd
Willow Grove, PA 19090
|
- sq. feet
|
- baths - beds |
show details | |

|
#22
Washington Ave
Willow Grove, PA 19090
|
- sq. feet
|
- baths - beds |
show details | |

|
#23
York Rd # 100-11
Willow Grove, PA 19090
|
- sq. feet
|
- baths - beds |
show details | |

|
#24
York Rd # 2
Willow Grove, PA 19090
|
- sq. feet
|
- baths - beds |
show details | |

|
#25
Manchester Rd
Elkins Park, PA 19027
|
3,444 sq. feet
|
2 baths 3 beds |
$570,000
|
show details |

|
#26
Christian St
Philadelphia, PA 19146
|
1,612 sq. feet
|
2 baths 5 beds |
$449,900
|
show details |

|
#27
Brendon Knls
Doylestown, PA 18902
|
2,676 sq. feet
|
2 baths 3 beds |
$520,000
|
show details |

|
#28
N Cedar St
Bristol, PA 19007
|
841 sq. feet
|
1 baths 1 beds |
$307,500
|
show details |

|
#29
Kershaw St
Philadelphia, PA 19131
|
1,284 sq. feet
|
1 baths 3 beds |
$139,900
|
show details |

|
#30
Harvey Ave
Pennsauken, NJ 08110
|
1,555 sq. feet
|
2 baths 4 beds |
$429,900
|
show details |
| Photo | Address | Area | Beds / Baths | Price | Details |
|---|---|---|---|---|---|

|
#31
N 10th St
Philadelphia, PA 19141
|
1,154 sq. feet
|
2 baths 2 beds |
$78,000
|
show details |

|
#32
Princeton Ave
Philadelphia, PA 19149
|
1,224 sq. feet
|
1 baths 3 beds |
$215,000
|
show details |

|
#33
Browning Rd
Merchantville, NJ 08109
|
2,376 sq. feet
|
3 baths 5 beds |
$489,900
|
show details |

|
#34
Harmer St
Philadelphia, PA 19131
|
1,134 sq. feet
|
1 baths 3 beds |
$70,000
|
show details |

|
#35
Jessamine Ave
Oaklyn, NJ 08107
|
864 sq. feet
|
2 baths 5 beds |
$399,900
|
show details |

|
#36
N 5th St
Philadelphia, PA 19126
|
1,420 sq. feet
|
2 baths 3 beds |
$313,900
|
show details |

|
#37
Foxglove Dr
Riverside, NJ 08075
|
840 sq. feet
|
1 baths 2 beds |
$113,683
|
show details |

|
#38
S 8th St
Philadelphia, PA 19148
|
1,170 sq. feet
|
1 baths 3 beds |
$178,500
|
show details |

|
#39
W Oakdale Street
Philadelphia, PA 19132
|
1,152 sq. feet
|
2 baths 3 beds |
$108,900
|
show details |

|
#40
N Forklanding Rd
Maple Shade, NJ 08052
|
1,450 sq. feet
|
1 baths 3 beds |
$259,900
|
show details |
| Photo | Address | Area | Beds / Baths | Price | Details |
|---|---|---|---|---|---|

|
#41
S Alden St
Philadelphia, PA 19143
|
1,185 sq. feet
|
1 baths 3 beds |
$74,900
|
show details |

|
#42
N Front St Apt B
Philadelphia, PA 19123
|
2,491 sq. feet
|
2 baths 3 beds |
$659,500
|
show details |

|
#43
Yeadon Ave
Lansdowne, PA 19050
|
1,388 sq. feet
|
1 baths 3 beds |
$273,000
|
show details |

|
#44
Bartram Rd
Willow Grove, PA 19090
|
- sq. feet
|
- baths - beds |
show details | |

|
#45
Davisville Rd # 1
Willow Grove, PA 19090
|
- sq. feet
|
- baths - beds |
show details | |

|
#46
Limekiln Pike
Philadelphia, PA 19150
|
1,260 sq. feet
|
2 baths 3 beds |
$17,100
|
show details |

|
#47
Jackson St
Philadelphia, PA 19136
|
1,152 sq. feet
|
1 baths 3 beds |
$111,135
|
show details |

|
#48
Roseberry St
Philadelphia, PA 19148
|
994 sq. feet
|
1 baths 3 beds |
$132,953
|
show details |

|
#49
N Wanamaker St
Philadelphia, PA 19131
|
1,212 sq. feet
|
1 baths 3 beds |
$66,018
|
show details |

|
Check over 1 million property listings on Foreclosure.com!
|
browse all offers | |||


 | Before Purchasing a Home - Philly Suburbs (14 replies) |
| Temporary Housing In Between Moves (9 replies) |
| Advice for a first-time homebuyer in this market? (13 replies) |
| Willow Grove/Jenkintown looking for advice (10 replies) |
| Best Suburb with homes under 300K in area (82 replies) |
| Philadelphia 2035 (9298 replies) |
Median year apartment built: 1967
Household type by relationship:
Households: 13,892- Male householders: 2,550 (753 living alone), Female householders: 2,862 (785 living alone)
2,774 spouses (2,762 opposite-sex spouses), 274 unmarried partners, (274 opposite-sex unmarried partners), 4,450 children (4,240 natural, 128 adopted, 81 stepchildren), 152 grandchildren, 74 brothers or sisters, 191 parents, 0 foster children, 80 other relatives, 210 non-relatives
- In group quarters: 269
Size of family households: 1,355 2-persons, 1,016 3-persons, 745 4-persons, 382 5-persons, 75 6-persons, 7 7-or-more-persons.
Size of nonfamily households: 1,584 1-person, 240 2-persons, 28 3-persons.
2,335 married couples with children.
574 single-parent households (130 men, 444 women).
88.8% of residents of Willow Grove speak English at home.
1.4% of residents speak Spanish at home (96% speak English very well, 1% speak English well, 3% speak English not well).
4.4% of residents speak other Indo-European language at home (79% speak English very well, 13% speak English well, 6% speak English not well, 2% don't speak English at all).
4.3% of residents speak Asian or Pacific Island language at home (52% speak English very well, 21% speak English well, 22% speak English not well, 5% don't speak English at all).
0.4% of residents speak other language at home (48% speak English very well, 20% speak English well, 33% speak English not well).
Foreign born population: 1,122 (8.1%)
(68.6% of them are naturalized citizens)
| Here: | 6.9 |
| State: | 6.8 |
| Here: | 4.3 |
| State: | 4.3 |

- Bedrooms in owner-occupied houses and condos in Willow Grove, Pennsylvania
- 24no bedroom
- 271 bedroom
- 4952 bedrooms
- 2,3213 bedrooms
- 8184 bedrooms
- 1135+ bedrooms

- Bedrooms in renter-occupied apartments in Willow Grove, Pennsylvania
- 39no bedroom
- 4701 bedroom
- 8502 bedrooms
- 2173 bedrooms
- 514 bedrooms
- 265+ bedrooms

- Cars and other vehicles available in Willow Grove in owner-occupied houses/condos
- 0no vehicle
- 1,2391 vehicle
- 1,7532 vehicles
- 5323 vehicles
- 1234 vehicles
- 1525+ vehicles

- Cars and other vehicles available in Willow Grove in renter-occupied apartments
- 162no vehicle
- 7861 vehicle
- 5992 vehicles
- 493 vehicles
- 574 vehicles
- 05+ vehicles

- Rooms in owner-occupied houses in Willow Grove, Pennsylvania
- 241 room
- 02 rooms
- 113 rooms
- 2024 rooms
- 4355 rooms
- 9886 rooms
- 8357 rooms
- 5398 rooms
- 7649+ rooms

- Rooms in renter-occupied apartments in Willow Grove, Pennsylvania
- 391 room
- 672 rooms
- 2473 rooms
- 5744 rooms
- 4535 rooms
- 1816 rooms
- 427 rooms
- 138 rooms
- 369+ rooms


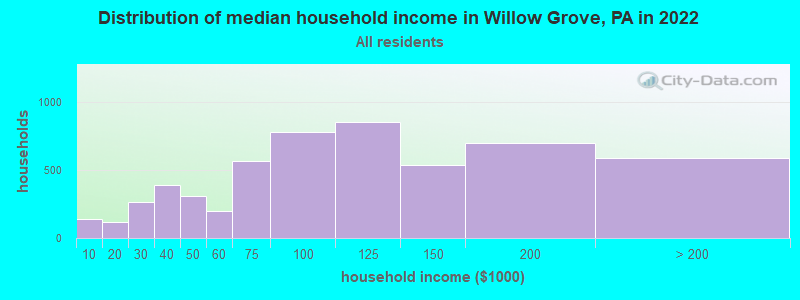
Willow Grove, PA household income distribution

- 142Less than $10,000
- 118$10,000 to $19,999
- 268$20,000 to $29,999
- 391$30,000 to $39,999
- 306$40,000 to $49,999
- 199$50,000 to $59,999
- 564$60,000 to $74,999
- 778$75,000 to $99,999
- 852$100,000 to $124,999
- 536$125,000 to $149,999
- 696$150,000 to $199,999
- 584$200,000 or more
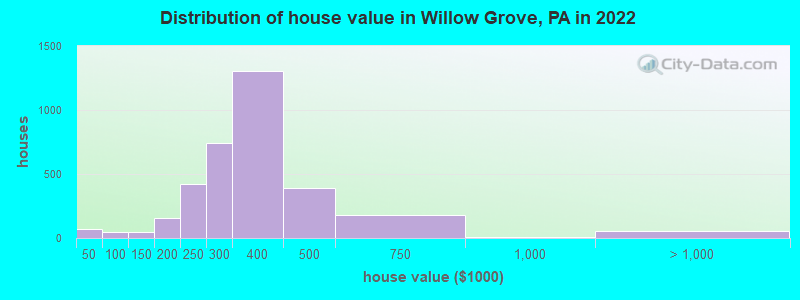
Home value of owner - occupied houses in 2022 in Willow Grove, PA
-
- 26Less than $10,000
- 12$25,000 to $29,999
- 20$30,000 to $34,999
- 7$40,000 to $49,999
- 38$90,000 to $99,999
- 19$100,000 to $124,999
- 26$125,000 to $149,999
- 101$150,000 to $174,999
- 57$175,000 to $199,999
- 423$200,000 to $249,999
- 745$250,000 to $299,999
- 1,304$300,000 to $399,999
- 387$400,000 to $499,999
- 179$500,000 to $749,999
- 6$750,000 to $999,999
- 16$1,000,000 to $1,499,999
- 37$2,000,000 or more
Rent paid by renters in 2022 in Willow Grove, PA
-
- 32$500 to $549
- 13$750 to $799
- 88$800 to $899
- 73$900 to $999
- 360$1,000 to $1,249
- 352$1,250 to $1,499
- 488$1,500 to $1,999
- 132$2,000 to $2,499
- 55$2,500 to $2,999
- 42$3,500 or more


Percentage of workers working in this county: 71.3%
Number of people working at home: 1,727 (23.3% of all workers)
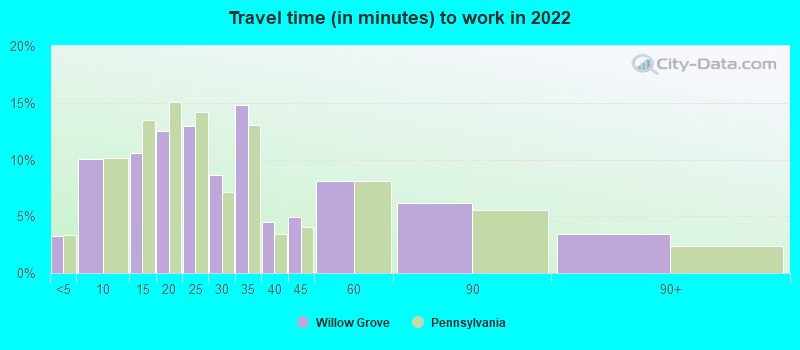
Travel time to work (commute)
- Less than 5 minutes: 242
- 5 to 9 minutes: 624
- 10 to 14 minutes: 779
- 15 to 19 minutes: 915
- 20 to 24 minutes: 532
- 25 to 29 minutes: 329
- 30 to 34 minutes: 645
- 35 to 39 minutes: 223
- 40 to 44 minutes: 267
- 45 to 59 minutes: 669
- 60 to 89 minutes: 350
- 90 or more minutes: 99
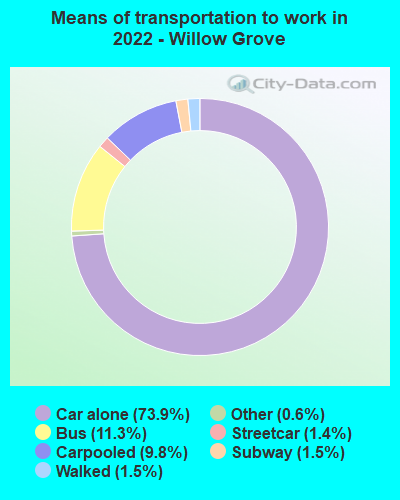
Means of transportation to work:
- Drove a car alone: 4,273 (57.5%)
- Carpooled: 590 (7.9%)
- Bus: 416 (5.6%)
- Subway or elevated rail: 71 (1.0%)
- Long-distance train or commuter rail: 69 (0.9%)
- Taxi: 47 (0.6%)
- Walked: 88 (1.2%)
- Worked at home: 1,727 (23.2%)

- Unemployment by race in 2022
- Unemployment rate for White non-Hispanic residents
- 2.3%Males
- 1.2%Females
- Unemployment rate for Black residents
- 1.6%Females
- Unemployment rate for Asian residents
- 2.7%Females
- Unemployment rate for two or more race residents
- 6.0%Males
- 8.6%Females

- Year of entry for the foreign-born population in Willow Grove, Pennsylvania
- 2962010 or later
- 2122000 to 2009
- 2931990 to 1999
- 1201980 to 1989
- 1981970 to 1979
- 301Before 1970

First ancestries reported:
- Irish: 949 (17.6%)
- American: 519 (9.6%)
- Italian: 490 (9.1%)
- German: 410 (7.6%)
- Polish: 243 (4.5%)
- English: 190 (3.5%)
- Russian: 141 (2.6%)
- Trinidadian and Tobagonian: 137 (2.5%)
- European: 112 (2.1%)
- African: 104 (1.9%)
- Greek: 71 (1.3%)
- Ukrainian: 64 (1.2%)
- Scottish: 61 (1.1%)
- Eastern European: 41 (0.8%)
- Cypriot: 39 (0.7%)
- Romanian: 32 (0.6%)
- Lithuanian: 31 (0.6%)
- Portuguese: 30 (0.6%)
- Pennsylvania German: 28 (0.5%)
- Jamaican: 27 (0.5%)
- Yugoslavian: 23 (0.4%)
- Welsh: 22 (0.4%)
- Norwegian: 19 (0.4%)
- South African: 18 (0.3%)
- British: 17 (0.3%)
- Slovak: 16 (0.3%)
- Latvian: 13 (0.2%)
- Hungarian: 12 (0.2%)
- French: 12 (0.2%)
- Dutch: 10 (0.2%)
- Scotch-Irish: 9 (0.2%)
- Lebanese: 9 (0.2%)
- Swiss: 8 (0.1%)
- French Canadian: 7 (0.1%)
- Austrian: 7 (0.1%)
- Albanian: 6 (0.1%)
- Canadian: 4 (0.07%)
- Scandinavian: 3 (0.06%)
Most common places of birth for foreign-born residents (%):
| Willow Grove: | 11.3% (132) |
| Pennsylvania: | 7.2% (67,704) |
| Willow Grove: | 11.2% (131) |
| Pennsylvania: | 2.9% (27,433) |
| Willow Grove: | 6.2% (73) |
| Pennsylvania: | 3.3% (31,542) |
| Willow Grove: | 6.2% (73) |
| Pennsylvania: | 1.4% (13,077) |
| Willow Grove: | 5.0% (59) |
| Pennsylvania: | 1.1% (10,709) |
| Willow Grove: | 4.7% (55) |
| Pennsylvania: | 0.8% (7,224) |
| Willow Grove: | 4.7% (55) |
| Pennsylvania: | 1.6% (15,272) |
| Willow Grove: | 4.4% (51) |
| Pennsylvania: | 2.1% (19,841) |
| Willow Grove: | 4.4% (51) |
| Pennsylvania: | 0.4% (4,113) |
| Willow Grove: | 4.2% (49) |
| Pennsylvania: | 0.7% (6,855) |
| Willow Grove: | 3.9% (46) |
| Pennsylvania: | 2.2% (21,039) |
| Willow Grove: | 2.6% (30) |
| Pennsylvania: | 1.8% (16,884) |
| Willow Grove: | 2.4% (28) |
| Pennsylvania: | 9.2% (86,544) |
| Willow Grove: | 2.1% (25) |
| Pennsylvania: | 1.0% (9,386) |
| Willow Grove: | 1.9% (22) |
| Pennsylvania: | 10.7% (100,596) |
| Willow Grove: | 1.7% (20) |
| Pennsylvania: | 0.6% (6,036) |
| Willow Grove: | 1.5% (18) |
| Pennsylvania: | 0.1% (600) |
Place of birth for U.S.-born residents:
- This state: 10,523
- Other state: 2,038
- Northeast: 1,148
- Midwest: 302
- South: 506
- West: 75
92.8% of Willow Grove residents lived in the same house 1 years ago.
Out of people who lived in different houses, 27.6% lived in this county.
Out of people who lived in different counties, 89.2% lived in Pennsylvania.
| Willow Grove: | 92.8% |
| State average: | 89.3% |
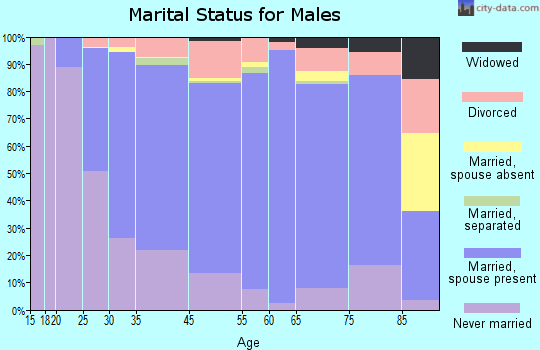
Education attainment for males 25 years and older:
- No schooling: 24
- Nursery to 4th grade: 5
- 5th and 6th grade: 2
- 7th and 8th grade: 0
- 9th grade: 4
- 10th grade: 8
- 11th grade: 14
- 12th grade, no diploma: 67
- High school graduate (or equivalency): 1,243
- Less than 1 year of college: 391
- Some college more than 1 year, no degree: 581
- Associate degree: 438
- Bachelor's degree: 1,062
- Master's degree: 591
- Professional school degree: 172
- Doctorate degree: 20

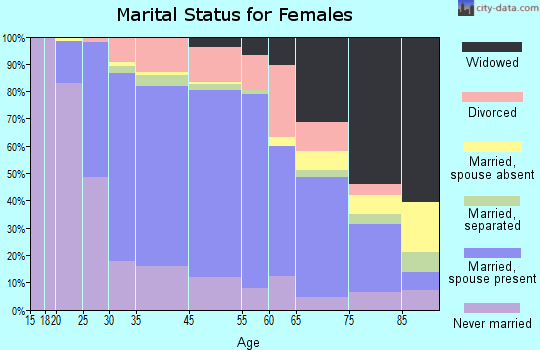
Education attainment for females 25 years and older:
- No schooling: 67
- Nursery to 4th grade: 0
- 5th and 6th grade: 0
- 7th and 8th grade: 30
- 9th grade: 83
- 10th grade: 18
- 11th grade: 34
- 12th grade, no diploma: 22
- High school graduate (or equivalency): 1,272
- Less than 1 year of college: 302
- Some college more than 1 year, no degree: 396
- Associate degree: 464
- Bachelor's degree: 1,497
- Master's degree: 716
- Professional school degree: 55
- Doctorate degree: 48

Housing units in structures:
- One, detached: 3,762
- One, attached: 439
- Two: 403
- 3 or 4: 304
- 5 to 9: 219
- 10 to 19: 116
- 20 to 49: 63
- 50 or more: 554
Housing units lacking complete kitchen facilities in 2022: 2.2%
House/condo owner moved in on average 16 years ago
Renter moved in on average 5 years ago

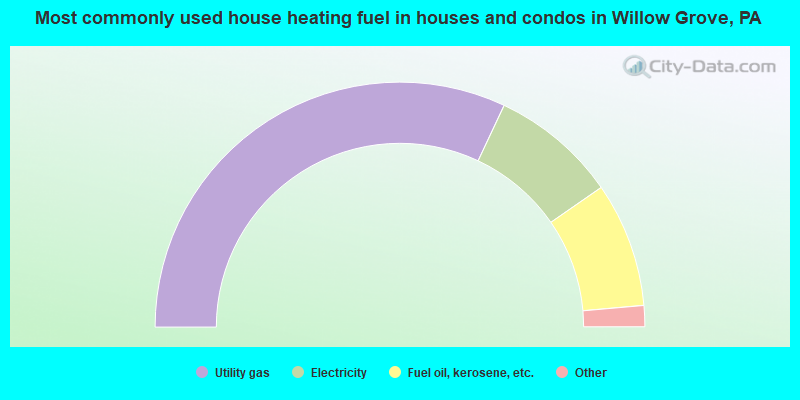
- 64.0%Utility gas
- 16.7%Electricity
- 16.5%Fuel oil, kerosene, etc.
- 1.8%Bottled, tank, or LP gas
- 0.7%Other fuel
- 0.2%Wood
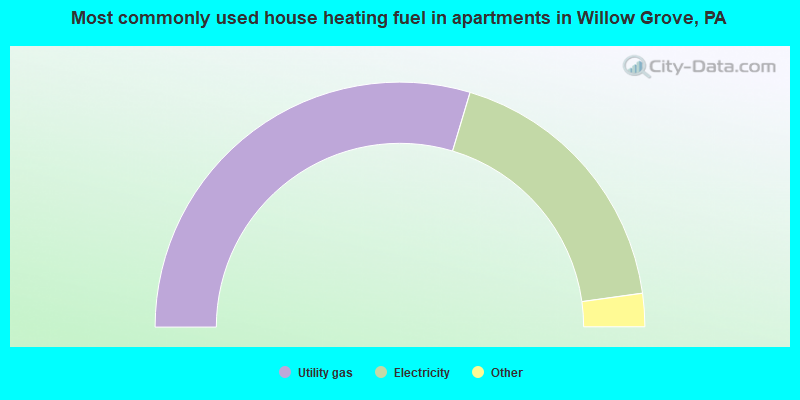
- 59.3%Utility gas
- 36.4%Electricity
- 2.2%Fuel oil, kerosene, etc.
- 1.4%Bottled, tank, or LP gas
- 0.7%No fuel used
Private vs. public school enrollment:
| Here: | 18.8% |
| Pennsylvania: | 15.7% |
| Here: | 20.1% |
| Pennsylvania: | 13.4% |
| Here: | 33.5% |
| Pennsylvania: | 39.8% |


