Willowick, OH (Ohio) Houses and Residents
| Willowick: | $163,240 |
| Ohio: | $204,100 |
Mean price in 2022:
Detached houses: $211,239
Here: $211,239 State: $254,366 Townhouses or other attached units: $275,980
Here: $275,980 State: $225,733 In 2-unit structures: $416,565
Here: $416,565 State: $144,384 In 5-or-more-unit structures: $318,323
Here: $318,323 State: $211,593 Mobile homes: $11,269
Here: $11,269 State: $62,719
Total population: 14,009 (All urban)
Houses: 6,577 (6,312 occupied: 4,828 owner occupied, 1,519 renter occupied)
| % of renters here: | 24% |
| State: | 33% |
Housing density: 2,615 houses/condos per square mile
Median price asked for vacant for-sale houses and condos in 2022: $32,754.
Median contract rent in 2022: $872 (lower quartile is $748, upper quartile is $1,021)
Median rent asked for vacant for-rent units in 2022: $990
Median gross rent in Willowick, OH in 2022: $931
Housing units in Willowick with a mortgage: 2,961 (253 second mortgage, 0 home equity loan, 189 both second mortgage and home equity loan)
Houses without a mortgage: 222
Median household income for houses/condos with a mortgage: $100,270
Median household income for apartments without a mortgage: $52,630
Median monthly housing costs: $982
Compare current foreclosures near Willowick, OH:
| Photo | Address | Area | Beds / Baths | Price | Details |
|---|---|---|---|---|---|

|
#1
E 128th St
Cleveland, OH 44120
|
2,590 sq. feet
|
3 baths 5 beds |
$22,500
|
show details |

|
#2
Arcade Ave
Cleveland, OH 44110
|
2,036 sq. feet
|
2 baths 4 beds |
$6,500
|
show details |

|
#3
E 90th St
Cleveland, OH 44106
|
1,776 sq. feet
|
1 baths 4 beds |
$214,500
|
show details |

|
#4
E 134th St
Cleveland, OH 44105
|
1,549 sq. feet
|
1 baths 3 beds |
$129,900
|
show details |

|
#5
Alton Rd
Wickliffe, OH 44092
|
936 sq. feet
|
1 baths 3 beds |
$159,900
|
show details |

|
#6
Owego St
Painesville, OH 44077
|
1,275 sq. feet
|
2 baths 3 beds |
$184,500
|
show details |

|
#7
E 90th St
Cleveland, OH 44108
|
1,936 sq. feet
|
3 baths 6 beds |
$15,600
|
show details |

|
#8
Wilmington Rd
Cleveland, OH 44121
|
1,278 sq. feet
|
1 baths 3 beds |
$114,900
|
show details |

|
#9
Clearview Rd
Chesterland, OH 44026
|
4,317 sq. feet
|
2 baths 4 beds |
$291,200
|
show details |

|
#10
Wellner Rd
Eastlake, OH 44095
|
1,030 sq. feet
|
2 baths 3 beds |
$194,900
|
show details |
| Photo | Address | Area | Beds / Baths | Price | Details |
|---|---|---|---|---|---|

|
#11
Williams St
Painesville, OH 44077
|
1,064 sq. feet
|
1 baths 3 beds |
$131,250
|
show details |

|
#12
Maryland Ave
Cleveland, OH 44105
|
1,908 sq. feet
|
2 baths 4 beds |
$29,900
|
show details |

|
#13
Pawnee Ave
Cleveland, OH 44119
|
1,884 sq. feet
|
2 baths 4 beds |
show details | |

|
#14
Daleford Rd
Cleveland, OH 44120
|
3,164 sq. feet
|
3 baths 6 beds |
show details | |

|
#15
E 173rd St
Cleveland, OH 44128
|
1,065 sq. feet
|
1 baths 2 beds |
show details | |

|
#16
Grand Blvd
Euclid, OH 44117
|
834 sq. feet
|
1 baths 3 beds |
show details | |

|
#17
Avon Ave
Cleveland, OH 44105
|
1,152 sq. feet
|
1 baths 3 beds |
show details | |

|
#18
Austen Ln
Cleveland, OH 44143
|
2,504 sq. feet
|
3 baths 4 beds |
show details | |

|
#19
Lynnfield Rd
Beachwood, OH 44122
|
3,030 sq. feet
|
3 baths 6 beds |
show details | |

|
#20
Charleston Sq # C17
Cleveland, OH 44143
|
1,068 sq. feet
|
2 baths 2 beds |
show details |
| Photo | Address | Area | Beds / Baths | Price | Details |
|---|---|---|---|---|---|

|
#21
Firwood Rd
Mentor, OH 44060
|
1,553 sq. feet
|
2 baths 3 beds |
show details | |

|
#22
E 154th St
Cleveland, OH 44128
|
1,087 sq. feet
|
1 baths 3 beds |
show details | |

|
#23
Sandusky Ave
Cleveland, OH 44105
|
1,724 sq. feet
|
2 baths 4 beds |
show details | |

|
#24
Banbury Cir Apt 7
Cleveland, OH 44128
|
1,260 sq. feet
|
2 baths 3 beds |
show details | |

|
#25
E 168th St
Cleveland, OH 44110
|
1,302 sq. feet
|
2 baths 3 beds |
show details | |

|
#26
N Taylor Rd
Cleveland, OH 44112
|
1,253 sq. feet
|
2 baths 3 beds |
show details | |

|
#27
Mayfield Rd
Cleveland, OH 44121
|
2,150 sq. feet
|
3 baths 4 beds |
show details | |

|
#28
Milverton Rd
Cleveland, OH 44120
|
1,064 sq. feet
|
1 baths 3 beds |
show details | |

|
#29
Banbury Cir Apt 24
Cleveland, OH 44128
|
1,330 sq. feet
|
2 baths 3 beds |
show details | |

|
#30
E 131st St
Cleveland, OH 44105
|
2,068 sq. feet
|
2 baths 7 beds |
show details |
| Photo | Address | Area | Beds / Baths | Price | Details |
|---|---|---|---|---|---|

|
#31
W High St
Painesville, OH 44077
|
1,813 sq. feet
|
2 baths 3 beds |
show details | |

|
#32
E 147th St
Cleveland, OH 44120
|
1,138 sq. feet
|
1 baths 3 beds |
show details | |

|
#33
Ashwood Rd
Cleveland, OH 44120
|
2,070 sq. feet
|
2 baths 4 beds |
show details | |

|
#34
Bexley Blvd
Cleveland, OH 44121
|
1,437 sq. feet
|
2 baths 3 beds |
show details | |

|
#35
Chillicothe Rd
Chagrin Falls, OH 44022
|
1,587 sq. feet
|
2 baths 3 beds |
show details | |

|
#36
E 178th St
Cleveland, OH 44128
|
1,008 sq. feet
|
1 baths 3 beds |
show details | |

|
#37
E 179th St
Cleveland, OH 44119
|
1,468 sq. feet
|
1 baths 3 beds |
show details | |

|
#38
E 134th St
Cleveland, OH 44112
|
1,208 sq. feet
|
1 baths 3 beds |
show details | |

|
#39
E 175th St
Cleveland, OH 44128
|
888 sq. feet
|
1 baths 3 beds |
show details | |

|
#40
Harms Rd
Cleveland, OH 44143
|
1,277 sq. feet
|
1 baths 3 beds |
show details |
| Photo | Address | Area | Beds / Baths | Price | Details |
|---|---|---|---|---|---|

|
#41
Ashwood Rd
Cleveland, OH 44120
|
2,848 sq. feet
|
3 baths 5 beds |
show details | |

|
#42
E 74th St
Cleveland, OH 44105
|
1,936 sq. feet
|
2 baths 4 beds |
show details | |

|
#43
E 177th St
Cleveland, OH 44119
|
1,382 sq. feet
|
1 baths 3 beds |
show details | |

|
#44
Charlton Rd
Cleveland, OH 44121
|
1,553 sq. feet
|
2 baths 3 beds |
show details | |

|
#45
S Green Rd
Cleveland, OH 44121
|
1,437 sq. feet
|
3 baths 3 beds |
show details | |

|
#46
Winchell Rd
Beachwood, OH 44122
|
1,644 sq. feet
|
3 baths 4 beds |
show details | |

|
#47
Douglas Blvd
Cleveland, OH 44143
|
1,942 sq. feet
|
3 baths 3 beds |
show details | |

|
#48
E 142nd St
Cleveland, OH 44128
|
711 sq. feet
|
1 baths 2 beds |
show details | |

|
#49
Nelson Ave
Cleveland, OH 44105
|
880 sq. feet
|
1 baths 3 beds |
show details | |

|
Check over 1 million property listings on Foreclosure.com!
|
browse all offers | |||

Latest news about housing in Willowick, OH collected exclusively by city-data.com from local newspapers, TV, and radio stations

 | Cleveland's Real Estate Market is driving us crazy. (24 replies) |
| How to retire in Cleveland/NE Ohio CHEAPLY (78 replies) |
| Good apartments in/around Mayfield Heights (3 replies) |
| Eastlake vs Amhurst? please rate and compare... (28 replies) |
| Relocating to Small Town Ohio (37 replies) |
| where to find short-term, furnished, pet-friendly housing for 3 months? (23 replies) |

Median year apartment built: 1968
Household type by relationship:
Households: 14,188- Male householders: 2,909 (1,073 living alone), Female householders: 3,327 (1,230 living alone)
2,702 spouses (2,687 opposite-sex spouses), 446 unmarried partners, (431 opposite-sex unmarried partners), 3,931 children (3,649 natural, 57 adopted, 223 stepchildren), 190 grandchildren, 58 brothers or sisters, 182 parents, 0 foster children, 90 other relatives, 338 non-relatives
- In group quarters: 10
Size of family households: 1,374 2-persons, 871 3-persons, 598 4-persons, 238 5-persons, 142 6-persons, 75 7-or-more-persons.
Size of nonfamily households: 2,489 1-person, 547 2-persons, 37 3-persons, 18 4-persons.
1,901 married couples with children.
539 single-parent households (82 men, 457 women).
94.1% of residents of Willowick speak English at home.
0.9% of residents speak Spanish at home (91% speak English very well, 9% speak English not well).
4.7% of residents speak other Indo-European language at home (73% speak English very well, 20% speak English well, 3% speak English not well, 4% don't speak English at all).
0.1% of residents speak Asian or Pacific Island language at home (47% speak English very well, 53% speak English well).
0.1% of residents speak other language at home (100% speak English very well).
Foreign born population: 365 (2.6%)
(106.3% of them are naturalized citizens)
| Here: | 6.0 |
| State: | 6.7 |
| Here: | 4.7 |
| State: | 4.4 |

- Bedrooms in owner-occupied houses and condos in Willowick, Ohio
- 0no bedroom
- 501 bedroom
- 5132 bedrooms
- 3,4083 bedrooms
- 7164 bedrooms
- 1415+ bedrooms

- Bedrooms in renter-occupied apartments in Willowick, Ohio
- 23no bedroom
- 3701 bedroom
- 5212 bedrooms
- 4643 bedrooms
- 1404 bedrooms
- 05+ bedrooms

- Cars and other vehicles available in Willowick in owner-occupied houses/condos
- 155no vehicle
- 1,5841 vehicle
- 2,2332 vehicles
- 6243 vehicles
- 1684 vehicles
- 645+ vehicles

- Cars and other vehicles available in Willowick in renter-occupied apartments
- 194no vehicle
- 7641 vehicle
- 4302 vehicles
- 1013 vehicles
- 304 vehicles
- 05+ vehicles

- Rooms in owner-occupied houses in Willowick, Ohio
- 01 room
- 102 rooms
- 313 rooms
- 2224 rooms
- 1,0115 rooms
- 1,6306 rooms
- 1,1087 rooms
- 4218 rooms
- 3969+ rooms

- Rooms in renter-occupied apartments in Willowick, Ohio
- 231 room
- 02 rooms
- 3293 rooms
- 3064 rooms
- 3695 rooms
- 3216 rooms
- 1017 rooms
- 298 rooms
- 419+ rooms


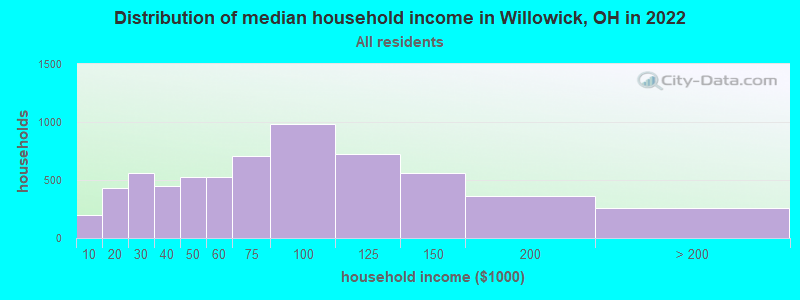
Willowick, OH household income distribution

- 199Less than $10,000
- 429$10,000 to $19,999
- 563$20,000 to $29,999
- 446$30,000 to $39,999
- 524$40,000 to $49,999
- 525$50,000 to $59,999
- 710$60,000 to $74,999
- 979$75,000 to $99,999
- 725$100,000 to $124,999
- 557$125,000 to $149,999
- 365$150,000 to $199,999
- 262$200,000 or more
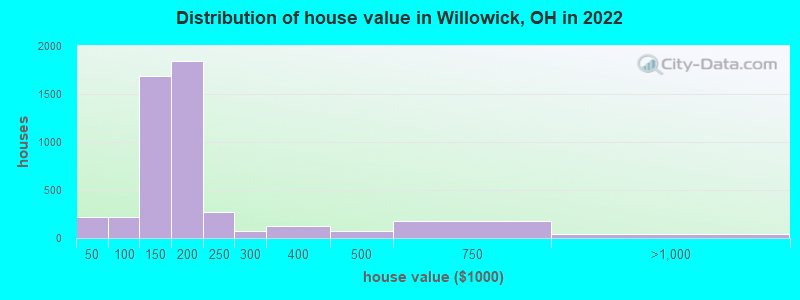
Home value of owner - occupied houses in 2022 in Willowick, OH
-
- 78Less than $10,000
- 35$10,000 to $14,999
- 80$15,000 to $19,999
- 16$20,000 to $24,999
- 8$40,000 to $49,999
- 6$50,000 to $59,999
- 38$60,000 to $69,999
- 26$70,000 to $79,999
- 78$80,000 to $89,999
- 60$90,000 to $99,999
- 692$100,000 to $124,999
- 992$125,000 to $149,999
- 1,497$150,000 to $174,999
- 347$175,000 to $199,999
- 272$200,000 to $249,999
- 68$250,000 to $299,999
- 124$300,000 to $399,999
- 71$400,000 to $499,999
- 178$500,000 to $749,999
- 27$750,000 to $999,999
- 9$1,000,000 to $1,499,999
Rent paid by renters in 2022 in Willowick, OH
-
- 51$150 to $199
- 8$300 to $349
- 19$350 to $399
- 57$400 to $449
- 2$450 to $499
- 35$500 to $549
- 55$650 to $699
- 109$700 to $749
- 94$750 to $799
- 267$800 to $899
- 197$900 to $999
- 205$1,000 to $1,249
- 107$1,250 to $1,499
- 180No cash rent


Percentage of workers working in this county: 61.2%
Number of people working at home: 1,478 (19.5% of all workers)
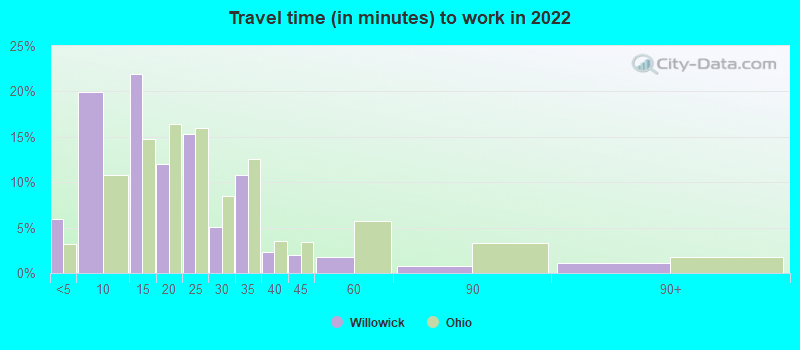
Travel time to work (commute)
- Less than 5 minutes: 183
- 5 to 9 minutes: 765
- 10 to 14 minutes: 827
- 15 to 19 minutes: 970
- 20 to 24 minutes: 1,085
- 25 to 29 minutes: 633
- 30 to 34 minutes: 1,090
- 35 to 39 minutes: 142
- 40 to 44 minutes: 179
- 45 to 59 minutes: 189
- 60 to 89 minutes: 104
- 90 or more minutes: 24
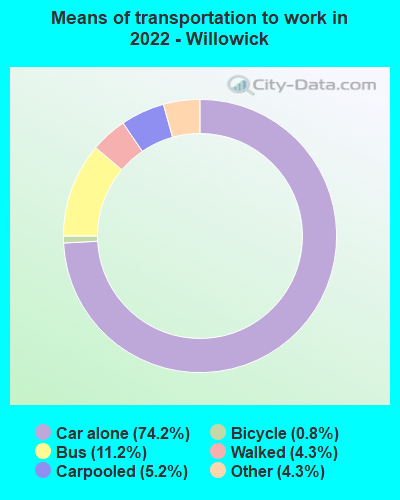
Means of transportation to work:
- Drove a car alone: 1,506 (47.7%)
- Carpooled: 96 (3.0%)
- Bus: 197 (6.2%)
- Taxi: 85 (2.7%)
- Bicycle: 29 (0.9%)
- Walked: 81 (2.6%)
- Worked at home: 1,478 (46.8%)

- Unemployment by race in 2022
- Unemployment rate for White non-Hispanic residents
- 3.9%Males
- 0.7%Females
- Unemployment rate for Black residents
- 6.7%Males
- 23.8%Females

- Year of entry for the foreign-born population in Willowick, Ohio
- 492010 or later
- 42000 to 2009
- 1331990 to 1999
- 601980 to 1989
- 1071970 to 1979
- 384Before 1970

First ancestries reported:
- German: 804 (15.0%)
- Italian: 655 (12.2%)
- Irish: 306 (5.7%)
- Croatian: 284 (5.3%)
- Slovene: 253 (4.7%)
- American: 233 (4.3%)
- Polish: 204 (3.8%)
- English: 197 (3.7%)
- European: 137 (2.6%)
- Hungarian: 116 (2.2%)
- Slavic: 98 (1.8%)
- Slovak: 84 (1.6%)
- Jamaican: 30 (0.6%)
- African: 27 (0.5%)
- Austrian: 26 (0.5%)
- Czech: 17 (0.3%)
- Scottish: 15 (0.3%)
- Belgian: 14 (0.3%)
- Scotch-Irish: 14 (0.3%)
- Lithuanian: 13 (0.2%)
- British: 12 (0.2%)
- Serbian: 11 (0.2%)
- Pennsylvania German: 10 (0.2%)
- Finnish: 8 (0.1%)
- Romanian: 7 (0.1%)
- Swiss: 7 (0.1%)
- Eastern European: 6 (0.1%)
- Dutch: 5 (0.09%)
Most common places of birth for foreign-born residents (%):
| Willowick: | 20.4% (95) |
| Ohio: | 0.4% (2,185) |
| Willowick: | 18.5% (86) |
| Ohio: | 0.2% (1,047) |
| Willowick: | 13.9% (65) |
| Ohio: | 0.6% (3,269) |
| Willowick: | 8.2% (38) |
| Ohio: | 1.2% (6,679) |
| Willowick: | 7.3% (34) |
| Ohio: | 1.5% (8,452) |
| Willowick: | 4.3% (20) |
| Ohio: | 0.3% (1,875) |
| Willowick: | 4.3% (20) |
| Ohio: | 0.3% (1,918) |
| Willowick: | 4.1% (19) |
| Ohio: | 1.0% (5,979) |
| Willowick: | 3.6% (17) |
| Ohio: | 2.0% (11,398) |
| Willowick: | 3.6% (17) |
| Ohio: | 0.8% (4,490) |
| Willowick: | 3.4% (16) |
| Ohio: | 1.1% (6,346) |
| Willowick: | 3.0% (14) |
| Ohio: | 0.6% (3,223) |
| Willowick: | 1.7% (8) |
| Ohio: | 0.7% (4,155) |
| Willowick: | 1.7% (8) |
| Ohio: | 2.6% (14,988) |
Place of birth for U.S.-born residents:
- This state: 12,220
- Other state: 1,477
- Northeast: 777
- Midwest: 165
- South: 376
- West: 163
92.4% of Willowick residents lived in the same house 1 years ago.
Out of people who lived in different houses, 39.7% lived in this county.
Out of people who lived in different counties, 97.9% lived in Ohio.
| Willowick: | 92.4% |
| State average: | 87.8% |
Education attainment for males 25 years and older:
- No schooling: 22
- Nursery to 4th grade: 0
- 5th and 6th grade: 8
- 7th and 8th grade: 0
- 9th grade: 27
- 10th grade: 83
- 11th grade: 51
- 12th grade, no diploma: 184
- High school graduate (or equivalency): 1,717
- Less than 1 year of college: 319
- Some college more than 1 year, no degree: 783
- Associate degree: 525
- Bachelor's degree: 864
- Master's degree: 237
- Professional school degree: 52
- Doctorate degree: 9

Education attainment for females 25 years and older:
- No schooling: 20
- Nursery to 4th grade: 3
- 5th and 6th grade: 0
- 7th and 8th grade: 12
- 9th grade: 2
- 10th grade: 30
- 11th grade: 56
- 12th grade, no diploma: 45
- High school graduate (or equivalency): 1,590
- Less than 1 year of college: 379
- Some college more than 1 year, no degree: 964
- Associate degree: 565
- Bachelor's degree: 1,066
- Master's degree: 438
- Professional school degree: 28
- Doctorate degree: 114


Housing units in structures:
- One, detached: 5,400
- One, attached: 199
- Two: 39
- 3 or 4: 33
- 5 to 9: 81
- 10 to 19: 120
- 20 to 49: 20
- 50 or more: 640
- Mobile homes: 42
Median worth of mobile homes: $8,100
Housing units lacking complete kitchen facilities in 2022: 0.4%
House/condo owner moved in on average 15 years ago
Renter moved in on average 5 years ago

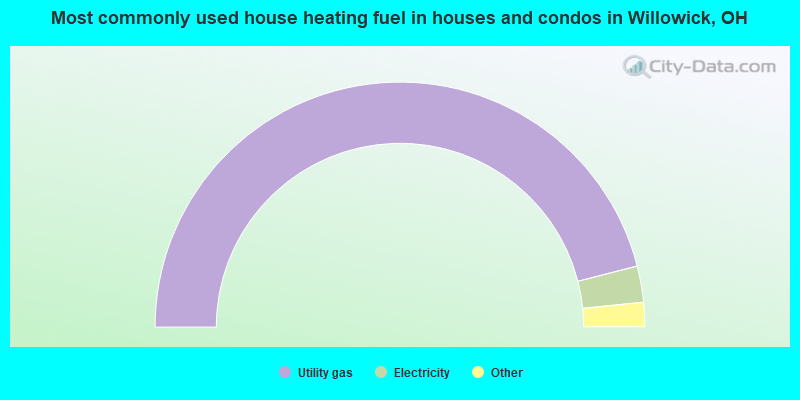
- 92.0%Utility gas
- 4.8%Electricity
- 3.0%Bottled, tank, or LP gas
- 0.2%Fuel oil, kerosene, etc.
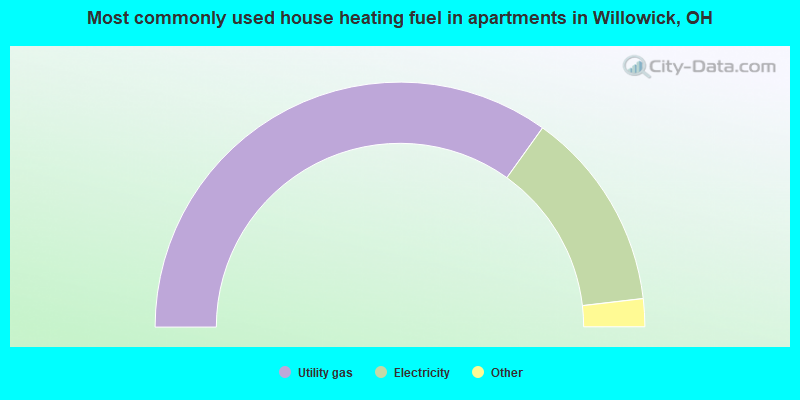
- 69.8%Utility gas
- 26.5%Electricity
- 2.0%Other fuel
- 1.3%Bottled, tank, or LP gas
- 0.3%No fuel used
Private vs. public school enrollment:
| Here: | 14.2% |
| Ohio: | 16.0% |
| Here: | 9.8% |
| Ohio: | 13.1% |
| Here: | 29.6% |
| Ohio: | 22.3% |


