Wilton, CT (Connecticut) Houses and Residents
| Wilton: | $1,192,500 |
| Connecticut: | $347,200 |
Total population: 18,062 (Urban population: 17,633, Rural population: 0)
Houses: 6,113 (5,923 occupied: 5,368 owner occupied, 555 renter occupied)
| % of renters here: | 9% |
| State: | 34% |
Housing density: 227 houses/condos per square mile
Median price asked for vacant for-sale houses and condos in 2022 in this county: $820,471.
Median contract rent in 2022: over $2,000 (lower quartile is $1,447, upper quartile is over $2,000)
Median rent asked for vacant for-rent units in 2022: $1,071
Median gross rent in Wilton, CT in 2022: over $2,000
Housing units in Wilton with a mortgage: 3,726 (389 second mortgage, 633 home equity loan, 6 both second mortgage and home equity loan)
Houses without a mortgage: 1,178
Compare current foreclosures near Wilton, CT:
| Photo | Address | Area | Beds / Baths | Price | Details |
|---|---|---|---|---|---|

|
#1
Chestnut Hill Rd
Wilton, CT 06897
|
4,630 sq. feet
|
4 baths 5 beds |
show details | |

|
#2
Deer Run Rd
Wilton, CT 06897
|
2,117 sq. feet
|
2 baths 3 beds |
show details | |

|
#3
Windy Ridge Pl, C O Martin Avallone Presi
Wilton, CT 06897
|
3,200 sq. feet
|
3 baths 5 beds |
show details | |

|
#4
Rocky Brook Rd
Wilton, CT 06897
|
3,750 sq. feet
|
3 baths 4 beds |
show details | |

|
#5
Danbury Rd
Wilton, CT 06897
|
- sq. feet
|
- baths - beds |
show details | |

|
#6
Highland Park Dr
Danbury, CT 06811
|
875 sq. feet
|
2 baths 2 beds |
$460,000
|
show details |

|
#7
Plymouth St
Stratford, CT 06614
|
1,824 sq. feet
|
2 baths 3 beds |
$499,900
|
show details |

|
#8
Limerick St
Stamford, CT 06902
|
1,382 sq. feet
|
4 baths 5 beds |
$919,900
|
show details |

|
#9
Olcott Way # 122
Ridgefield, CT 06877
|
920 sq. feet
|
1 baths 1 beds |
$364,900
|
show details |

|
#10
Abbott Ave
Danbury, CT 06810
|
1,401 sq. feet
|
1 baths 3 beds |
$499,900
|
show details |
| Photo | Address | Area | Beds / Baths | Price | Details |
|---|---|---|---|---|---|

|
#11
Lynne Pl
Bridgeport, CT 06610
|
1,152 sq. feet
|
2 baths 3 beds |
$389,900
|
show details |

|
#12
Talmadge Hill Rd
Darien, CT 06820
|
- sq. feet
|
4 baths 5 beds |
$2,395,000
|
show details |

|
#13
Lindley St
Bridgeport, CT 06606
|
- sq. feet
|
2 baths 4 beds |
$421,900
|
show details |

|
#14
Sasco Hill Rd
Fairfield, CT 06824
|
- sq. feet
|
4 baths 5 beds |
$6,700,000
|
show details |

|
#15
Vista St
Stamford, CT 06902
|
2,240 sq. feet
|
3 baths 7 beds |
show details | |

|
#16
Patricia Rd Unit B
Bridgeport, CT 06606
|
1,275 sq. feet
|
1 baths 2 beds |
show details | |

|
#17
Remington St
Bridgeport, CT 06610
|
1,292 sq. feet
|
1 baths 3 beds |
show details | |

|
#18
Oakleaf St
Bridgeport, CT 06606
|
1,152 sq. feet
|
1 baths 4 beds |
show details | |

|
#19
Courtland Ave Apt 2w
Stamford, CT 06902
|
1,032 sq. feet
|
2 baths 2 beds |
show details | |

|
#20
Lockwood Rd
Fairfield, CT 06825
|
3,635 sq. feet
|
2 baths 5 beds |
show details |
| Photo | Address | Area | Beds / Baths | Price | Details |
|---|---|---|---|---|---|

|
#21
Northill St Apt 2x
Stamford, CT 06907
|
1,076 sq. feet
|
2 baths 2 beds |
show details | |

|
#22
High Meadow Rd
Southport, CT 06890
|
3,566 sq. feet
|
3 baths 4 beds |
show details | |

|
#23
High View Dr
Stratford, CT 06614
|
2,574 sq. feet
|
2 baths 4 beds |
show details | |

|
#24
Upland Ct
Norwalk, CT 06854
|
1,368 sq. feet
|
1 baths 4 beds |
show details | |

|
#25
Daniel Ct
Westport, CT 06880
|
4,566 sq. feet
|
4 baths 4 beds |
show details | |

|
#26
Wyndover Ln
Stamford, CT 06902
|
4,398 sq. feet
|
3 baths 3 beds |
show details | |

|
#27
Elm St
Monroe, CT 06468
|
2,450 sq. feet
|
2 baths 3 beds |
show details | |

|
#28
Madison Ave
Bridgeport, CT 06606
|
1,100 sq. feet
|
1 baths 3 beds |
show details | |

|
#29
Park Ave Unit 22
Bridgeport, CT 06604
|
2,296 sq. feet
|
2 baths 2 beds |
show details | |

|
#30
Rennell St
Bridgeport, CT 06604
|
1,419 sq. feet
|
1 baths 3 beds |
show details |
| Photo | Address | Area | Beds / Baths | Price | Details |
|---|---|---|---|---|---|

|
#31
Soundview Ave Unit 60
Stamford, CT 06902
|
2,189 sq. feet
|
1 baths 3 beds |
show details | |

|
#32
Beechwood Ave
Bridgeport, CT 06604
|
2,167 sq. feet
|
2 baths 3 beds |
show details | |

|
#33
Horseshoe Dr
Trumbull, CT 06611
|
2,546 sq. feet
|
2 baths 4 beds |
show details | |

|
#34
Overlook Ave
Bridgeport, CT 06606
|
1,232 sq. feet
|
2 baths 3 beds |
show details | |

|
#35
Lexington Ave Apt 203
Bridgeport, CT 06604
|
715 sq. feet
|
1 baths 1 beds |
show details | |

|
#36
Wooster St
Bethel, CT 06801
|
2,573 sq. feet
|
3 baths 5 beds |
show details | |

|
#37
Huntington Ct
Bethel, CT 06801
|
1,312 sq. feet
|
1 baths 2 beds |
show details | |

|
#38
Weber Ave
Bridgeport, CT 06610
|
1,322 sq. feet
|
2 baths 3 beds |
show details | |

|
#39
Wood Acres Lane
Monroe, CT 06468
|
3,159 sq. feet
|
4 baths 4 beds |
show details | |

|
#40
82 Herkimer St
Bridgeport, CT 06604
|
- sq. feet
|
3 baths 5 beds |
show details |
| Photo | Address | Area | Beds / Baths | Price | Details |
|---|---|---|---|---|---|

|
#41
-337 Ridgefield Ave
Bridgeport, CT 06610
|
3,679 sq. feet
|
3 baths 6 beds |
show details | |

|
#42
Briar Oak Dr
Weston, CT 06883
|
2,634 sq. feet
|
3 baths 4 beds |
show details | |

|
#43
Mountain View Dr
Weston, CT 06883
|
4,687 sq. feet
|
3 baths 4 beds |
show details | |

|
#44
Stornowaye St
Chappaqua, NY 10514
|
5,023 sq. feet
|
4 baths 4 beds |
show details | |

|
#45
Buttery Rd
New Canaan, CT 06840
|
1,986 sq. feet
|
2 baths 4 beds |
show details | |

|
#46
Harris St
Norwalk, CT 06850
|
1,176 sq. feet
|
2 baths 3 beds |
show details | |

|
#47
Henry Ave Unit 11q
Stratford, CT 06614
|
662 sq. feet
|
1 baths 1 beds |
show details | |

|
#48
Perry Ln
Stratford, CT 06614
|
2,637 sq. feet
|
2 baths 4 beds |
show details | |

|
#49
Rosedale St
Bridgeport, CT 06604
|
1,638 sq. feet
|
2 baths 6 beds |
show details | |

|
Check over 1 million property listings on Foreclosure.com!
|
browse all offers | |||
Latest news about housing in Wilton, CT collected exclusively by city-data.com from local newspapers, TV, and radio stations


Household type by relationship:
Households: 897,661- In family households: 768,709 (156,025 male householders, 76,871 female householders)
178,028 spouses, 283,184 children (270,358 natural, 5,825 adopted, 7,001 stepchildren), 13,517 grandchildren, 10,152 brothers or sisters, 9,951 parents, foster children, 13,466 other relatives, 21,162 non-relatives
- In nonfamily households: 128,952 (44,659 male householders (33,783 living alone)), 57,990 female householders (49,710 living alone)), 26,303 nonrelatives
- In group quarters: 19,168 (9,152 institutionalized population)
167,032 married couples with children.
41,379 single-parent households (6,664 men, 34,715 women).
89.8% of residents of Wilton speak English at home.
2.1% of residents speak Spanish at home (80% speak English very well, 13% speak English well, 7% speak English not well).
6.2% of residents speak other Indo-European language at home (75% speak English very well, 21% speak English well, 4% speak English not well, 1% don't speak English at all).
1.4% of residents speak Asian or Pacific Island language at home (72% speak English very well, 7% speak English well, 21% speak English not well).
0.4% of residents speak other language at home (88% speak English very well, 12% speak English well).
Foreign born population: 2,393 (13.0%)
(61.6% of them are naturalized citizens)
| Here: | 8.5 |
| State: | 6.5 |
| Here: | 4.0 |
| State: | 4.0 |

- Bedrooms in owner-occupied houses and condos in Wilton, Connecticut
- 0no bedroom
- 1041 bedroom
- 4352 bedrooms
- 1,4303 bedrooms
- 2,5134 bedrooms
- 8865+ bedrooms

- Bedrooms in renter-occupied apartments in Wilton, Connecticut
- 7no bedroom
- 1531 bedroom
- 1992 bedrooms
- 1163 bedrooms
- 724 bedrooms
- 85+ bedrooms

- Cars and other vehicles available in Wilton in owner-occupied houses/condos
- 72no vehicle
- 8171 vehicle
- 2,9412 vehicles
- 1,1863 vehicles
- 2824 vehicles
- 705+ vehicles

- Cars and other vehicles available in Wilton in renter-occupied apartments
- 19no vehicle
- 2871 vehicle
- 1802 vehicles
- 333 vehicles
- 324 vehicles
- 45+ vehicles

- Rooms in owner-occupied houses in Wilton, Connecticut
- 01 room
- 122 rooms
- 423 rooms
- 1524 rooms
- 2285 rooms
- 5306 rooms
- 6987 rooms
- 1,2838 rooms
- 2,4239+ rooms

- Rooms in renter-occupied apartments in Wilton, Connecticut
- 71 room
- 702 rooms
- 793 rooms
- 1434 rooms
- 725 rooms
- 766 rooms
- 357 rooms
- 138 rooms
- 609+ rooms


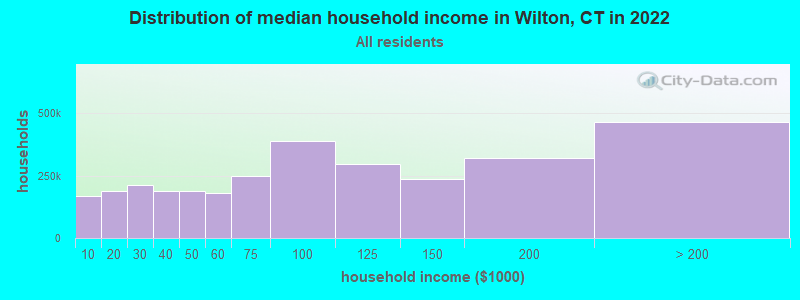
Wilton, CT household income distribution

- 184,257Less than $10,000
- 211,158$10,000 to $19,999
- 235,262$20,000 to $29,999
- 205,806$30,000 to $39,999
- 207,707$40,000 to $49,999
- 200,395$50,000 to $59,999
- 271,603$60,000 to $74,999
- 428,073$75,000 to $99,999
- 324,835$100,000 to $124,999
- 259,068$125,000 to $149,999
- 351,741$150,000 to $199,999
- 507,145$200,000 or more
Percentage of workers working in this county: 71.2%
Number of people working at home: 1,289 (15.4% of all workers)
Travel time to work (commute)
- Less than 5 minutes: 93
- 5 to 9 minutes: 594
- 10 to 14 minutes: 752
- 15 to 19 minutes: 612
- 20 to 24 minutes: 761
- 25 to 29 minutes: 375
- 30 to 34 minutes: 765
- 35 to 39 minutes: 344
- 40 to 44 minutes: 322
- 45 to 59 minutes: 728
- 60 to 89 minutes: 510
- 90 or more minutes: 1,010
Means of transportation to work:
- Drove a car alone: 5,442 (71.8%)
- Carpooled: 372 (4.9%)
- Subway or elevated: 16 (0.2%)
- Railroad: 904 (11.9%)
- Walked: 78 (1.0%)
- Other means: 54 (0.7%)
- Worked at home: 710 (9.4%)


- Year of entry for the foreign-born population in Wilton, Connecticut
- 3541995 to March 2000
- 1151990 to 1994
- 2041985 to 1989
- 1621980 to 1984
- 1461975 to 1979
- 661970 to 1974
- 1971965 to 1969
- 321Before 1965

First ancestries reported:
- Irish: 3,966 (17.6%)
- English: 3,104 (13.8%)
- German: 2,973 (13.2%)
- Italian: 2,762 (12.3%)
- Other: 2,703 (12.0%)
- Polish: 1,005 (4.5%)
- United States: 970 (4.3%)
- Russian: 721 (3.2%)
- Scottish: 631 (2.8%)
- French: 588 (2.6%)
- Swedish: 412 (1.8%)
- Norwegian: 340 (1.5%)
- Scotch-Irish: 321 (1.4%)
- Czech: 298 (1.3%)
- Welsh: 296 (1.3%)
- Dutch: 273 (1.2%)
- Hungarian: 201 (0.9%)
- Greek: 193 (0.9%)
- Danish: 135 (0.6%)
- French Canadian: 131 (0.6%)
- Portuguese: 111 (0.5%)
- Slovak: 86 (0.4%)
- Swiss: 83 (0.4%)
- Lithuanian: 77 (0.3%)
- Arab: 62 (0.3%)
- Ukrainian: 47 (0.2%)
- Subsaharan African: 40 (0.2%)
- West Indian: 15 (0.07%)
Most common places of birth for foreign-born residents (%):
| Wilton: | 14.2% (222) |
| Connecticut: | 4.4% (16,395) |
| Wilton: | 11.9% (187) |
| Connecticut: | 5.2% (19,083) |
| Wilton: | 9.3% (145) |
| Connecticut: | 4.1% (15,108) |
| Wilton: | 7.4% (116) |
| Connecticut: | 3.1% (11,432) |
| Wilton: | 6.6% (104) |
| Connecticut: | 7.0% (26,023) |
| Wilton: | 5.7% (89) |
| Connecticut: | 6.9% (25,507) |
| Wilton: | 3.1% (49) |
| Connecticut: | 1.5% (5,508) |
| Wilton: | 2.9% (46) |
| Connecticut: | 0.7% (2,742) |
| Wilton: | 2.8% (44) |
| Connecticut: | 0.4% (1,513) |
| Wilton: | 2.5% (39) |
| Connecticut: | 0.3% (1,242) |
| Wilton: | 2.4% (37) |
| Connecticut: | 0.6% (2,220) |
| Wilton: | 1.9% (30) |
| Connecticut: | 0.5% (1,983) |
| Wilton: | 1.9% (29) |
| Connecticut: | 0.3% (1,269) |
| Wilton: | 1.8% (28) |
| Connecticut: | 0.1% (299) |
| Wilton: | 1.5% (24) |
| Connecticut: | 1.7% (6,247) |
| Wilton: | 1.5% (24) |
| Connecticut: | 0.6% (2,106) |
Place of birth for U.S.-born residents:
- This state: 5,644
- Other state: 10,152
- Northeast: 7,059
- Midwest: 1,339
- South: 1,010
- West: 744
59% of Wilton residents lived in the same house 5 years ago.
Out of people who lived in different houses, 57% lived in this county.
Out of people who lived in different counties, 7% lived in Connecticut.
Education attainment for males 25 years and older:
- No schooling: 42
- Nursery to 4th grade: 0
- 5th and 6th grade: 8
- 7th and 8th grade: 41
- 9th grade: 36
- 10th grade: 25
- 11th grade: 17
- 12th grade, no diploma: 64
- High school graduate (or equivalency): 347
- Less than 1 year of college: 158
- Some college more than 1 year, no degree: 330
- Associate degree: 164
- Bachelor's degree: 1,934
- Master's degree: 1,425
- Professional school degree: 583
- Doctorate degree: 95

Education attainment for females 25 years and older:
- No schooling: 29
- Nursery to 4th grade: 10
- 5th and 6th grade: 11
- 7th and 8th grade: 39
- 9th grade: 48
- 10th grade: 82
- 11th grade: 33
- 12th grade, no diploma: 86
- High school graduate (or equivalency): 602
- Less than 1 year of college: 220
- Some college more than 1 year, no degree: 557
- Associate degree: 422
- Bachelor's degree: 2,357
- Master's degree: 1,306
- Professional school degree: 304
- Doctorate degree: 140

Housing units in structures:
- One, detached: 5,403
- One, attached: 238
- Two: 20
- 3 or 4: 90
- 5 to 9: 96
- 10 to 19: 21
- 20 to 49: 108
- 50 or more: 137
Housing units lacking complete kitchen facilities: 0.2%

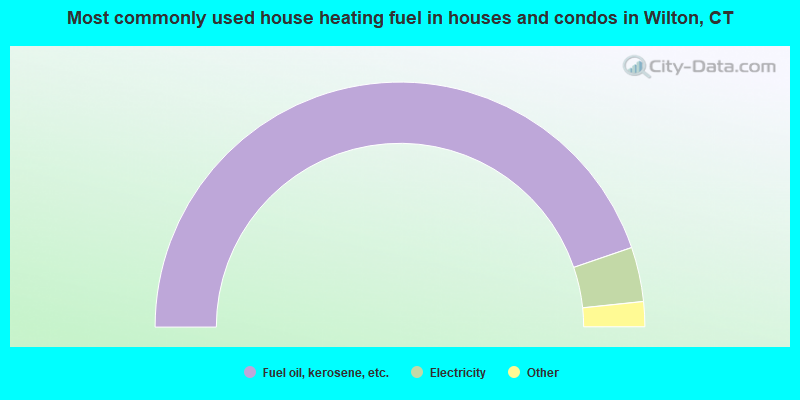
- 89.5%Fuel oil, kerosene, etc.
- 7.2%Electricity
- 1.2%Utility gas
- 1.1%Bottled, tank, or LP gas
- 0.5%Wood
- 0.4%Other fuel
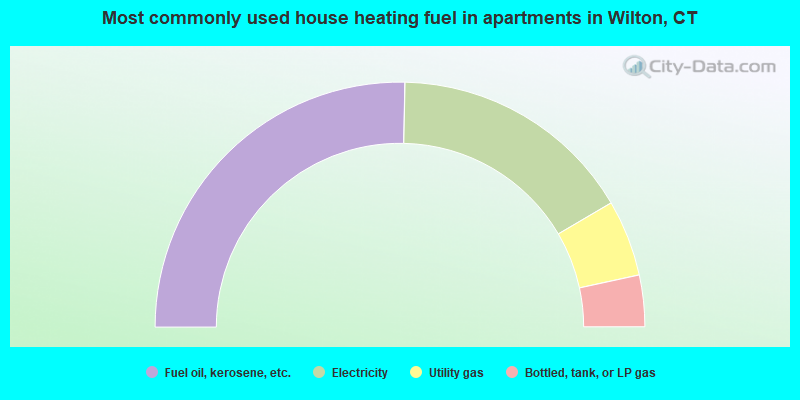
- 50.6%Fuel oil, kerosene, etc.
- 32.4%Electricity
- 10.1%Utility gas
- 6.8%Bottled, tank, or LP gas
Private vs. public school enrollment:
| Here: | 13.5% |
| Connecticut: | 9.9% |
| Here: | 7.1% |
| Connecticut: | 11.0% |
| Here: | 32.1% |
| Connecticut: | 33.4% |


