Wyckoff, NJ (New Jersey) Houses and Residents
| Wyckoff: | $993,808 |
| New Jersey: | $428,900 |
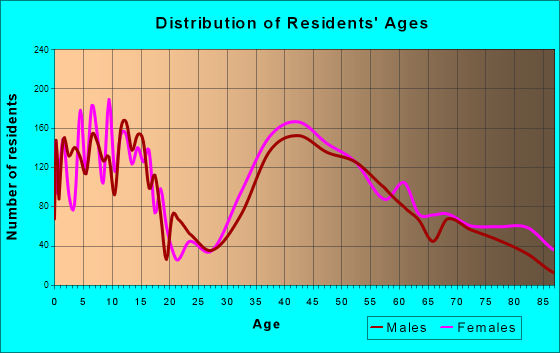
Total population: 16,514 (Urban population: 16,508, Rural population: 0)
Houses: 5,638 (5,541 occupied: 5,143 owner occupied, 398 renter occupied)
| % of renters here: | 7% |
| State: | 35% |
Housing density: 861 houses/condos per square mile
Median price asked for vacant for-sale houses and condos in 2022 in this county: $777,739.
Median contract rent in 2022: $1,991 (lower quartile is $1,543, upper quartile is over $2,000)
Median rent asked for vacant for-rent units in 2022: $3,192
Median gross rent in Wyckoff, NJ in 2022: over $2,000
Housing units in Wyckoff with a mortgage: 3,570 (327 second mortgage, 545 home equity loan, 0 both second mortgage and home equity loan)
Houses without a mortgage: 1,370
Compare current foreclosures near Wyckoff, NJ:
| Photo | Address | Area | Beds / Baths | Price | Details |
|---|---|---|---|---|---|

|
#1
Wyckoff Ave
Wyckoff, NJ 07481
|
1,092 sq. feet
|
- baths - beds |
show details | |

|
#2
Terrace Hts
Wyckoff, NJ 07481
|
2,608 sq. feet
|
- baths - beds |
show details | |

|
#3
James Way
Wyckoff, NJ 07481
|
1,988 sq. feet
|
- baths - beds |
show details | |

|
#4
Barrister 503
Wyckoff, NJ 07481
|
2,306 sq. feet
|
- baths - beds |
show details | |

|
#5
Barrister Ct # 503
Wyckoff, NJ 07481
|
2,306 sq. feet
|
- baths - beds |
show details | |

|
#6
Red Rock Rd
Wyckoff, NJ 07481
|
2,811 sq. feet
|
- baths - beds |
show details | |

|
#7
Sheldon St
Wyckoff, NJ 07481
|
1,483 sq. feet
|
- baths - beds |
show details | |

|
#8
Midland Ave # 1
Wyckoff, NJ 07481
|
2,666 sq. feet
|
- baths - beds |
show details | |

|
#9
Packard Ave
Wyckoff, NJ 07481
|
2,478 sq. feet
|
- baths - beds |
show details | |

|
#10
Coolidge Ter
Wyckoff, NJ 07481
|
3,406 sq. feet
|
- baths - beds |
show details |
| Photo | Address | Area | Beds / Baths | Price | Details |
|---|---|---|---|---|---|

|
#11
Linden St
Wyckoff, NJ 07481
|
917 sq. feet
|
- baths - beds |
show details | |

|
#12
Carriage Ln
Wyckoff, NJ 07481
|
2,172 sq. feet
|
- baths - beds |
show details | |

|
#13
Morse Ave
Wyckoff, NJ 07481
|
876 sq. feet
|
- baths - beds |
show details | |

|
#14
Franklin Ave
Wyckoff, NJ 07481
|
1,656 sq. feet
|
- baths - beds |
show details | |

|
#15
Cumberland Ct
Wyckoff, NJ 07481
|
1,778 sq. feet
|
- baths - beds |
show details | |

|
#16
Lakeview Dr
Wyckoff, NJ 07481
|
4,934 sq. feet
|
- baths - beds |
show details | |

|
#17
Hurley Ave
Wyckoff, NJ 07481
|
2,254 sq. feet
|
- baths - beds |
show details | |

|
#18
Wyckoff Ave
Wyckoff, NJ 07481
|
- sq. feet
|
- baths - beds |
show details | |

|
#19
Oakwood Dr
Wyckoff, NJ 07481
|
3,047 sq. feet
|
- baths - beds |
show details | |

|
#20
Eder Ave
Wyckoff, NJ 07481
|
704 sq. feet
|
- baths - beds |
show details |
| Photo | Address | Area | Beds / Baths | Price | Details |
|---|---|---|---|---|---|

|
#21
Lincoln Ave
Wyckoff, NJ 07481
|
1,514 sq. feet
|
- baths - beds |
show details | |

|
#22
Newtown Rd
Wyckoff, NJ 07481
|
2,304 sq. feet
|
- baths - beds |
show details | |

|
#23
Forest Ave
Paramus, NJ 07652
|
2,428 sq. feet
|
3 baths 5 beds |
$749,900
|
show details |

|
#24
Lookout Rd
Tuxedo Park, NY 10987
|
1,945 sq. feet
|
2 baths 1 beds |
$479,900
|
show details |

|
#25
Martin Dr
Harrington Park, NJ 07640
|
1,746 sq. feet
|
3 baths 3 beds |
$965,000
|
show details |

|
#26
N Broadway
Irvington, NY 10533
|
850 sq. feet
|
1 baths 2 beds |
$315,000
|
show details |

|
#27
Bloomfield Ave
Caldwell, NJ 07006
|
1,216 sq. feet
|
2 baths 2 beds |
$400,000
|
show details |

|
#28
Ashland Ave
East Orange, NJ 07017
|
2,254 sq. feet
|
1 baths 5 beds |
$272,000
|
show details |

|
#29
Fordham Hill Oval
Bronx, NY 10468
|
700 sq. feet
|
1 baths 1 beds |
$154,900
|
show details |

|
#30
Willow St
Bloomfield, NJ 07003
|
1,092 sq. feet
|
1 baths 3 beds |
$499,900
|
show details |
| Photo | Address | Area | Beds / Baths | Price | Details |
|---|---|---|---|---|---|

|
#31
N Broadway Apt A6
Yonkers, NY 10701
|
950 sq. feet
|
2 baths 2 beds |
$219,900
|
show details |

|
#32
Beverly Rd
Oradell, NJ 07649
|
1,200 sq. feet
|
1 baths 3 beds |
$569,900
|
show details |

|
#33
Jersey Ave
Fairview, NJ 07022
|
1,073 sq. feet
|
1 baths 3 beds |
$414,900
|
show details |

|
#34
Park Ave Apt 12
North Bergen, NJ 07047
|
835 sq. feet
|
1 baths 2 beds |
$379,900
|
show details |

|
#35
Horizon Rd Apt 803
Fort Lee, NJ 07024
|
843 sq. feet
|
1 baths 1 beds |
$178,900
|
show details |

|
#36
N Main St Apt C-15
Spring Valley, NY 10977
|
800 sq. feet
|
1 baths 1 beds |
$85,000
|
show details |

|
#37
Oakdale Mnr Apt A6d
Suffern, NY 10901
|
750 sq. feet
|
1 baths 1 beds |
$99,900
|
show details |

|
#38
Fifth Street
Hillburn, NY 10931
|
- sq. feet
|
1 baths 3 beds |
$462,800
|
show details |

|
#39
N 19th St
East Orange, NJ 07017
|
- sq. feet
|
3 baths 6 beds |
$399,900
|
show details |

|
#40
Glannon Rd
Livingston, NJ 07039
|
- sq. feet
|
1 baths 3 beds |
$535,600
|
show details |
| Photo | Address | Area | Beds / Baths | Price | Details |
|---|---|---|---|---|---|

|
#41
Blvd E, Apt 34b, Bldg 3
West New York, NJ 07093
|
- sq. feet
|
2 baths 2 beds |
$429,900
|
show details |

|
#42
Arlington Ave Apt 11n
Bronx, NY 10471
|
500 sq. feet
|
- baths 1 beds |
$182,500
|
show details |

|
#43
Lincoln Ave
Elmwood Park, NJ 07407
|
- sq. feet
|
1 baths 4 beds |
$426,400
|
show details |

|
#44
Glenwood Ave Apt 74
Yonkers, NY 10703
|
- sq. feet
|
1 baths 3 beds |
$313,000
|
show details |

|
#45
6th St
Hillburn, NY 10931
|
2,469 sq. feet
|
3 baths 5 beds |
show details | |

|
#46
Wedgewood Dr 13 Unit 13
Little Falls, NJ 07424
|
1,868 sq. feet
|
2 baths 2 beds |
show details | |

|
#47
Highland Ave
Passaic, NJ 07055
|
2,018 sq. feet
|
2 baths 4 beds |
show details | |

|
#48
Liberty Rd
Englewood, NJ 07631
|
1,200 sq. feet
|
1 baths 3 beds |
show details | |

|
#49
Oakwood Dr
Woodcliff Lake, NJ 07677
|
2,605 sq. feet
|
2 baths 3 beds |
show details | |

|
Check over 1 million property listings on Foreclosure.com!
|
browse all offers | |||
Latest news about housing in Wyckoff, NJ collected exclusively by city-data.com from local newspapers, TV, and radio stations

 | Housing Market is going nuts (78 replies) |
| Haworth vs Glen Rock vs Wyckoff (32 replies) |
| median household income vs median home price (28 replies) |
| Good schools+ affordable housing near Paterson? (17 replies) |
| Help on where to buy a family home in Bergen County (3 replies) |
| midland park vs wyckoff vs glen rock vs oakland (34 replies) |
Household type by relationship:
Households: 894,694- In family households: 779,421 (168,972 male householders, 69,583 female householders)
188,466 spouses, 279,702 children (268,784 natural, 4,691 adopted, 6,227 stepchildren), 10,849 grandchildren, 10,453 brothers or sisters, 14,408 parents, foster children, 12,886 other relatives, 15,359 non-relatives
- In nonfamily households: 115,273 (40,798 male householders (32,649 living alone)), 56,377 female householders (50,096 living alone)), 18,098 nonrelatives
- In group quarters: 10,422 (5,047 institutionalized population)
164,958 married couples with children.
25,129 single-parent households (5,042 men, 20,087 women).
87.3% of residents of Wyckoff speak English at home.
2.6% of residents speak Spanish at home (81% speak English very well, 10% speak English well, 8% speak English not well).
6.0% of residents speak other Indo-European language at home (77% speak English very well, 14% speak English well, 7% speak English not well, 1% don't speak English at all).
3.3% of residents speak Asian or Pacific Island language at home (67% speak English very well, 19% speak English well, 12% speak English not well, 2% don't speak English at all).
0.7% of residents speak other language at home (78% speak English very well, 22% speak English well).
Foreign born population: 2,111 (11.9%)
(92.7% of them are naturalized citizens)
| Here: | 7.9 |
| State: | 6.8 |
| Here: | 5.1 |
| State: | 3.9 |

- Bedrooms in owner-occupied houses and condos in Wyckoff, New Jersey
- 7no bedroom
- 361 bedroom
- 4742 bedrooms
- 1,8113 bedrooms
- 2,0754 bedrooms
- 7405+ bedrooms

- Bedrooms in renter-occupied apartments in Wyckoff, New Jersey
- 29no bedroom
- 941 bedroom
- 1182 bedrooms
- 983 bedrooms
- 524 bedrooms
- 75+ bedrooms

- Cars and other vehicles available in Wyckoff in owner-occupied houses/condos
- 73no vehicle
- 9151 vehicle
- 2,8822 vehicles
- 9693 vehicles
- 1934 vehicles
- 1115+ vehicles

- Cars and other vehicles available in Wyckoff in renter-occupied apartments
- 94no vehicle
- 1131 vehicle
- 1372 vehicles
- 413 vehicles
- 134 vehicles
- 05+ vehicles

- Rooms in owner-occupied houses in Wyckoff, New Jersey
- 01 room
- 02 rooms
- 253 rooms
- 254 rooms
- 3635 rooms
- 7546 rooms
- 1,0787 rooms
- 1,3258 rooms
- 1,5739+ rooms

- Rooms in renter-occupied apartments in Wyckoff, New Jersey
- 291 room
- 422 rooms
- 373 rooms
- 534 rooms
- 855 rooms
- 546 rooms
- 477 rooms
- 448 rooms
- 79+ rooms


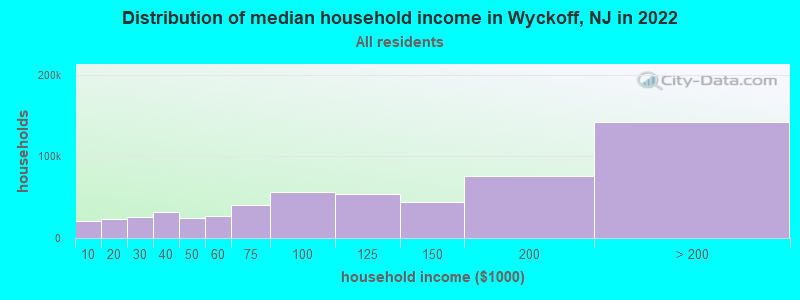
Wyckoff, NJ household income distribution

- 20,950Less than $10,000
- 23,360$10,000 to $19,999
- 25,295$20,000 to $29,999
- 31,301$30,000 to $39,999
- 24,021$40,000 to $49,999
- 26,596$50,000 to $59,999
- 40,902$60,000 to $74,999
- 55,821$75,000 to $99,999
- 53,961$100,000 to $124,999
- 44,137$125,000 to $149,999
- 75,413$150,000 to $199,999
- 141,945$200,000 or more
Percentage of workers working in this county: 65.3%
Number of people working at home: 1,563 (18.6% of all workers)
Travel time to work (commute)
- Less than 5 minutes: 289
- 5 to 9 minutes: 750
- 10 to 14 minutes: 1,100
- 15 to 19 minutes: 847
- 20 to 24 minutes: 709
- 25 to 29 minutes: 325
- 30 to 34 minutes: 668
- 35 to 39 minutes: 161
- 40 to 44 minutes: 207
- 45 to 59 minutes: 655
- 60 to 89 minutes: 837
- 90 or more minutes: 400
Means of transportation to work:
- Drove a car alone: 5,741 (78.7%)
- Carpooled: 442 (6.1%)
- Bus or trolley bus: 321 (4.4%)
- Railroad: 350 (4.8%)
- Taxi: 9 (0.1%)
- Motorcycle: 5 (0.1%)
- Bicycle: 4 (0.1%)
- Walked: 72 (1.0%)
- Other means: 4 (0.1%)
- Worked at home: 349 (4.8%)


- Year of entry for the foreign-born population in Wyckoff, New Jersey
- 1141995 to March 2000
- 2271990 to 1994
- 1191985 to 1989
- 1051980 to 1984
- 1521975 to 1979
- 971970 to 1974
- 1761965 to 1969
- 540Before 1965
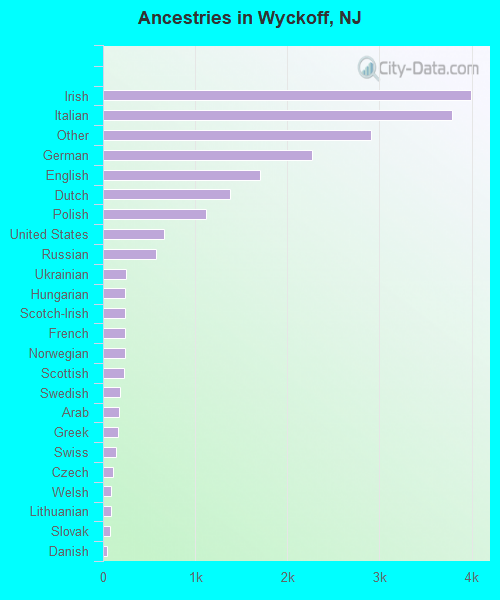
First ancestries reported:
- Irish: 3,989 (19.0%)
- Italian: 3,782 (18.0%)
- Other: 2,913 (13.9%)
- German: 2,273 (10.8%)
- English: 1,709 (8.2%)
- Dutch: 1,374 (6.6%)
- Polish: 1,118 (5.3%)
- United States: 659 (3.1%)
- Russian: 577 (2.8%)
- Ukrainian: 245 (1.2%)
- Hungarian: 243 (1.2%)
- Scotch-Irish: 241 (1.1%)
- French: 238 (1.1%)
- Norwegian: 237 (1.1%)
- Scottish: 229 (1.1%)
- Swedish: 182 (0.9%)
- Arab: 177 (0.8%)
- Greek: 165 (0.8%)
- Swiss: 145 (0.7%)
- Czech: 111 (0.5%)
- Welsh: 87 (0.4%)
- Lithuanian: 85 (0.4%)
- Slovak: 77 (0.4%)
- Danish: 41 (0.2%)
- Portuguese: 35 (0.2%)
- French Canadian: 23 (0.1%)
- West Indian: 4 (0.02%)
Most common places of birth for foreign-born residents (%):
| Wyckoff: | 11.4% (175) |
| New Jersey: | 3.5% (51,970) |
| Wyckoff: | 6.3% (97) |
| New Jersey: | 1.2% (17,647) |
| Wyckoff: | 5.9% (90) |
| New Jersey: | 4.0% (58,395) |
| Wyckoff: | 5.6% (85) |
| New Jersey: | 2.1% (30,355) |
| Wyckoff: | 5.0% (76) |
| New Jersey: | 2.7% (40,092) |
| Wyckoff: | 4.6% (71) |
| New Jersey: | 1.1% (16,333) |
| Wyckoff: | 4.4% (67) |
| New Jersey: | 2.3% (33,531) |
| Wyckoff: | 4.1% (63) |
| New Jersey: | 0.3% (3,781) |
| Wyckoff: | 3.2% (49) |
| New Jersey: | 3.7% (55,241) |
| Wyckoff: | 3.1% (48) |
| New Jersey: | 0.8% (11,245) |
| Wyckoff: | 3.0% (46) |
| New Jersey: | 8.1% (119,497) |
| Wyckoff: | 2.9% (44) |
| New Jersey: | 0.7% (9,606) |
| Wyckoff: | 2.9% (44) |
| New Jersey: | 1.4% (20,243) |
| Wyckoff: | 2.6% (40) |
| New Jersey: | 4.7% (69,773) |
| Wyckoff: | 2.2% (34) |
| New Jersey: | 0.8% (12,082) |
| Wyckoff: | 2.2% (34) |
| New Jersey: | 3.8% (55,466) |
| Wyckoff: | 2.0% (31) |
| New Jersey: | 0.4% (5,220) |
| Wyckoff: | 2.0% (30) |
| New Jersey: | 1.4% (20,079) |
| Wyckoff: | 1.8% (28) |
| New Jersey: | 0.6% (8,266) |
| Wyckoff: | 1.6% (25) |
| New Jersey: | 6.2% (91,316) |
| Wyckoff: | 1.6% (25) |
| New Jersey: | 0.4% (5,697) |
| Wyckoff: | 1.5% (23) |
| New Jersey: | 0.4% (5,277) |
Place of birth for U.S.-born residents:
- This state: 9,306
- Other state: 5,553
- Northeast: 4,391
- Midwest: 535
- South: 451
- West: 176
70% of Wyckoff residents lived in the same house 5 years ago.
Out of people who lived in different houses, 59% lived in this county.
Out of people who lived in different counties, 58% lived in New Jersey.
Education attainment for males 25 years and older:
- No schooling: 11
- Nursery to 4th grade: 0
- 5th and 6th grade: 12
- 7th and 8th grade: 78
- 9th grade: 27
- 10th grade: 40
- 11th grade: 25
- 12th grade, no diploma: 107
- High school graduate (or equivalency): 669
- Less than 1 year of college: 170
- Some college more than 1 year, no degree: 507
- Associate degree: 147
- Bachelor's degree: 1,902
- Master's degree: 904
- Professional school degree: 448
- Doctorate degree: 93

Education attainment for females 25 years and older:
- No schooling: 0
- Nursery to 4th grade: 11
- 5th and 6th grade: 18
- 7th and 8th grade: 144
- 9th grade: 32
- 10th grade: 67
- 11th grade: 15
- 12th grade, no diploma: 101
- High school graduate (or equivalency): 1,355
- Less than 1 year of college: 299
- Some college more than 1 year, no degree: 619
- Associate degree: 370
- Bachelor's degree: 1,837
- Master's degree: 879
- Professional school degree: 161
- Doctorate degree: 74

Housing units in structures:
- One, detached: 5,052
- One, attached: 270
- Two: 134
- 3 or 4: 60
- 5 to 9: 17
- 20 to 49: 62
- 50 or more: 36
- Boats, RVs, vans, etc.: 7
Housing units lacking complete kitchen facilities: 0.8%

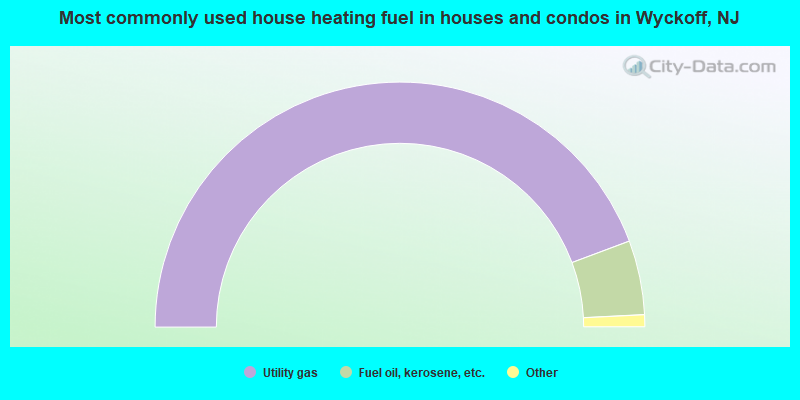
- 88.6%Utility gas
- 9.8%Fuel oil, kerosene, etc.
- 1.3%Electricity
- 0.1%No fuel used
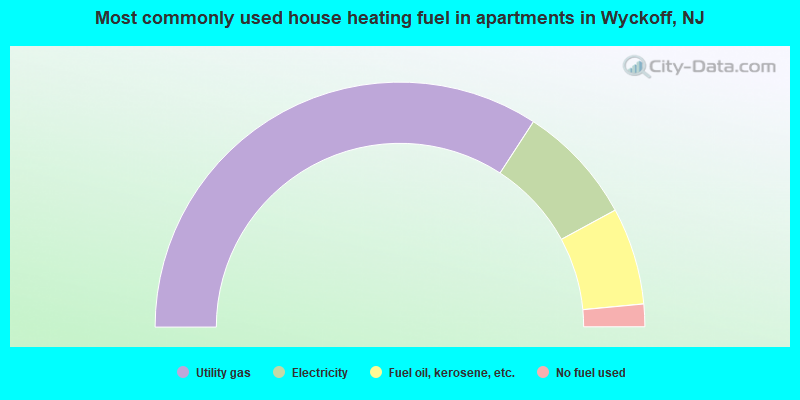
- 68.3%Utility gas
- 15.8%Electricity
- 12.8%Fuel oil, kerosene, etc.
- 3.0%No fuel used
Private vs. public school enrollment:
| Here: | 7.8% |
| New Jersey: | 13.2% |
| Here: | 11.1% |
| New Jersey: | 13.0% |
| Here: | 36.6% |
| New Jersey: | 30.1% |


