Xenia, IL (Illinois) Houses and Residents
| Xenia: | $95,126 |
| Illinois: | $251,600 |
Mean price in 2022:
Detached houses: $95,316
Here: $95,316 State: $310,164 Mobile homes: $72,991
Here: $72,991 State: $78,855
Total population: 385 (Urban population: 0, Rural population: 400 (4 farm, 396 nonfarm))
Houses: 162 (130 occupied: 105 owner occupied, 26 renter occupied)
| % of renters here: | 20% |
| State: | 33% |
Housing density: 312 houses/condos per square mile
Median price asked for vacant for-sale houses and condos in 2022 in this county: $57,779.
Median contract rent in 2022: $381 (lower quartile is $356, upper quartile is $553)
Median rent asked for vacant for-rent units in 2022: $218
Median gross rent in Xenia, IL in 2022: $645
Housing units in Xenia with a mortgage: 48 (0 second mortgage, 0 home equity loan, 0 both second mortgage and home equity loan)
Houses without a mortgage: 0
Median household income for houses/condos with a mortgage: $64,672
Median household income for apartments without a mortgage: $55,170
Median monthly housing costs: $609
Compare current foreclosures near Xenia, IL:
| Photo | Address | Area | Beds / Baths | Price | Details |
|---|---|---|---|---|---|

|
#1
West St
Xenia, IL 62899
|
- sq. feet
|
- baths - beds |
show details | |

|
#2
E Bennett St
Salem, IL 62881
|
1,242 sq. feet
|
1 baths 2 beds |
show details | |

|
#3
S Church St
Louisville, IL 62858
|
- sq. feet
|
- baths - beds |
show details | |

|
#4
Julia Dr
Salem, IL 62881
|
- sq. feet
|
- baths - beds |
show details | |

|
#5
N Jefferson St Apt 211
Salem, IL 62881
|
- sq. feet
|
- baths - beds |
show details | |

|
#6
Illinois St
Alma, IL 62807
|
- sq. feet
|
- baths - beds |
show details | |

|
#7
Public Hwy
Alma, IL 62807
|
- sq. feet
|
- baths - beds |
show details | |

|
#8
E Washington Ave
Farina, IL 62838
|
1,000 sq. feet
|
- baths - beds |
show details | |

|
#9
Marquardt Rd
Iuka, IL 62849
|
- sq. feet
|
- baths - beds |
show details | |

|
#10
S Washington St
Kinmundy, IL 62854
|
- sq. feet
|
- baths - beds |
show details |
| Photo | Address | Area | Beds / Baths | Price | Details |
|---|---|---|---|---|---|

|
#11
E Vanburen Ave
Farina, IL 62838
|
- sq. feet
|
- baths - beds |
show details | |

|
#12
Us Highway 45
Rinard, IL 62878
|
- sq. feet
|
- baths - beds |
show details | |

|
#13
Meadowview Dr
Flora, IL 62839
|
- sq. feet
|
- baths - beds |
show details | |

|
#14
County Highway 20
Rinard, IL 62878
|
- sq. feet
|
- baths - beds |
show details | |

|
#15
Shingle Oak Dr
Salem, IL 62881
|
- sq. feet
|
- baths - beds |
show details | |

|
#16
W Warmouth St
Salem, IL 62881
|
- sq. feet
|
- baths - beds |
show details | |

|
#17
W 5th St
Flora, IL 62839
|
- sq. feet
|
- baths - beds |
show details | |

|
#18
Oglesby St
Salem, IL 62881
|
- sq. feet
|
- baths - beds |
show details | |

|
#19
S Main St
Flora, IL 62839
|
- sq. feet
|
- baths - beds |
show details | |

|
#20
E William St
Salem, IL 62881
|
- sq. feet
|
- baths - beds |
show details |
| Photo | Address | Area | Beds / Baths | Price | Details |
|---|---|---|---|---|---|

|
#21
S Main St
Iuka, IL 62849
|
- sq. feet
|
- baths - beds |
show details | |

|
#22
N Shelby Ave
Salem, IL 62881
|
- sq. feet
|
- baths - beds |
show details | |

|
#23
S 1st St SE
Clay City, IL 62824
|
- sq. feet
|
- baths - beds |
show details | |

|
#24
Charleston Rd
Salem, IL 62881
|
- sq. feet
|
- baths - beds |
show details | |

|
#25
Fair Ave
Flora, IL 62839
|
- sq. feet
|
- baths - beds |
show details | |

|
#26
High St
Alma, IL 62807
|
- sq. feet
|
- baths - beds |
show details | |

|
#27
N Main St
Louisville, IL 62858
|
- sq. feet
|
- baths - beds |
show details | |

|
#28
Broadway Ave
Alma, IL 62807
|
- sq. feet
|
- baths - beds |
show details | |

|
#29
Pine Tree Dr
Salem, IL 62881
|
- sq. feet
|
- baths - beds |
show details | |

|
#30
Edgewood Rd
Salem, IL 62881
|
- sq. feet
|
- baths - beds |
show details |
| Photo | Address | Area | Beds / Baths | Price | Details |
|---|---|---|---|---|---|

|
#31
Yards Rd
Salem, IL 62881
|
- sq. feet
|
- baths - beds |
show details | |

|
#32
Bee Branch Rd
Salem, IL 62881
|
- sq. feet
|
- baths - beds |
show details | |

|
#33
Charlton Rd
Kell, IL 62853
|
- sq. feet
|
- baths - beds |
show details | |

|
#34
Iola Ln
Louisville, IL 62858
|
- sq. feet
|
- baths - beds |
show details | |

|
#35
County Farm Rd
Salem, IL 62881
|
- sq. feet
|
- baths - beds |
show details | |

|
#36
Tanner St
Louisville, IL 62858
|
- sq. feet
|
- baths - beds |
show details | |

|
#37
Williams Rd
Alma, IL 62807
|
- sq. feet
|
- baths - beds |
show details | |

|
#38
Kinmundy Rd
Kinmundy, IL 62854
|
- sq. feet
|
- baths - beds |
show details | |

|
#39
N Franklin St
Salem, IL 62881
|
- sq. feet
|
- baths - beds |
show details | |

|
Check over 1 million property listings on Foreclosure.com!
|
browse all offers | |||

Latest news about housing in Xenia, IL collected exclusively by city-data.com from local newspapers, TV, and radio stations

 | How safe is the north end of the Rogers Park area (up by Howard)? (42 replies) |
| Rogers Park - which blocks would you avoid, for safety reasons? (61 replies) |

Median year apartment built: 1963
Household type by relationship:
Households: 318- Male householders: 71 (25 living alone), Female householders: 57 (22 living alone)
57 spouses (57 opposite-sex spouses), 17 unmarried partners, (16 opposite-sex unmarried partners), 85 children (71 natural, 0 adopted, 13 stepchildren), 4 grandchildren, 10 brothers or sisters, 0 parents, 0 foster children, 3 other relatives, 8 non-relatives
Size of family households: 38 2-persons, 11 3-persons, 12 4-persons, 7 5-persons, 1 7-or-more-persons.
Size of nonfamily households: 50 1-person, 8 2-persons, 1 3-persons, 1 5-persons.
43 married couples with children.
14 single-parent households (10 men, 4 women).
98.9% of residents of Xenia speak English at home.
0.4% of residents speak other Indo-European language at home (100% speak English very well).
Foreign born population: 4 (1.3%)
(50.0% of them are naturalized citizens)
| Here: | 6.2 |
| State: | 6.4 |
| Here: | 4.6 |
| State: | 4.1 |

- Bedrooms in owner-occupied houses and condos in Xenia, Illinois
- 1no bedroom
- 31 bedroom
- 382 bedrooms
- 473 bedrooms
- 174 bedrooms
- 05+ bedrooms

- Bedrooms in renter-occupied apartments in Xenia, Illinois
- 0no bedroom
- 191 bedroom
- 32 bedrooms
- 33 bedrooms
- 14 bedrooms
- 05+ bedrooms

- Cars and other vehicles available in Xenia in owner-occupied houses/condos
- 7no vehicle
- 201 vehicle
- 382 vehicles
- 313 vehicles
- 64 vehicles
- 45+ vehicles

- Cars and other vehicles available in Xenia in renter-occupied apartments
- 1no vehicle
- 231 vehicle
- 12 vehicles
- 13 vehicles
- 04 vehicles
- 05+ vehicles

- Rooms in owner-occupied houses in Xenia, Illinois
- 01 room
- 12 rooms
- 103 rooms
- 64 rooms
- 75 rooms
- 396 rooms
- 177 rooms
- 128 rooms
- 139+ rooms

- Rooms in renter-occupied apartments in Xenia, Illinois
- 01 room
- 32 rooms
- 63 rooms
- 24 rooms
- 115 rooms
- 06 rooms
- 07 rooms
- 38 rooms
- 19+ rooms


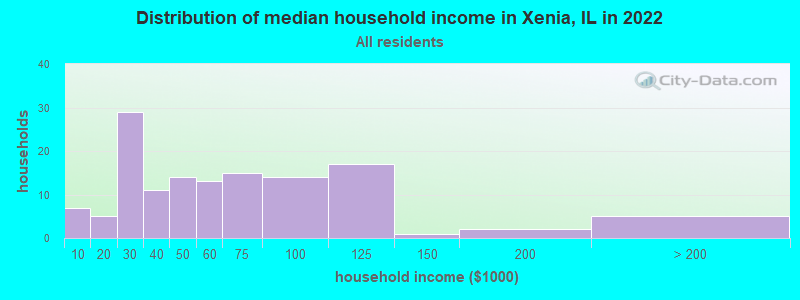
Xenia, IL household income distribution

- 7Less than $10,000
- 5$10,000 to $19,999
- 29$20,000 to $29,999
- 11$30,000 to $39,999
- 14$40,000 to $49,999
- 13$50,000 to $59,999
- 15$60,000 to $74,999
- 14$75,000 to $99,999
- 17$100,000 to $124,999
- 1$125,000 to $149,999
- 2$150,000 to $199,999
- 5$200,000 or more
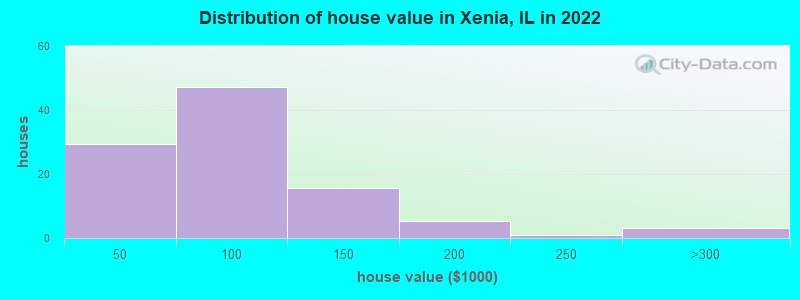
Home value of owner - occupied houses in 2022 in Xenia, IL
-
- 6Less than $10,000
- 1$15,000 to $19,999
- 4$25,000 to $29,999
- 2$30,000 to $34,999
- 9$35,000 to $39,999
- 4$40,000 to $49,999
- 6$50,000 to $59,999
- 7$60,000 to $69,999
- 3$70,000 to $79,999
- 5$80,000 to $89,999
- 20$90,000 to $99,999
- 6$100,000 to $124,999
- 8$125,000 to $149,999
- 5$150,000 to $174,999
- 0$200,000 to $249,999
- 3$250,000 to $299,999
Rent paid by renters in 2022 in Xenia, IL
-
- 0Less than $100
- 0$250 to $299
- 2$300 to $349
- 13$350 to $399
- 2$400 to $449
- 4$550 to $599
- 1$650 to $699


Percentage of workers working in this county: 71.9%
Number of people working at home: 11 (7.9% of all workers)
Travel time to work (commute)
- Less than 5 minutes: 20
- 5 to 9 minutes: 4
- 10 to 14 minutes: 21
- 15 to 19 minutes: 26
- 20 to 24 minutes: 15
- 25 to 29 minutes: 2
- 30 to 34 minutes: 10
- 35 to 39 minutes: 0
- 40 to 44 minutes: 7
- 45 to 59 minutes: 4
- 60 to 89 minutes: 10
- 90 or more minutes: 0
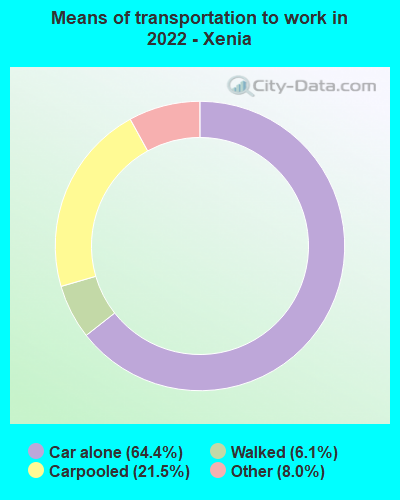
Means of transportation to work:
- Drove a car alone: 160 (58.4%)
- Carpooled: 53 (19.3%)
- Taxi: 26 (9.5%)
- Walked: 13 (4.7%)
- Worked at home: 20 (7.3%)

- Unemployment by race in 2022
- Unemployment rate for White non-Hispanic residents
- 13.0%Males
- 3.3%Females

- Year of entry for the foreign-born population in Xenia, Illinois
- 02010 or later
- 22000 to 2009
- 11990 to 1999
- 01980 to 1989
- 11970 to 1979
- 3Before 1970

First ancestries reported:
- English: 28 (23.0%)
- German: 19 (15.6%)
- American: 9 (7.4%)
- Dutch: 4 (3.3%)
- Irish: 3 (2.5%)
- Eastern European: 2 (1.6%)
Most common places of birth for foreign-born residents (%):
| Xenia: | 50.0% (2) |
| Illinois: | 0.1% (1,403) |
| Xenia: | 50.0% (2) |
| Illinois: | 1.0% (18,753) |
Place of birth for U.S.-born residents:
- This state: 266
- Other state: 46
- Northeast: 2
- Midwest: 18
- South: 17
- West: 9
87.9% of Xenia residents lived in the same house 1 years ago.
Out of people who lived in different houses, 39.0% lived in this county.
Out of people who lived in different counties, 46.2% lived in Illinois.
| Xenia: | 87.9% |
| State average: | 88.3% |
Education attainment for males 25 years and older:
- No schooling: 0
- Nursery to 4th grade: 0
- 5th and 6th grade: 1
- 7th and 8th grade: 0
- 9th grade: 1
- 10th grade: 4
- 11th grade: 0
- 12th grade, no diploma: 2
- High school graduate (or equivalency): 42
- Less than 1 year of college: 18
- Some college more than 1 year, no degree: 11
- Associate degree: 11
- Bachelor's degree: 14
- Master's degree: 0
- Professional school degree: 0
- Doctorate degree: 0

Education attainment for females 25 years and older:
- No schooling: 0
- Nursery to 4th grade: 0
- 5th and 6th grade: 0
- 7th and 8th grade: 0
- 9th grade: 0
- 10th grade: 1
- 11th grade: 0
- 12th grade, no diploma: 1
- High school graduate (or equivalency): 44
- Less than 1 year of college: 11
- Some college more than 1 year, no degree: 18
- Associate degree: 17
- Bachelor's degree: 8
- Master's degree: 3
- Professional school degree: 4
- Doctorate degree: 0


Housing units in structures:
- One, detached: 116
- Two: 1
- 3 or 4: 5
- 5 to 9: 3
- 10 to 19: 1
- Mobile homes: 36
Median worth of mobile homes: $109,148
Housing units lacking complete kitchen facilities in 2022: 16.7%
House/condo owner moved in on average 8 years ago
Renter moved in on average 3 years ago

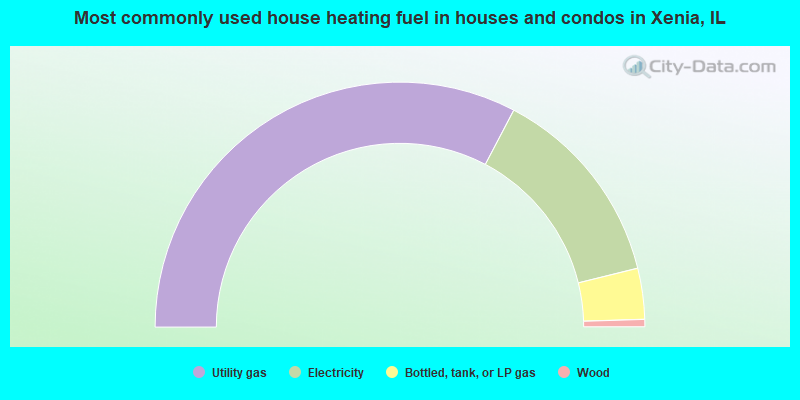
- 65.4%Utility gas
- 26.9%Electricity
- 6.7%Bottled, tank, or LP gas
- 1.0%Wood
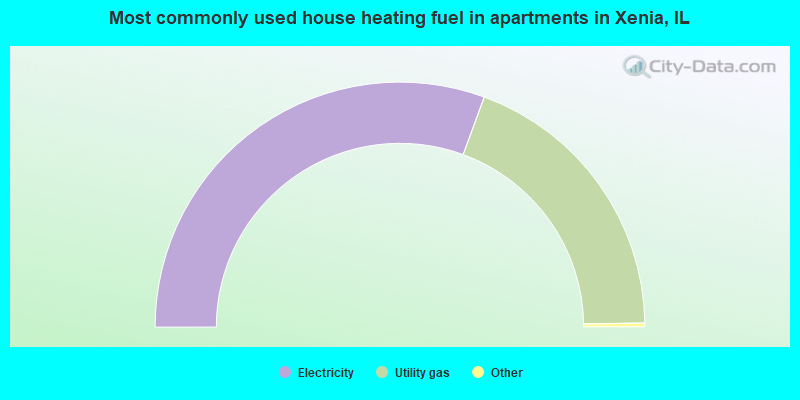
- 61.5%Electricity
- 38.5%Utility gas
Private vs. public school enrollment:
| Here: | 0.0% |
| Illinois: | 13.3% |
| Here: | 0.0% |
| Illinois: | 9.9% |
| Here: | 33.3% |
| Illinois: | 27.4% |


