Yosemite, CA (California) Houses and Residents
| Yosemite: | $252,449 |
| California: | $715,900 |
Total population: 2,373 (Urban population: 0, Rural population: 2,203 (all nonfarm))
Houses: 1,248 (525 occupied: 194 owner occupied, 331 renter occupied)
| % of renters here: | 63% |
| State: | 44% |
Housing density: 3 houses/condos per square mile
Median price asked for vacant for-sale houses and condos in 2022 in this county: $611,495.
Median contract rent in 2022: $819 (lower quartile is $508, upper quartile is $1,617)
Median rent asked for vacant for-rent units in 2022: $1,275
Median gross rent in Yosemite, CA in 2022: $1,019
Housing units in Yosemite with a mortgage: 37 (0 second mortgage, 0 home equity loan, 0 both second mortgage and home equity loan)
Houses without a mortgage: 82


Household type by relationship:
Households: 17,526- In family households: 14,085 (3,455 male householders, 1,493 female householders)
4,031 spouses, 3,924 children (3,529 natural, 159 adopted, 236 stepchildren), 306 grandchildren, 115 brothers or sisters, 146 parents, foster children, 137 other relatives, 368 non-relatives
- In nonfamily households: 3,441 (1,453 male householders (1,116 living alone)), 1,292 female householders (1,072 living alone)), 696 nonrelatives
- In group quarters: 725 (163 institutionalized population)
2,493 married couples with children.
812 single-parent households (269 men, 543 women).
92.8% of residents of Yosemite speak English at home.
6.3% of residents speak Spanish at home (100% speak English very well).
0.2% of residents speak other Indo-European language at home (100% speak English very well).
0.7% of residents speak other language at home (100% speak English very well).
Foreign born population: 45 (1.7%)
(75.6% of them are naturalized citizens)
| Here: | 4.8 |
| State: | 6.0 |
| Here: | 4.7 |
| State: | 3.9 |

- Bedrooms in owner-occupied houses and condos in Yosemite, California
- 0no bedroom
- 341 bedroom
- 992 bedrooms
- 463 bedrooms
- 04 bedrooms
- 155+ bedrooms

- Bedrooms in renter-occupied apartments in Yosemite, California
- 24no bedroom
- 1121 bedroom
- 982 bedrooms
- 723 bedrooms
- 254 bedrooms
- 05+ bedrooms

- Cars and other vehicles available in Yosemite in owner-occupied houses/condos
- 0no vehicle
- 551 vehicle
- 872 vehicles
- 433 vehicles
- 04 vehicles
- 95+ vehicles

- Cars and other vehicles available in Yosemite in renter-occupied apartments
- 17no vehicle
- 2001 vehicle
- 672 vehicles
- 313 vehicles
- 164 vehicles
- 05+ vehicles

- Rooms in owner-occupied houses in Yosemite, California
- 01 room
- 02 rooms
- 403 rooms
- 504 rooms
- 475 rooms
- 166 rooms
- 267 rooms
- 08 rooms
- 159+ rooms

- Rooms in renter-occupied apartments in Yosemite, California
- 161 room
- 392 rooms
- 453 rooms
- 704 rooms
- 725 rooms
- 436 rooms
- 467 rooms
- 08 rooms
- 09+ rooms


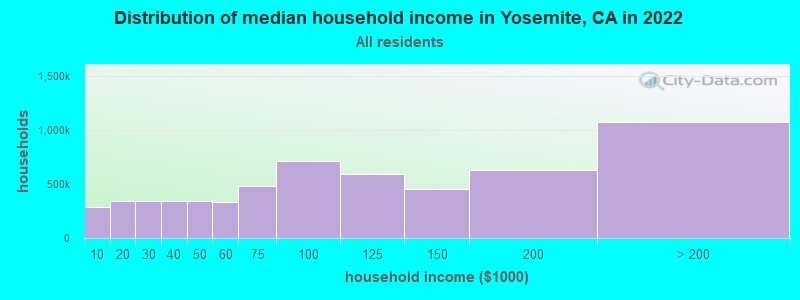
Yosemite, CA household income distribution

- 35,918Less than $10,000
- 45,219$10,000 to $19,999
- 46,652$20,000 to $29,999
- 45,042$30,000 to $39,999
- 45,815$40,000 to $49,999
- 40,432$50,000 to $59,999
- 60,743$60,000 to $74,999
- 80,036$75,000 to $99,999
- 71,007$100,000 to $124,999
- 52,458$125,000 to $149,999
- 72,556$150,000 to $199,999
- 110,587$200,000 or more
Percentage of workers working in this county: 97.6%
Number of people working at home: 244 (16.2% of all workers)
Travel time to work (commute)
- Less than 5 minutes: 324
- 5 to 9 minutes: 397
- 10 to 14 minutes: 133
- 15 to 19 minutes: 78
- 20 to 24 minutes: 38
- 25 to 29 minutes: 21
- 30 to 34 minutes: 52
- 35 to 39 minutes: 28
- 40 to 44 minutes: 34
- 45 to 59 minutes: 62
- 60 to 89 minutes: 49
- 90 or more minutes: 13
Means of transportation to work:
- Drove a car alone: 540 (42.9%)
- Carpooled: 105 (8.3%)
- Bus or trolley bus: 46 (3.7%)
- Motorcycle: 14 (1.1%)
- Bicycle: 66 (5.2%)
- Walked: 452 (35.9%)
- Other means: 6 (0.5%)
- Worked at home: 31 (2.5%)

- Year of entry for the foreign-born population in Yosemite, California
- 01995 to March 2000
- 01990 to 1994
- 01985 to 1989
- 01980 to 1984
- 01975 to 1979
- 01970 to 1974
- 191965 to 1969
- 14Before 1965
Most common places of birth for foreign-born residents (%):
| Yosemite: | 100.0% (33) |
| California: | 1.6% (141,181) |
Place of birth for U.S.-born residents:
- This state: 1,418
- Other state: 740
- Northeast: 123
- Midwest: 270
- South: 236
- West: 111
41% of Yosemite residents lived in the same house 5 years ago.
Out of people who lived in different houses, 32% lived in this county.
Out of people who lived in different counties, 73% lived in California.
Education attainment for males 25 years and older:
- No schooling: 72
- Nursery to 4th grade: 0
- 5th and 6th grade: 26
- 7th and 8th grade: 19
- 9th grade: 0
- 10th grade: 14
- 11th grade: 26
- 12th grade, no diploma: 19
- High school graduate (or equivalency): 217
- Less than 1 year of college: 53
- Some college more than 1 year, no degree: 179
- Associate degree: 131
- Bachelor's degree: 198
- Master's degree: 26
- Professional school degree: 25
- Doctorate degree: 0

Education attainment for females 25 years and older:
- No schooling: 0
- Nursery to 4th grade: 0
- 5th and 6th grade: 0
- 7th and 8th grade: 0
- 9th grade: 0
- 10th grade: 32
- 11th grade: 0
- 12th grade, no diploma: 24
- High school graduate (or equivalency): 150
- Less than 1 year of college: 32
- Some college more than 1 year, no degree: 138
- Associate degree: 48
- Bachelor's degree: 181
- Master's degree: 52
- Professional school degree: 7
- Doctorate degree: 0


Housing units in structures:
- One, detached: 937
- One, attached: 7
- Two: 57
- 3 or 4: 39
- 5 to 9: 67
- 10 to 19: 31
- 20 to 49: 58
- Mobile homes: 44
- Boats, RVs, vans, etc.: 8
Median worth of mobile homes: $37,054
Housing units lacking complete kitchen facilities: 1.1%

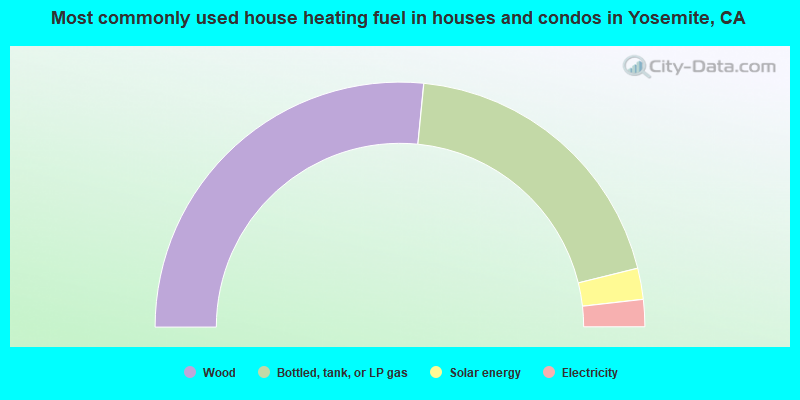
- 53.1%Wood
- 39.2%Bottled, tank, or LP gas
- 4.1%Solar energy
- 3.6%Electricity
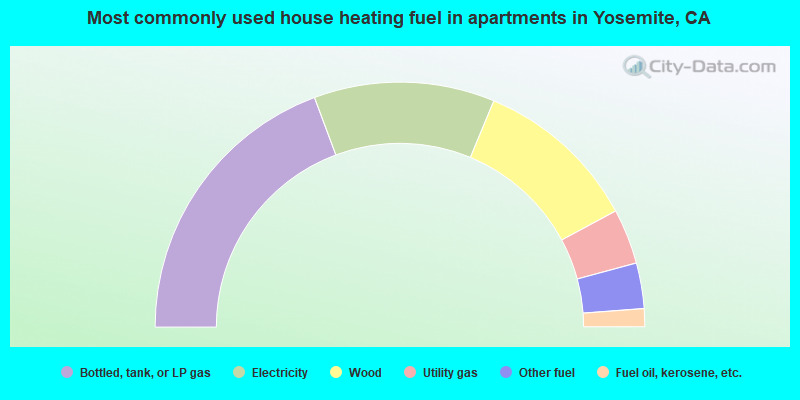
- 38.7%Bottled, tank, or LP gas
- 23.9%Electricity
- 21.8%Wood
- 7.3%Utility gas
- 6.0%Other fuel
- 2.4%Fuel oil, kerosene, etc.
Private vs. public school enrollment:
| Here: | 0.0% |
| California: | 9.9% |
| Here: | 6.3% |
| California: | 7.8% |
| Here: | 20.9% |
| California: | 15.4% |


