Barren Plains, Tennessee (TN) income map, earnings map, and wages data
The median household income in Barren Plains, TN in 2022 was $87,155, which was 25.1% greater than the median annual income of $65,254 across the entire state of Tennessee. Compared to the median income of $47,528 in 2000 this represents an increase of 45.5%. The per capita income in 2022 was $33,029, which means an increase of 44.5% compared to 2000 when it was $18,341.
Income statistics for all residents
Median household income in Barren Plains, TN in 2022:| Barren Plains: | $87,155 |
| State: | $65,254 |
Change in median household income between 2000 and 2022:| Barren Plains, Tennessee: | +83.4% |
| State: | +79.5% |
Number of households with income < $10k:| Barren Plains: | 3.4% (1,080) |
| State: | 5.4% (154,793) |
Number of households with income $10k - 20k:| Barren Plains: | 2.9% (910) |
| State: | 8.0% (228,599) |
Number of households with income $20k - 30k:| Barren Plains: | 3.6% (1,133) |
| State: | 7.9% (224,908) |
Number of households with income $30k - 40k:| Barren Plains: | 9.5% (3,015) |
| State: | 8.6% (244,297) |
Number of households with income $40k - 50k:| Barren Plains: | 7.5% (2,399) |
| Tennessee: | 8.4% (238,949) |
Number of households with income $50k - 60k:| Barren Plains: | 9.6% (3,050) |
| Tennessee: | 7.7% (218,438) |
Number of households with income $60k - 75k:| Barren Plains: | 10.9% (3,475) |
| State: | 10.3% (294,172) |
Number of households with income $75k - 100k:| Barren Plains: | 16.7% (5,324) |
| State: | 13.3% (377,310) |
Number of households with income $100k - 125k:| Barren Plains: | 17.2% (5,479) |
| State: | 9.5% (269,124) |
Number of households with income $125k - 150k:| Barren Plains: | 7.5% (2,401) |
| State: | 6.3% (178,328) |
Number of households with income $150k - 200k:| Barren Plains: | 6.4% (2,031) |
| State: | 7.2% (204,030) |
Number of households with income > $200k:| Barren Plains: | 5.0% (1,579) |
| Tennessee: | 7.5% (213,736) |
Aggregate household income in Barren Plains in 2022: $112,966,989
Median family income in Barren Plains in 2022:| Barren Plains: | $97,997 |
| State: | $80,910 |
Median non-family income in Barren Plains in 2022:| Barren Plains: | $54,332 |
| State: | $40,285 |
Median per capita income in Barren Plains in 2022:| Barren Plains: | $33,029 |
| State: | $36,704 |
Change in median per capita income between 2000 and 2022:| Barren Plains, Tennessee: | +80.1% |
| State: | +89.3% |
Income statistics for White residents
Median household income in Barren Plains, TN in 2022:| Barren Plains: | $84,478 |
| Tennessee: | $69,826 |
Change in median household income between 2000 and 2022:| Barren Plains, Tennessee: | +77.1% |
| Tennessee: | +82.9% |
Number of households with income < $10k:| Barren Plains: | 3.9% (1,046) |
| Tennessee: | 4.6% (100,279) |
Number of households with income $10k - 20k:| Barren Plains: | 3.3% (881) |
| Tennessee: | 7.6% (165,031) |
Number of households with income $20k - 30k:| Barren Plains: | 3.8% (1,012) |
| State: | 7.4% (160,229) |
Number of households with income $30k - 40k:| Barren Plains: | 10.0% (2,698) |
| Tennessee: | 8.1% (174,784) |
Number of households with income $40k - 50k:| Barren Plains: | 6.8% (1,841) |
| State: | 7.8% (169,622) |
Number of households with income $50k - 60k:| Barren Plains: | 9.5% (2,549) |
| State: | 7.6% (165,508) |
Number of households with income $60k - 75k:| Barren Plains: | 9.5% (2,569) |
| Tennessee: | 10.3% (223,937) |
Number of households with income $75k - 100k:| Barren Plains: | 17.5% (4,713) |
| State: | 13.5% (292,688) |
Number of households with income $100k - 125k:| Barren Plains: | 16.1% (4,348) |
| State: | 10.1% (219,251) |
Number of households with income $125k - 150k:| Barren Plains: | 7.2% (1,936) |
| State: | 6.6% (142,574) |
Number of households with income $150k - 200k:| Barren Plains: | 6.9% (1,855) |
| State: | 7.7% (166,039) |
Number of households with income > $200k:| Barren Plains: | 5.5% (1,475) |
| Tennessee: | 8.5% (184,546) |
Aggregate household income in Barren Plains in 2022: $100,617,511
Median family income in Barren Plains in 2022:| Barren Plains: | $93,948 |
| State: | $86,015 |
Number of families with income $10k - 20k:| Barren Plains: | 4.5% (38) |
| Tennessee: | 3.5% (49,925) |
Number of families with income $20k - 30k:| Barren Plains: | 2.9% (24) |
| Tennessee: | 5.0% (70,431) |
Number of families with income $30k - 40k:| Barren Plains: | 6.1% (51) |
| State: | 6.6% (93,498) |
Number of families with income $40k - 50k:| Barren Plains: | 4.0% (34) |
| State: | 6.8% (96,726) |
Number of families with income $50k - 60k:| Barren Plains: | 8.1% (68) |
| State: | 7.2% (101,879) |
Number of families with income $60k - 75k:| Barren Plains: | 9.7% (82) |
| State: | 10.7% (151,997) |
Number of families with income $75k - 100k:| Barren Plains: | 29.6% (249) |
| Tennessee: | 15.4% (218,373) |
Number of families with income $100k - 125k:| Barren Plains: | 14.0% (118) |
| State: | 12.6% (178,761) |
Number of families with income $125k - 150k:| Barren Plains: | 11.9% (100) |
| Tennessee: | 8.2% (116,575) |
Number of families with income $150k - 200k:| Barren Plains: | 3.6% (30) |
| State: | 9.9% (141,123) |
Number of families with income > $200k:| Barren Plains: | 5.7% (48) |
| Tennessee: | 11.2% (159,431) |
Median non-family income in Barren Plains in 2022:| Barren Plains: | $50,204 |
| Tennessee: | $41,178 |
Change in median non-family income between 2000 and 2022:| Barren Plains, Tennessee: | +133.3% |
| State: | +91.1% |
Median per capita income in Barren Plains in 2022:| Barren Plains: | $34,686 |
| Tennessee: | $40,126 |
Change in median per capita income between 2000 and 2022:| Barren Plains, Tennessee: | +86.5% |
| State: | +92.6% |
Income statistics for Black or African American residents
Median household income in Barren Plains, TN in 2022:| Barren Plains: | $97,992 |
| State: | $49,531 |
Number of households with income < $10k:| Barren Plains: | 9.1% (21,189) |
| State: | 9.1% (39,909) |
Number of households with income $10k - 20k:| Barren Plains: | 10.5% (24,510) |
| State: | 10.5% (46,276) |
Number of households with income $20k - 30k:| Barren Plains: | 10.2% (23,908) |
| State: | 10.2% (45,072) |
Number of households with income $30k - 40k:| Barren Plains: | 10.0% (23,243) |
| State: | 10.0% (43,885) |
Number of households with income $40k - 50k:| Barren Plains: | 10.7% (25,082) |
| Tennessee: | 10.7% (47,267) |
Number of households with income $50k - 60k:| Barren Plains: | 7.7% (17,951) |
| Tennessee: | 7.7% (33,868) |
Number of households with income $60k - 75k:| Barren Plains: | 10.5% (24,515) |
| State: | 10.5% (46,247) |
Number of households with income $75k - 100k:| Barren Plains: | 12.6% (29,374) |
| State: | 12.6% (55,465) |
Number of households with income $100k - 125k:| Barren Plains: | 6.7% (15,608) |
| Tennessee: | 6.7% (29,515) |
Number of households with income $125k - 150k:| Barren Plains: | 4.8% (11,280) |
| State: | 4.8% (21,306) |
Number of households with income $150k - 200k:| Barren Plains: | 4.6% (10,778) |
| State: | 4.6% (20,425) |
Number of households with income > $200k:| Barren Plains: | 2.5% (5,903) |
| State: | 2.5% (11,183) |
Aggregate household income in Barren Plains in 2022: $2,116,227
Median family income in Barren Plains in 2022:| Barren Plains: | $151,533 |
| State: | $61,153 |
Number of families with income < $10k:| Barren Plains: | 11.8% (3) |
| State: | 7.9% (20,476) |
Number of families with income $10k - 20k:| Barren Plains: | 6.1% (2) |
| Tennessee: | 6.0% (15,530) |
Number of families with income $20k - 30k:| Barren Plains: | 8.1% (2) |
| Tennessee: | 8.6% (22,263) |
Number of families with income $50k - 60k:| Barren Plains: | 35.6% (10) |
| State: | 6.9% (17,798) |
Number of families with income $60k - 75k:| Barren Plains: | 38.4% (10) |
| State: | 11.6% (30,015) |
Median non-family income in Barren Plains in 2022:| Barren Plains: | $83,628 |
| State: | $35,793 |
Median per capita income in Barren Plains in 2022:| Barren Plains: | $22,799 |
| State: | $27,306 |
Change in median per capita income between 2000 and 2022:| Barren Plains, Tennessee: | +101.2% |
| State: | +105.3% |
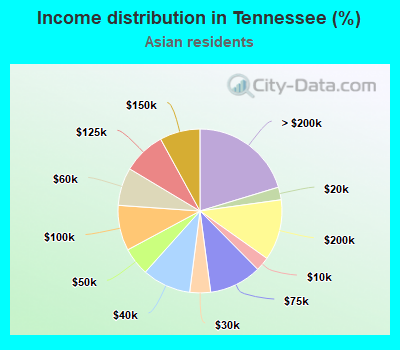
Income statistics for Asian residents
Number of households with income < $10k:| Barren Plains: | 2.5% (1) |
| State: | 2.8% (1,217) |
Number of households with income $10k - 20k:| Barren Plains: | 2.5% (1) |
| Tennessee: | 2.5% (1,093) |
Number of households with income $20k - 30k:| Barren Plains: | 5.0% (2) |
| State: | 4.1% (1,796) |
Number of households with income $30k - 40k:| Barren Plains: | 10.0% (4) |
| Tennessee: | 9.6% (4,208) |
Number of households with income $40k - 50k:| Barren Plains: | 5.0% (2) |
| State: | 5.5% (2,423) |
Number of households with income $50k - 60k:| Barren Plains: | 7.5% (3) |
| State: | 7.5% (3,277) |
Number of households with income $60k - 75k:| Barren Plains: | 10.0% (4) |
| Tennessee: | 10.3% (4,520) |
Number of households with income $75k - 100k:| Barren Plains: | 10.0% (4) |
| Tennessee: | 9.0% (3,926) |
Number of households with income $100k - 125k:| Barren Plains: | 7.5% (3) |
| Tennessee: | 8.4% (3,699) |
Number of households with income $125k - 150k:| Barren Plains: | 7.5% (3) |
| State: | 8.0% (3,488) |
Number of households with income $150k - 200k:| Barren Plains: | 12.5% (5) |
| Tennessee: | 12.0% (5,262) |
Number of households with income > $200k:| Barren Plains: | 20.0% (8) |
| State: | 20.3% (8,903) |
Aggregate household income in Barren Plains in 2022: $4,237,707
Median per capita income in Barren Plains in 2022:| Barren Plains: | $62,772 |
| Tennessee: | $46,931 |
Change in median per capita income between 2000 and 2022:| Barren Plains, Tennessee: | +84.4% |
| State: | +130.8% |
Income statistics for Hispanic or Latino residents
Median household income in Barren Plains, TN in 2022:| Barren Plains: | $42,897 |
| Tennessee: | $58,385 |
Change in median household income between 2000 and 2022:| Barren Plains, Tennessee: | +86.8% |
| State: | +82.3% |
Number of households with income < $10k:| Barren Plains: | 7.2% (3,079) |
| State: | 7.2% (8,567) |
Number of households with income $10k - 20k:| Barren Plains: | 6.4% (2,747) |
| State: | 6.4% (7,670) |
Number of households with income $20k - 30k:| Barren Plains: | 9.4% (4,020) |
| State: | 9.4% (11,247) |
Number of households with income $30k - 40k:| Barren Plains: | 10.1% (4,319) |
| State: | 10.1% (12,072) |
Number of households with income $40k - 50k:| Barren Plains: | 10.0% (4,281) |
| Tennessee: | 10.0% (11,947) |
Number of households with income $50k - 60k:| Barren Plains: | 8.0% (3,428) |
| Tennessee: | 8.0% (9,569) |
Number of households with income $60k - 75k:| Barren Plains: | 10.3% (4,406) |
| State: | 10.3% (12,315) |
Number of households with income $75k - 100k:| Barren Plains: | 15.3% (6,568) |
| State: | 15.3% (18,285) |
Number of households with income $100k - 125k:| Barren Plains: | 8.3% (3,561) |
| State: | 8.3% (9,886) |
Number of households with income $125k - 150k:| Barren Plains: | 5.9% (2,538) |
| State: | 5.9% (7,066) |
Number of households with income $150k - 200k:| Barren Plains: | 4.9% (2,087) |
| State: | 4.9% (5,822) |
Number of households with income > $200k:| Barren Plains: | 4.5% (1,913) |
| Tennessee: | 4.5% (5,337) |
Aggregate household income in Barren Plains in 2022: $2,355,793
Median family income in Barren Plains in 2022:| Barren Plains: | $69,816 |
| Tennessee: | $64,014 |
Number of families with income $10k - 20k:| Barren Plains: | 6.0% (3) |
| State: | 5.4% (4,773) |
Number of families with income $20k - 30k:| Barren Plains: | 7.8% (3) |
| Tennessee: | 9.2% (8,233) |
Number of families with income $30k - 40k:| Barren Plains: | 9.7% (4) |
| State: | 9.6% (8,514) |
Number of families with income $40k - 50k:| Barren Plains: | 8.2% (4) |
| State: | 8.8% (7,850) |
Number of families with income $50k - 60k:| Barren Plains: | 7.4% (3) |
| Tennessee: | 7.9% (7,017) |
Number of families with income $60k - 75k:| Barren Plains: | 11.1% (5) |
| Tennessee: | 10.8% (9,605) |
Number of families with income $75k - 100k:| Barren Plains: | 32.9% (14) |
| Tennessee: | 16.6% (14,820) |
Number of families with income $100k - 125k:| Barren Plains: | 7.3% (3) |
| Tennessee: | 8.4% (7,480) |
Number of families with income $125k - 150k:| Barren Plains: | 5.1% (2) |
| State: | 6.3% (5,594) |
Number of families with income $150k - 200k:| Barren Plains: | 2.0% (1) |
| State: | 5.4% (4,817) |
Number of families with income > $200k:| Barren Plains: | 2.6% (1) |
| Tennessee: | 5.1% (4,577) |
Median non-family income in Barren Plains in 2022:| Barren Plains: | $21,135 |
| State: | $39,279 |
Median per capita income in Barren Plains in 2022:| Barren Plains: | $20,963 |
| State: | $21,276 |
Change in median per capita income between 2000 and 2022:| Barren Plains, Tennessee: | +97.5% |
| State: | +76.0% |
Income statistics for other residents
Number of households with income < $10k:| Barren Plains: | 6.8% (2,971) |
| Tennessee: | 6.8% (2,986) |
Number of households with income $10k - 20k:| Barren Plains: | 6.3% (2,763) |
| Tennessee: | 6.3% (2,777) |
Number of households with income $20k - 30k:| Barren Plains: | 9.2% (4,022) |
| State: | 9.2% (4,034) |
Number of households with income $30k - 40k:| Barren Plains: | 13.2% (5,805) |
| Tennessee: | 13.2% (5,819) |
Number of households with income $40k - 50k:| Barren Plains: | 11.9% (5,215) |
| Tennessee: | 11.9% (5,244) |
Number of households with income $50k - 60k:| Barren Plains: | 7.3% (3,228) |
| Tennessee: | 7.3% (3,232) |
Number of households with income $60k - 75k:| Barren Plains: | 12.2% (5,351) |
| State: | 12.2% (5,384) |
Number of households with income $75k - 100k:| Barren Plains: | 13.1% (5,745) |
| Tennessee: | 13.1% (5,771) |
Number of households with income $100k - 125k:| Barren Plains: | 7.8% (3,446) |
| State: | 7.8% (3,429) |
Number of households with income $125k - 150k:| Barren Plains: | 4.3% (1,875) |
| Tennessee: | 4.3% (1,881) |
Number of households with income $150k - 200k:| Barren Plains: | 3.4% (1,486) |
| State: | 3.4% (1,486) |
Number of households with income > $200k:| Barren Plains: | 4.6% (2,040) |
| State: | 4.6% (2,040) |
Median per capita income in Barren Plains in 2022:| Barren Plains: | $31,430 |
| Tennessee: | $21,430 |
Change in median per capita income between 2000 and 2022:| Barren Plains, Tennessee: | +51.1% |
| State: | +105.6% |