The median household income in Bay City, TX in 2022 was $49,695, which was 45.5% less than the median annual income of $72,284 across the entire state of Texas. Compared to the median income of $30,446 in 2000 this represents an increase of 38.7%. The per capita income in 2022 was $26,865, which means an increase of 43.1% compared to 2000 when it was $15,284.
Whole page based on the data from 2000 / 2022 when the population of Bay City, Texas was 18,667 / 18,349
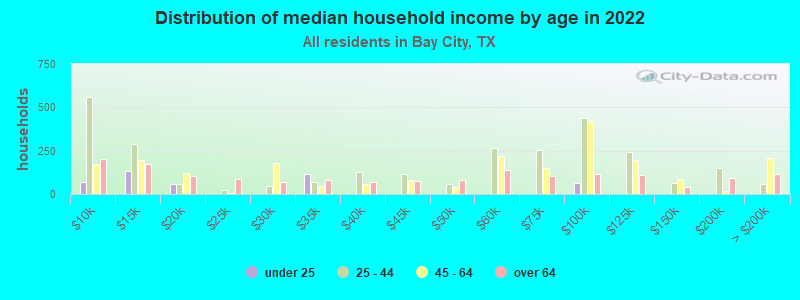
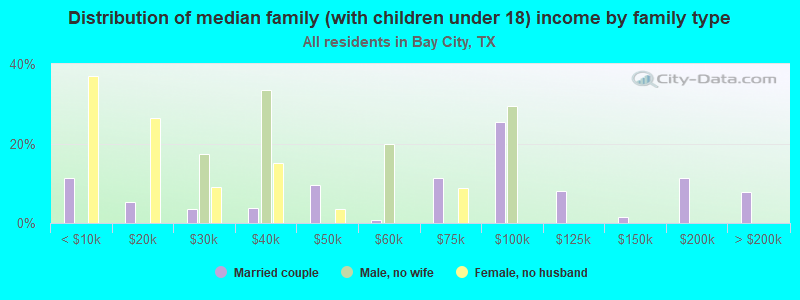
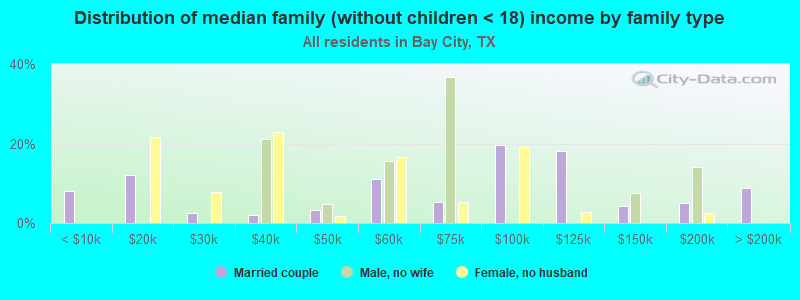
Income statistics for all residents
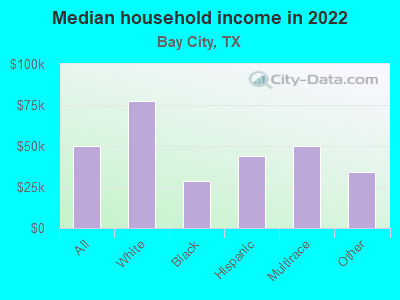
Median household income in Bay City, TX in 2022:
Bay City:
$49,696
State:
$72,284
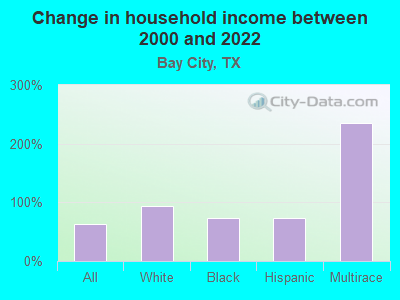
Change in median household income between 2000 and 2022:
Bay City, Texas:
+63.2%
State:
+81.0%
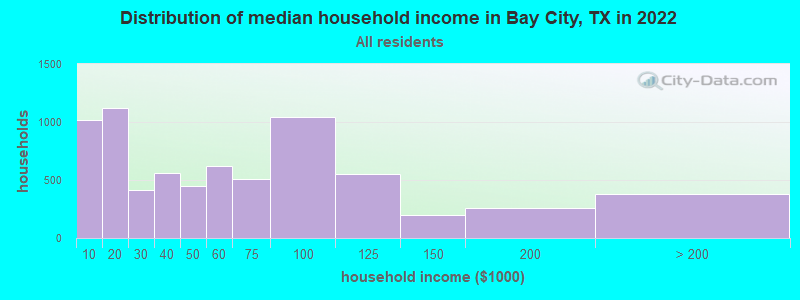
Number of households with income < $10k:
Bay City:
14.3% (1,015)
Texas:
5.5% (611,011)
Number of households with income $10k - 20k:
Bay City:
15.8% (1,122)
Texas:
6.7% (743,157)
Number of households with income $20k - 30k:
Bay City:
5.8% (411)
Texas:
7.2% (803,381)
Number of households with income $30k - 40k:
Bay City:
7.9% (561)
State:
7.8% (866,080)
Number of households with income $40k - 50k:
Bay City:
6.3% (451)
State:
7.3% (810,440)
Number of households with income $50k - 60k:
Bay City:
8.8% (624)
Texas:
7.2% (799,783)
Number of households with income $60k - 75k:
Bay City:
7.2% (509)
State:
9.9% (1,095,384)
Number of households with income $75k - 100k:
Bay City:
14.6% (1,040)
Texas:
12.8% (1,419,057)
Number of households with income $100k - 125k:
Bay City:
7.7% (548)
State:
9.5% (1,054,577)
Number of households with income $125k - 150k:
Bay City:
2.8% (197)
Texas:
6.7% (741,518)
Number of households with income $150k - 200k:
Bay City:
3.6% (259)
State:
8.7% (961,776)
Number of households with income > $200k:
Bay City:
5.3% (379)
State:
10.7% (1,181,544)
Aggregate household income in Bay City in 2022: $481,958,705
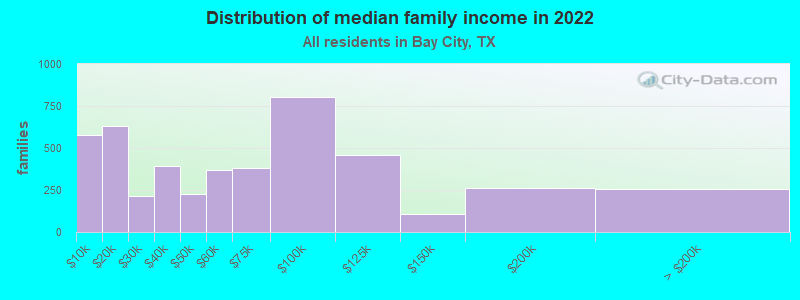
Median family income in Bay City in 2022:
Bay City:
$57,121
State:
$86,267
Number of families with income < $10k:
Bay City:
12.3% (575)
State:
4.0% (297,884)
Number of families with income $10k - 20k:
Bay City:
13.5% (629)
State:
4.3% (324,514)
Number of families with income $20k - 30k:
Bay City:
4.6% (216)
State:
5.8% (430,949)
Number of families with income $30k - 40k:
Bay City:
8.4% (394)
State:
6.6% (493,535)
Number of families with income $40k - 50k:
Bay City:
4.8% (225)
Texas:
6.7% (499,663)
Number of families with income $50k - 60k:
Bay City:
7.9% (370)
State:
6.6% (492,203)
Number of families with income $60k - 75k:
Bay City:
8.1% (380)
State:
9.5% (710,229)
Number of families with income $75k - 100k:
Bay City:
17.1% (802)
State:
13.6% (1,015,480)
Number of families with income $100k - 125k:
Bay City:
9.8% (459)
State:
10.7% (797,961)
Number of families with income $125k - 150k:
Bay City:
2.3% (109)
State:
8.1% (602,985)
Number of families with income $150k - 200k:
Bay City:
5.6% (260)
State:
10.7% (804,459)
Number of families with income > $200k:
Bay City:
5.5% (258)
State:
13.5% (1,013,514)
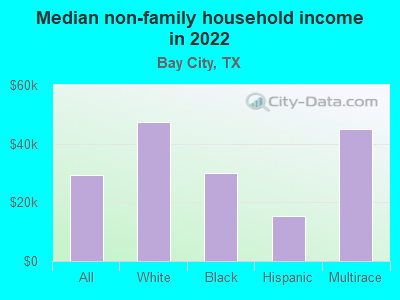
Median non-family income in Bay City in 2022:
Bay City:
$29,228
State:
$45,999
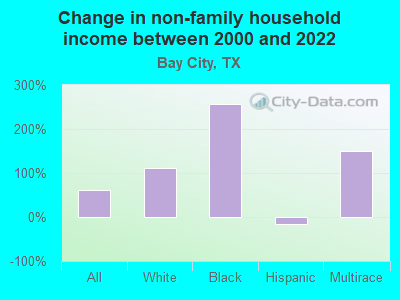
Change in median non-family income between 2000 and 2022:
Bay City, Texas:
+62.1%
Texas:
+79.5%
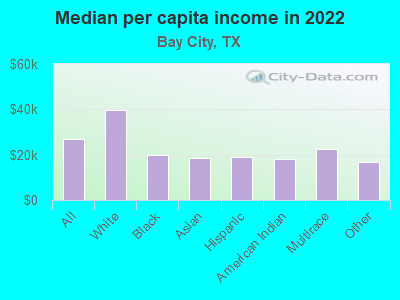
Median per capita income in Bay City in 2022:
Bay City:
$26,865
State:
$38,123
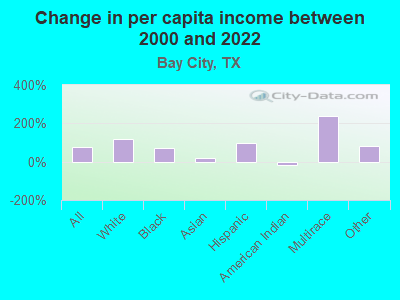
Change in median per capita income between 2000 and 2022:
Bay City, Texas:
+75.8%
State:
+94.3%
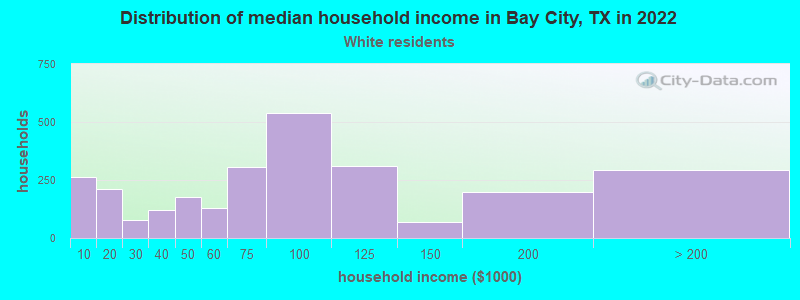
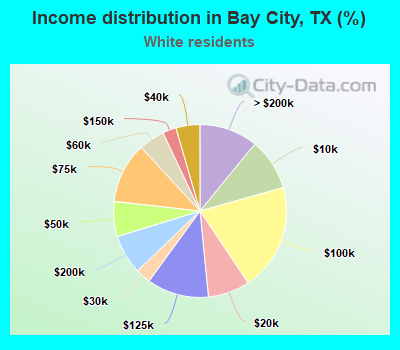
Income statistics for White residents
Median household income in Bay City, TX in 2022:
Bay City:
$77,393
State:
$82,032
Change in median household income between 2000 and 2022:
Bay City, Texas:
+94.3%
State:
+91.0%
Number of households with income < $10k:
Bay City:
9.7% (262)
State:
4.7% (273,716)
Number of households with income $10k - 20k:
Bay City:
7.8% (211)
State:
5.5% (322,702)
Number of households with income $20k - 30k:
Bay City:
2.9% (77)
State:
6.2% (363,947)
Number of households with income $30k - 40k:
Bay City:
4.5% (121)
Texas:
6.8% (399,275)
Number of households with income $40k - 50k:
Bay City:
6.6% (177)
State:
6.5% (383,417)
Number of households with income $50k - 60k:
Bay City:
4.9% (131)
State:
6.6% (388,535)
Number of households with income $60k - 75k:
Bay City:
11.3% (306)
State:
9.7% (566,295)
Number of households with income $75k - 100k:
Bay City:
20.0% (539)
State:
13.0% (760,276)
Number of households with income $100k - 125k:
Bay City:
11.6% (312)
State:
10.2% (597,596)
Number of households with income $125k - 150k:
Bay City:
2.5% (68)
State:
7.4% (436,830)
Number of households with income $150k - 200k:
Bay City:
7.4% (199)
Texas:
9.9% (583,067)
Number of households with income > $200k:
Bay City:
10.9% (295)
Texas:
13.5% (792,647)
Aggregate household income in Bay City in 2022: $267,910,272
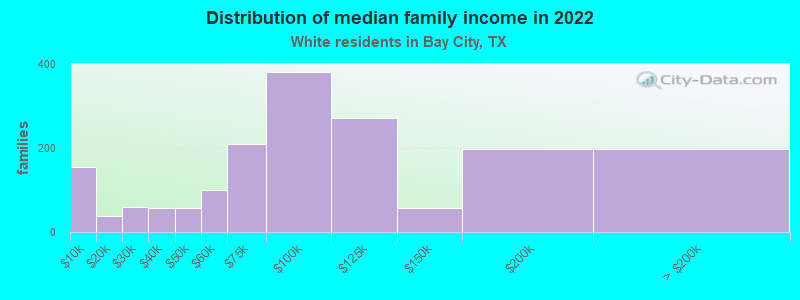
Median family income in Bay City in 2022:
Bay City:
$84,660
State:
$101,788
Number of families with income < $10k:
Bay City:
8.6% (154)
State:
2.8% (108,142)
Number of families with income $10k - 20k:
Bay City:
2.1% (37)
State:
2.9% (113,421)
Number of families with income $20k - 30k:
Bay City:
3.3% (59)
State:
4.1% (157,688)
Number of families with income $30k - 40k:
Bay City:
3.3% (58)
State:
5.2% (198,847)
Number of families with income $40k - 50k:
Bay City:
3.2% (57)
Texas:
5.6% (216,490)
Number of families with income $50k - 60k:
Bay City:
5.6% (99)
State:
5.7% (220,689)
Number of families with income $60k - 75k:
Bay City:
11.8% (210)
State:
9.0% (346,106)
Number of families with income $75k - 100k:
Bay City:
21.4% (380)
State:
13.7% (527,363)
Number of families with income $100k - 125k:
Bay City:
15.3% (271)
State:
11.6% (448,411)
Number of families with income $125k - 150k:
Bay City:
3.2% (56)
State:
9.2% (355,798)
Number of families with income $150k - 200k:
Bay City:
11.1% (198)
Texas:
12.5% (480,185)
Number of families with income > $200k:
Bay City:
11.1% (197)
Texas:
17.6% (677,490)
Median non-family income in Bay City in 2022:
Bay City:
$47,313
Texas:
$50,587
Change in median non-family income between 2000 and 2022:
Bay City, Texas:
+111.9%
Texas:
+87.7%
Median per capita income in Bay City in 2022:
Bay City:
$39,703
State:
$47,740
Change in median per capita income between 2000 and 2022:
Bay City, Texas:
+115.7%
Texas:
+114.3%
Income statistics for Black or African American residents
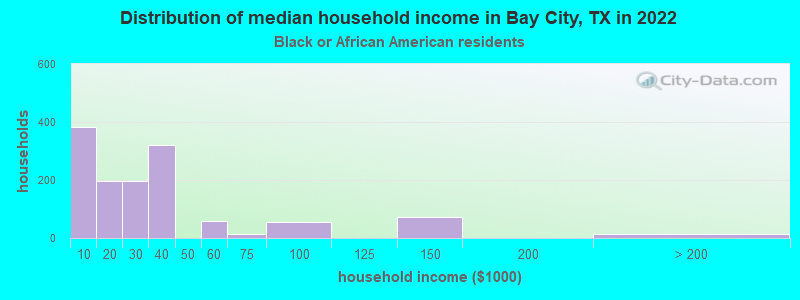
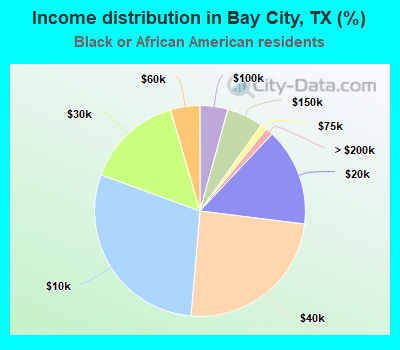
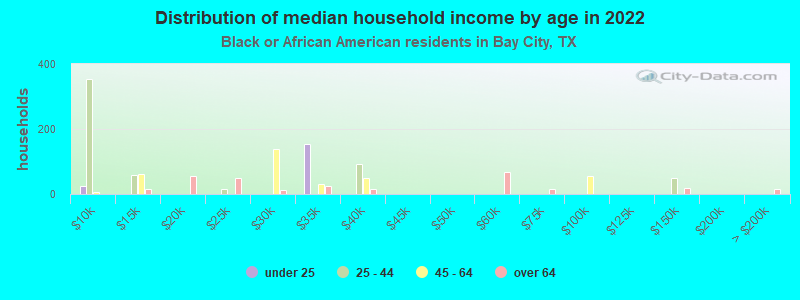
Median household income in Bay City, TX in 2022:
Bay City:
$28,358
State:
$55,759
Change in median household income between 2000 and 2022:
Bay City, Texas:
+73.2%
Texas:
+90.3%
Number of households with income < $10k:
Bay City:
29.2% (382)
State:
8.9% (126,378)
Number of households with income $10k - 20k:
Bay City:
15.0% (196)
State:
9.9% (140,369)
Number of households with income $20k - 30k:
Bay City:
14.9% (195)
Texas:
8.5% (120,639)
Number of households with income $30k - 40k:
Bay City:
24.4% (319)
State:
9.7% (137,517)
Number of households with income $40k - 50k:
Bay City:
0.0% (0)
State:
8.0% (112,973)
Number of households with income $50k - 60k:
Bay City:
4.5% (59)
State:
8.3% (117,156)
Number of households with income $60k - 75k:
Bay City:
1.0% (13)
Texas:
10.4% (147,462)
Number of households with income $75k - 100k:
Bay City:
4.3% (56)
State:
11.5% (162,718)
Number of households with income $100k - 125k:
Bay City:
0.0% (0)
Texas:
8.2% (115,829)
Number of households with income $125k - 150k:
Bay City:
5.6% (73)
Texas:
4.9% (69,556)
Number of households with income $150k - 200k:
Bay City:
0.0% (0)
Texas:
6.4% (90,701)
Number of households with income > $200k:
Bay City:
1.1% (15)
State:
5.5% (77,988)
Aggregate household income in Bay City in 2022: $48,171,020
Median non-family income in Bay City in 2022:
Bay City:
$29,889
Texas:
$40,133
Median per capita income in Bay City in 2022:
Bay City:
$19,636
Texas:
$30,490
Change in median per capita income between 2000 and 2022:
Bay City, Texas:
+70.5%
State:
+113.9%
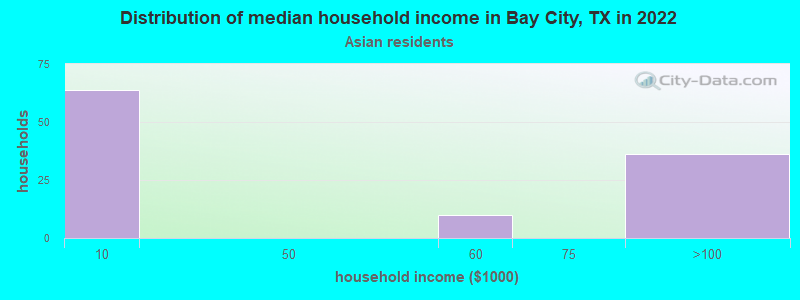
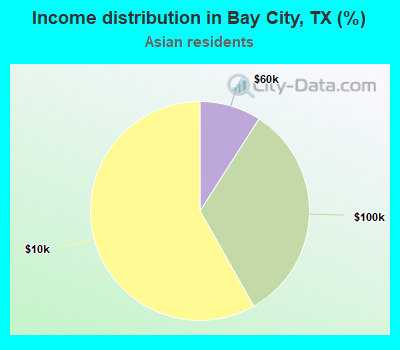
Income statistics for Asian residents
Number of households with income < $10k:
Bay City:
58.2% (64)
Texas:
5.2% (29,885)
Number of households with income $10k - 20k:
Bay City:
0.0% (0)
State:
4.7% (27,044)
Number of households with income $20k - 30k:
Bay City:
0.0% (0)
State:
4.1% (23,363)
Number of households with income $30k - 40k:
Bay City:
0.0% (0)
State:
4.1% (23,309)
Number of households with income $40k - 50k:
Bay City:
0.0% (0)
State:
5.2% (29,826)
Number of households with income $50k - 60k:
Bay City:
9.1% (10)
Texas:
4.7% (26,512)
Number of households with income $60k - 75k:
Bay City:
0.0% (0)
Texas:
6.5% (36,905)
Number of households with income $75k - 100k:
Bay City:
32.7% (36)
State:
11.3% (64,350)
Number of households with income $100k - 125k:
Bay City:
0.0% (0)
State:
11.4% (64,714)
Number of households with income $125k - 150k:
Bay City:
0.0% (0)
Texas:
9.3% (52,719)
Number of households with income $150k - 200k:
Bay City:
0.0% (0)
Texas:
12.5% (70,953)
Number of households with income > $200k:
Bay City:
0.0% (0)
State:
21.1% (120,260)
Aggregate household income in Bay City in 2022: $3,943,440
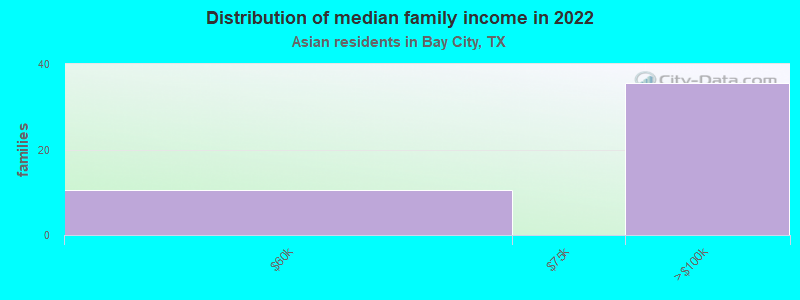
Median family income in Bay City in 2022:
Bay City:
$81,869
State:
$123,328
Number of families with income $50k - 60k:
Bay City:
23.0% (11)
State:
4.7% (20,568)
Number of families with income $75k - 100k:
Bay City:
77.0% (36)
State:
10.7% (46,626)
Median per capita income in Bay City in 2022:
Bay City:
$18,720
Texas:
$48,626
Change in median per capita income between 2000 and 2022:
Bay City, Texas:
+21.0%
State:
+132.0%
Income statistics for Hispanic or Latino residents
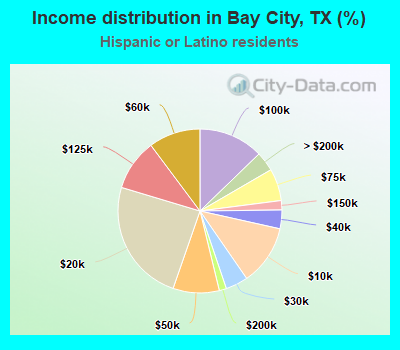
Median household income in Bay City, TX in 2022:
Bay City:
$43,806
State:
$60,504
Change in median household income between 2000 and 2022:
Bay City, Texas:
+74.0%
Texas:
+102.5%
Number of households with income < $10k:
Bay City:
11.9% (392)
State:
5.8% (213,953)
Number of households with income $10k - 20k:
Bay City:
24.3% (803)
State:
8.0% (297,456)
Number of households with income $20k - 30k:
Bay City:
4.4% (146)
Texas:
9.2% (340,166)
Number of households with income $30k - 40k:
Bay City:
3.7% (122)
State:
9.5% (354,336)
Number of households with income $40k - 50k:
Bay City:
9.1% (301)
State:
8.8% (327,013)
Number of households with income $50k - 60k:
Bay City:
10.2% (337)
State:
8.3% (308,818)
Number of households with income $60k - 75k:
Bay City:
6.3% (209)
State:
10.9% (405,109)
Number of households with income $75k - 100k:
Bay City:
12.8% (422)
State:
13.8% (511,639)
Number of households with income $100k - 125k:
Bay City:
10.1% (335)
Texas:
8.6% (319,728)
Number of households with income $125k - 150k:
Bay City:
1.8% (61)
State:
5.7% (210,932)
Number of households with income $150k - 200k:
Bay City:
1.4% (47)
State:
6.4% (236,055)
Number of households with income > $200k:
Bay City:
3.8% (127)
State:
5.1% (189,259)
Aggregate household income in Bay City in 2022: $191,592,691
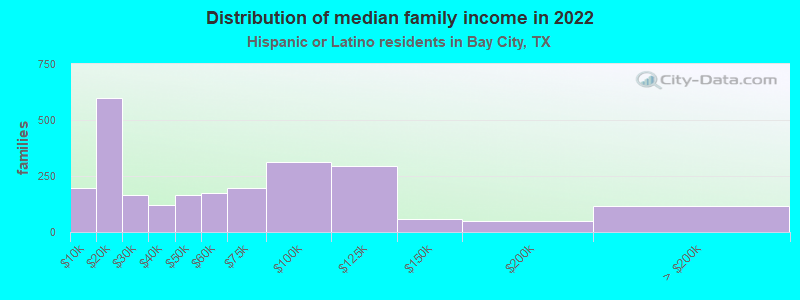
Median family income in Bay City in 2022:
Bay City:
$47,029
State:
$65,080
Number of families with income < $10k:
Bay City:
8.0% (197)
Texas:
5.3% (147,493)
Number of families with income $10k - 20k:
Bay City:
24.5% (600)
State:
6.3% (174,531)
Number of families with income $20k - 30k:
Bay City:
6.6% (163)
State:
8.6% (238,528)
Number of families with income $30k - 40k:
Bay City:
4.9% (120)
Texas:
9.1% (251,999)
Number of families with income $40k - 50k:
Bay City:
6.8% (166)
State:
8.6% (240,188)
Number of families with income $50k - 60k:
Bay City:
7.2% (176)
Texas:
8.0% (223,566)
Number of families with income $60k - 75k:
Bay City:
8.0% (197)
State:
10.9% (302,688)
Number of families with income $75k - 100k:
Bay City:
12.8% (314)
State:
14.3% (398,554)
Number of families with income $100k - 125k:
Bay City:
12.1% (296)
Texas:
9.5% (264,007)
Number of families with income $125k - 150k:
Bay City:
2.4% (59)
Texas:
6.2% (171,274)
Number of families with income $150k - 200k:
Bay City:
2.0% (50)
State:
7.3% (202,259)
Number of families with income > $200k:
Bay City:
4.7% (114)
State:
5.9% (165,129)
Median non-family income in Bay City in 2022:
Bay City:
$15,460
State:
$39,934
Change in median non-family income between 2000 and 2022:: -16.4%
Bay City, Texas:
-16.4%
Texas:
+109.1%
Median per capita income in Bay City in 2022:
Bay City:
$18,800
State:
$24,862
Change in median per capita income between 2000 and 2022:
Bay City, Texas:
+97.7%
State:
+130.8%
Income statistics for American Indian and Alaska Native residents
Number of households with income < $10k:
Bay City:
0.0% (0)
State:
4.1% (3,398)
Number of households with income $10k - 20k:
Bay City:
0.0% (0)
Texas:
8.3% (6,949)
Number of households with income $20k - 30k:
Bay City:
0.0% (0)
State:
9.3% (7,742)
Number of households with income $30k - 40k:
Bay City:
0.0% (0)
State:
9.1% (7,627)
Number of households with income $40k - 50k:
Bay City:
0.0% (0)
Texas:
7.1% (5,922)
Number of households with income $50k - 60k:
Bay City:
0.0% (0)
State:
8.1% (6,761)
Number of households with income $60k - 75k:
Bay City:
100.0% (20)
State:
12.7% (10,588)
Number of households with income $75k - 100k:
Bay City:
0.0% (0)
State:
13.0% (10,903)
Number of households with income $100k - 125k:
Bay City:
0.0% (0)
State:
9.9% (8,256)
Number of households with income $125k - 150k:
Bay City:
0.0% (0)
Texas:
5.2% (4,355)
Number of households with income $150k - 200k:
Bay City:
0.0% (0)
State:
6.7% (5,623)
Number of households with income > $200k:
Bay City:
0.0% (0)
Texas:
6.6% (5,522)
Aggregate household income in Bay City in 2022: $1,407,615
Median per capita income in Bay City in 2022:
Bay City:
$18,278
State:
$28,166
Change in median per capita income between 2000 and 2022:: -14.6%
Bay City, Texas:
-14.6%
State:
+77.2%
Income statistics for Multirace residents
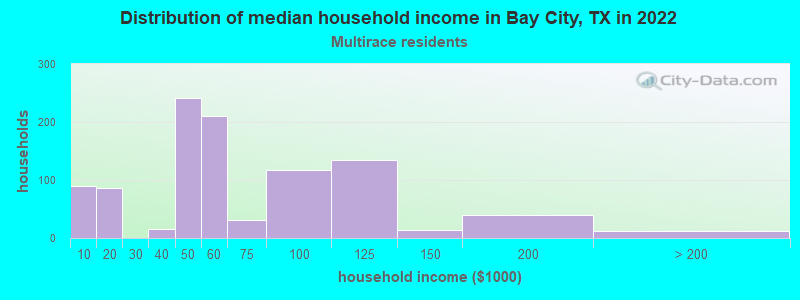
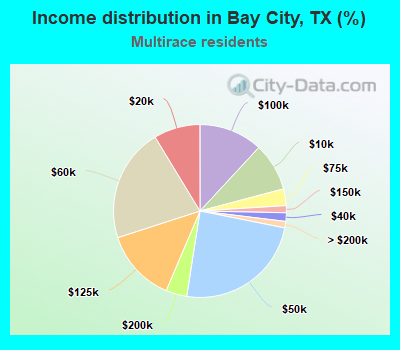
Median household income in Bay City, TX in 2022:
Bay City:
$49,699
Texas:
$62,748
Number of households with income < $10k:
Bay City:
9.0% (89)
State:
5.5% (122,324)
Number of households with income $10k - 20k:
Bay City:
8.7% (86)
Texas:
8.2% (182,232)
Number of households with income $20k - 30k:
Bay City:
0.0% (0)
State:
8.5% (189,456)
Number of households with income $30k - 40k:
Bay City:
1.6% (16)
Texas:
8.9% (197,499)
Number of households with income $40k - 50k:
Bay City:
24.3% (241)
State:
8.7% (191,735)
Number of households with income $50k - 60k:
Bay City:
21.3% (211)
Texas:
8.0% (177,535)
Number of households with income $60k - 75k:
Bay City:
3.1% (31)
State:
10.5% (232,479)
Number of households with income $75k - 100k:
Bay City:
11.9% (118)
State:
13.1% (290,448)
Number of households with income $100k - 125k:
Bay City:
13.6% (135)
State:
8.6% (191,595)
Number of households with income $125k - 150k:
Bay City:
1.3% (13)
State:
6.0% (133,361)
Number of households with income $150k - 200k:
Bay City:
3.9% (39)
Texas:
7.2% (159,195)
Number of households with income > $200k:
Bay City:
1.2% (12)
State:
6.7% (148,064)
Aggregate household income in Bay City in 2022: $60,764,786
Median non-family income in Bay City in 2022:
Bay City:
$44,969
Texas:
$40,634
Change in median non-family income between 2000 and 2022:
Bay City, Texas:
+149.8%
State:
+77.2%
Median per capita income in Bay City in 2022:
Bay City:
$22,441
Texas:
$26,785
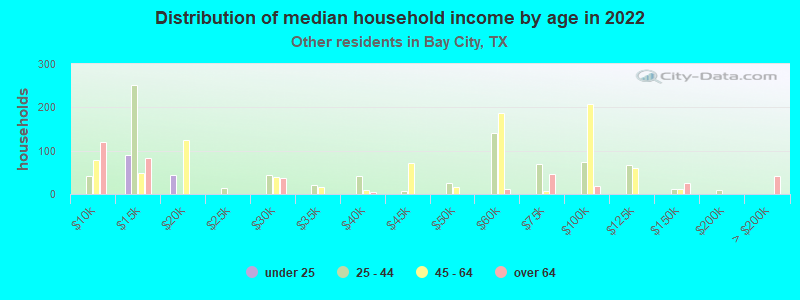
Income statistics for other residents
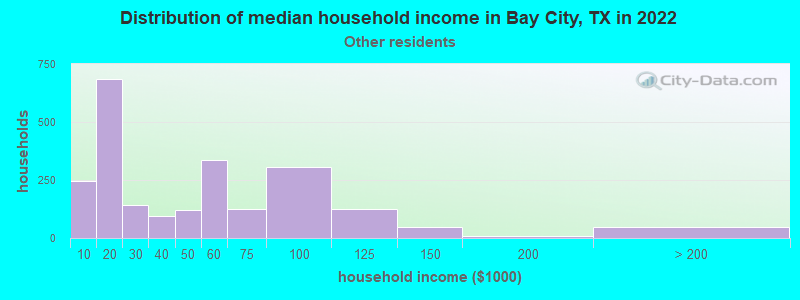
Median household income in Bay City, TX in 2022:
Bay City:
$33,859
State:
$57,114
Number of households with income < $10k:
Bay City:
10.8% (246)
State:
5.9% (54,162)
Number of households with income $10k - 20k:
Bay City:
30.0% (684)
State:
6.8% (62,891)
Number of households with income $20k - 30k:
Bay City:
6.3% (143)
State:
10.6% (97,294)
Number of households with income $30k - 40k:
Bay City:
4.1% (94)
State:
10.8% (99,670)
Number of households with income $40k - 50k:
Bay City:
5.3% (120)
State:
9.3% (85,548)
Number of households with income $50k - 60k:
Bay City:
14.8% (337)
State:
9.0% (82,757)
Number of households with income $60k - 75k:
Bay City:
5.4% (123)
Texas:
10.9% (100,326)
Number of households with income $75k - 100k:
Bay City:
13.5% (308)
State:
14.0% (128,767)
Number of households with income $100k - 125k:
Bay City:
5.4% (123)
State:
8.2% (75,218)
Number of households with income $125k - 150k:
Bay City:
2.0% (46)
State:
4.8% (44,223)
Number of households with income $150k - 200k:
Bay City:
0.4% (9)
State:
5.6% (51,376)
Number of households with income > $200k:
Bay City:
2.0% (46)
State:
4.0% (36,393)
Aggregate household income in Bay City in 2022: $112,906,667
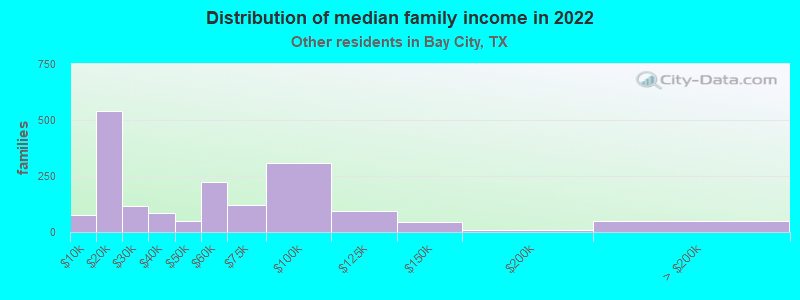
Median family income in Bay City in 2022:
Bay City:
$46,403
Texas:
$60,064
Number of families with income < $10k:
Bay City:
4.4% (76)
State:
6.8% (47,502)
Number of families with income $10k - 20k:
Bay City:
31.7% (542)
State:
6.0% (41,763)
Number of families with income $20k - 30k:
Bay City:
6.9% (118)
State:
9.9% (68,761)
Number of families with income $30k - 40k:
Bay City:
5.0% (86)
Texas:
9.7% (67,685)
Number of families with income $40k - 50k:
Bay City:
2.9% (49)
Texas:
9.0% (62,441)
Number of families with income $50k - 60k:
Bay City:
12.9% (221)
State:
8.5% (59,321)
Number of families with income $60k - 75k:
Bay City:
7.1% (121)
State:
11.2% (77,588)
Number of families with income $75k - 100k:
Bay City:
17.9% (306)
Texas:
14.5% (101,032)
Number of families with income $100k - 125k:
Bay City:
5.4% (92)
Texas:
8.8% (61,439)
Number of families with income $125k - 150k:
Bay City:
2.6% (45)
Texas:
5.1% (35,727)
Number of families with income $150k - 200k:
Bay City:
0.5% (9)
State:
5.9% (41,211)
Number of families with income > $200k:
Bay City:
2.7% (47)
Texas:
4.5% (31,243)
Median per capita income in Bay City in 2022:
Bay City:
$16,861
State:
$23,899
Change in median per capita income between 2000 and 2022:
Bay City, Texas:
+80.3%
State:
+135.2%
Discuss Bay City, Texas (TX) on our hugely popular Texas forum.