Bedford, Tennessee (TN) income map, earnings map, and wages data
The median household income in Bedford, TN in 2022 was $66,684, which was 2.1% greater than the median annual income of $65,254 across the entire state of Tennessee. Compared to the median income of $37,227 in 2000 this represents an increase of 44.2%. The per capita income in 2022 was $29,238, which means an increase of 47.0% compared to 2000 when it was $15,502.
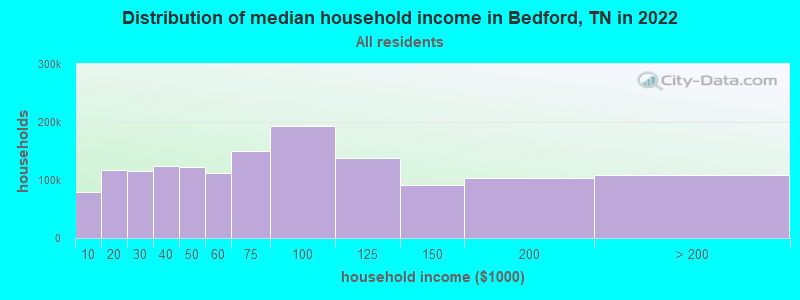
Income statistics for all residents
Median household income in Bedford, TN in 2022:| Bedford: | $66,684 |
| State: | $65,254 |
Change in median household income between 2000 and 2022:| Bedford, Tennessee: | +79.1% |
| State: | +79.5% |
Number of households with income < $10k:| Bedford: | 5.4% (79,129) |
| Tennessee: | 5.4% (154,793) |
Number of households with income $10k - 20k:| Bedford: | 8.0% (117,029) |
| State: | 8.0% (228,599) |
Number of households with income $20k - 30k:| Bedford: | 7.9% (115,089) |
| State: | 7.9% (224,908) |
Number of households with income $30k - 40k:| Bedford: | 8.6% (124,924) |
| State: | 8.6% (244,297) |
Number of households with income $40k - 50k:| Bedford: | 8.4% (122,174) |
| Tennessee: | 8.4% (238,949) |
Number of households with income $50k - 60k:| Bedford: | 7.7% (111,702) |
| State: | 7.7% (218,438) |
Number of households with income $60k - 75k:| Bedford: | 10.3% (150,451) |
| State: | 10.3% (294,172) |
Number of households with income $75k - 100k:| Bedford: | 13.3% (192,957) |
| Tennessee: | 13.3% (377,310) |
Number of households with income $100k - 125k:| Bedford: | 9.5% (137,705) |
| State: | 9.5% (269,124) |
Number of households with income $125k - 150k:| Bedford: | 6.3% (91,139) |
| State: | 6.3% (178,328) |
Number of households with income $150k - 200k:| Bedford: | 7.2% (104,230) |
| Tennessee: | 7.2% (204,030) |
Number of households with income > $200k:| Bedford: | 7.5% (108,977) |
| Tennessee: | 7.5% (213,736) |
Aggregate household income in Bedford in 2022: $2,909,766,770
Median family income in Bedford in 2022:| Bedford: | $75,413 |
| State: | $80,910 |
Median non-family income in Bedford in 2022:| Bedford: | $40,713 |
| State: | $40,285 |
Change in median non-family income between 2000 and 2022:| Bedford, Tennessee: | +91.6% |
| State: | +91.5% |
Median per capita income in Bedford in 2022:| Bedford: | $29,239 |
| State: | $36,704 |
Change in median per capita income between 2000 and 2022:| Bedford, Tennessee: | +88.6% |
| State: | +89.3% |
Income statistics for White residents
Median household income in Bedford, TN in 2022:| Bedford: | $69,575 |
| Tennessee: | $69,826 |
Change in median household income between 2000 and 2022:| Bedford, Tennessee: | +80.8% |
| State: | +82.9% |
Number of households with income < $10k:| Bedford: | 4.7% (50,616) |
| State: | 4.6% (100,279) |
Number of households with income $10k - 20k:| Bedford: | 7.7% (83,434) |
| State: | 7.6% (165,031) |
Number of households with income $20k - 30k:| Bedford: | 7.5% (80,977) |
| State: | 7.4% (160,229) |
Number of households with income $30k - 40k:| Bedford: | 8.1% (87,862) |
| Tennessee: | 8.1% (174,784) |
Number of households with income $40k - 50k:| Bedford: | 7.9% (85,378) |
| State: | 7.8% (169,622) |
Number of households with income $50k - 60k:| Bedford: | 7.7% (83,105) |
| Tennessee: | 7.6% (165,508) |
Number of households with income $60k - 75k:| Bedford: | 10.4% (112,598) |
| State: | 10.3% (223,937) |
Number of households with income $75k - 100k:| Bedford: | 13.5% (146,815) |
| Tennessee: | 13.5% (292,688) |
Number of households with income $100k - 125k:| Bedford: | 10.1% (109,977) |
| State: | 10.1% (219,251) |
Number of households with income $125k - 150k:| Bedford: | 6.6% (71,263) |
| State: | 6.6% (142,574) |
Number of households with income $150k - 200k:| Bedford: | 7.6% (82,799) |
| State: | 7.7% (166,039) |
Number of households with income > $200k:| Bedford: | 8.4% (91,243) |
| Tennessee: | 8.5% (184,546) |
Aggregate household income in Bedford in 2022: $2,276,991,923
Median family income in Bedford in 2022:| Bedford: | $76,135 |
| State: | $86,015 |
Number of families with income < $10k:| Bedford: | 4.1% (33) |
| State: | 3.1% (43,751) |
Number of families with income $10k - 20k:| Bedford: | 4.0% (32) |
| Tennessee: | 3.5% (49,925) |
Number of families with income $20k - 30k:| Bedford: | 6.9% (56) |
| State: | 5.0% (70,431) |
Number of families with income $30k - 40k:| Bedford: | 9.2% (75) |
| Tennessee: | 6.6% (93,498) |
Number of families with income $40k - 50k:| Bedford: | 15.0% (122) |
| State: | 6.8% (96,726) |
Number of families with income $50k - 60k:| Bedford: | 4.5% (37) |
| State: | 7.2% (101,879) |
Number of families with income $60k - 75k:| Bedford: | 12.2% (99) |
| State: | 10.7% (151,997) |
Number of families with income $75k - 100k:| Bedford: | 13.1% (106) |
| State: | 15.4% (218,373) |
Number of families with income $100k - 125k:| Bedford: | 20.1% (163) |
| State: | 12.6% (178,761) |
Number of families with income $150k - 200k:| Bedford: | 10.7% (86) |
| State: | 9.9% (141,123) |
Median non-family income in Bedford in 2022:| Bedford: | $41,155 |
| Tennessee: | $41,178 |
Change in median non-family income between 2000 and 2022:| Bedford, Tennessee: | +91.1% |
| Tennessee: | +91.1% |
Median per capita income in Bedford in 2022:| Bedford: | $30,358 |
| Tennessee: | $40,126 |
Change in median per capita income between 2000 and 2022:| Bedford, Tennessee: | +91.8% |
| Tennessee: | +92.6% |
Income statistics for Black or African American residents
Median household income in Bedford, TN in 2022:| Bedford: | $38,504 |
| Tennessee: | $49,531 |
Change in median household income between 2000 and 2022:| Bedford, Tennessee: | +98.7% |
| State: | +82.3% |
Number of households with income < $10k:| Bedford: | 9.1% (14,279) |
| State: | 9.1% (39,909) |
Number of households with income $10k - 20k:| Bedford: | 10.5% (16,517) |
| Tennessee: | 10.5% (46,276) |
Number of households with income $20k - 30k:| Bedford: | 10.2% (16,112) |
| State: | 10.2% (45,072) |
Number of households with income $30k - 40k:| Bedford: | 10.0% (15,663) |
| State: | 10.0% (43,885) |
Number of households with income $40k - 50k:| Bedford: | 10.7% (16,903) |
| Tennessee: | 10.7% (47,267) |
Number of households with income $50k - 60k:| Bedford: | 7.7% (12,098) |
| State: | 7.7% (33,868) |
Number of households with income $60k - 75k:| Bedford: | 10.5% (16,521) |
| Tennessee: | 10.5% (46,247) |
Number of households with income $75k - 100k:| Bedford: | 12.6% (19,796) |
| State: | 12.6% (55,465) |
Number of households with income $100k - 125k:| Bedford: | 6.7% (10,519) |
| State: | 6.7% (29,515) |
Number of households with income $125k - 150k:| Bedford: | 4.8% (7,602) |
| State: | 4.8% (21,306) |
Number of households with income $150k - 200k:| Bedford: | 4.6% (7,263) |
| State: | 4.6% (20,425) |
Number of households with income > $200k:| Bedford: | 2.5% (3,978) |
| State: | 2.5% (11,183) |
Aggregate household income in Bedford in 2022: $8,874,668
Median family income in Bedford in 2022:| Bedford: | $55,481 |
| Tennessee: | $61,153 |
Number of families with income $10k - 20k:| Bedford: | 20.7% (4) |
| State: | 6.0% (15,530) |
Number of families with income $20k - 30k:| Bedford: | 12.5% (2) |
| State: | 8.6% (22,263) |
Number of families with income $60k - 75k:| Bedford: | 66.8% (12) |
| Tennessee: | 11.6% (30,015) |
Median non-family income in Bedford in 2022:| Bedford: | $41,576 |
| Tennessee: | $35,793 |
Change in median non-family income between 2000 and 2022:| Bedford, Tennessee: | +121.7% |
| State: | +104.3% |
Median per capita income in Bedford in 2022:| Bedford: | $22,062 |
| State: | $27,306 |
Change in median per capita income between 2000 and 2022:| Bedford, Tennessee: | +112.3% |
| State: | +105.3% |
Income statistics for Multirace residents
Median household income in Bedford, TN in 2022:| Bedford: | $20,995 |
| State: | $57,741 |
Change in median household income between 2000 and 2022:| Bedford, Tennessee: | +86.6% |
| State: | +87.1% |
Number of households with income < $10k:| Bedford: | 6.7% (1,799) |
| State: | 6.7% (9,867) |
Number of households with income $10k - 20k:| Bedford: | 8.6% (2,300) |
| Tennessee: | 8.6% (12,639) |
Number of households with income $20k - 30k:| Bedford: | 9.2% (2,461) |
| State: | 9.2% (13,555) |
Number of households with income $30k - 40k:| Bedford: | 10.3% (2,759) |
| State: | 10.3% (15,117) |
Number of households with income $40k - 50k:| Bedford: | 9.4% (2,517) |
| State: | 9.4% (13,829) |
Number of households with income $50k - 60k:| Bedford: | 7.5% (1,997) |
| State: | 7.5% (10,969) |
Number of households with income $60k - 75k:| Bedford: | 9.2% (2,462) |
| State: | 9.2% (13,568) |
Number of households with income $75k - 100k:| Bedford: | 12.6% (3,378) |
| Tennessee: | 12.6% (18,516) |
Number of households with income $100k - 125k:| Bedford: | 8.6% (2,310) |
| State: | 8.6% (12,656) |
Number of households with income $125k - 150k:| Bedford: | 5.9% (1,580) |
| State: | 5.9% (8,674) |
Number of households with income $150k - 200k:| Bedford: | 7.2% (1,922) |
| Tennessee: | 7.2% (10,611) |
Number of households with income > $200k:| Bedford: | 4.7% (1,264) |
| State: | 4.8% (6,986) |
Aggregate household income in Bedford in 2022: $1,200,406
Median family income in Bedford in 2022:| Bedford: | $21,671 |
| State: | $70,058 |
Number of families with income $10k - 20k:| Bedford: | 100.0% (26) |
| State: | 6.6% (6,301) |
Median per capita income in Bedford in 2022:| Bedford: | $4,933 |
| Tennessee: | $24,436 |
Change in median per capita income between 2000 and 2022:| Bedford, Tennessee: | +82.5% |
| State: | +84.3% |