Billerica, Massachusetts (MA) income map, earnings map, and wages data
The median household income in Billerica, MA in 2022 was $132,429, which was 28.7% greater than the median annual income of $94,488 across the entire state of Massachusetts. Compared to the median income of $67,799 in 2000 this represents an increase of 48.8%. The per capita income in 2022 was $51,807, which means an increase of 51.8% compared to 2000 when it was $24,953.
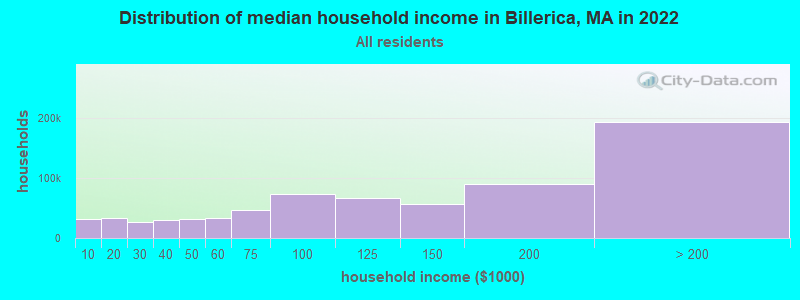
Income statistics for all residents
Median household income in Billerica, MA in 2022:| Billerica: | $132,430 |
| State: | $94,488 |
Change in median household income between 2000 and 2022:| Billerica, Massachusetts: | +95.3% |
| State: | +87.1% |
Number of households with income < $10k:| Billerica: | 4.5% (31,827) |
| State: | 5.2% (146,170) |
Number of households with income $10k - 20k:| Billerica: | 4.7% (33,666) |
| Massachusetts: | 6.4% (180,001) |
Number of households with income $20k - 30k:| Billerica: | 3.8% (26,951) |
| Massachusetts: | 5.6% (156,667) |
Number of households with income $30k - 40k:| Billerica: | 4.2% (29,876) |
| Massachusetts: | 5.6% (157,168) |
Number of households with income $40k - 50k:| Billerica: | 4.5% (31,829) |
| Massachusetts: | 5.4% (151,455) |
Number of households with income $50k - 60k:| Billerica: | 4.6% (33,061) |
| Massachusetts: | 5.1% (142,726) |
Number of households with income $60k - 75k:| Billerica: | 6.5% (46,259) |
| State: | 7.6% (212,203) |
Number of households with income $75k - 100k:| Billerica: | 10.2% (72,412) |
| State: | 11.3% (317,064) |
Number of households with income $100k - 125k:| Billerica: | 9.4% (67,170) |
| Massachusetts: | 9.7% (270,603) |
Number of households with income $125k - 150k:| Billerica: | 7.9% (55,949) |
| State: | 8.0% (223,140) |
Number of households with income $150k - 200k:| Billerica: | 12.6% (89,875) |
| State: | 11.0% (308,695) |
Number of households with income > $200k:| Billerica: | 27.1% (192,565) |
| Massachusetts: | 19.0% (531,884) |
Aggregate household income in Billerica in 2022: $46,916,309,741
Median family income in Billerica in 2022:| Billerica: | $146,677 |
| State: | $120,263 |
Median non-family income in Billerica in 2022:| Billerica: | $72,293 |
| Massachusetts: | $55,979 |
Change in median non-family income between 2000 and 2022:| Billerica, Massachusetts: | +94.2% |
| State: | +88.0% |
Median per capita income in Billerica in 2022:| Billerica: | $51,807 |
| State: | $54,025 |
Change in median per capita income between 2000 and 2022:| Billerica, Massachusetts: | +107.6% |
| State: | +108.2% |
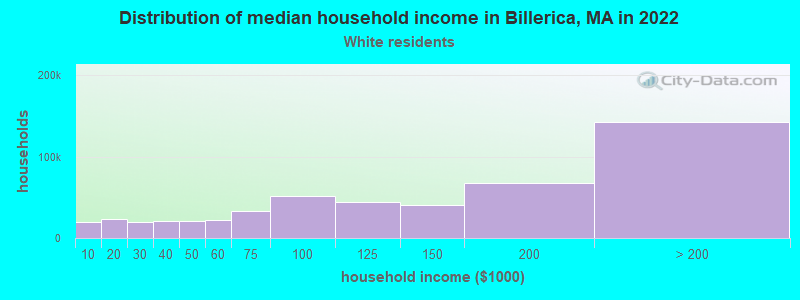
Income statistics for White residents
Median household income in Billerica, MA in 2022:| Billerica: | $133,695 |
| State: | $101,391 |
Change in median household income between 2000 and 2022:| Billerica, Massachusetts: | +98.2% |
| State: | +93.3% |
Number of households with income < $10k:| Billerica: | 3.9% (19,518) |
| Massachusetts: | 4.4% (91,120) |
Number of households with income $10k - 20k:| Billerica: | 4.7% (23,793) |
| State: | 5.9% (122,055) |
Number of households with income $20k - 30k:| Billerica: | 3.8% (19,201) |
| State: | 5.1% (105,311) |
Number of households with income $30k - 40k:| Billerica: | 4.2% (21,406) |
| Massachusetts: | 5.3% (110,239) |
Number of households with income $40k - 50k:| Billerica: | 4.0% (20,331) |
| Massachusetts: | 5.0% (104,636) |
Number of households with income $50k - 60k:| Billerica: | 4.3% (21,843) |
| State: | 4.8% (99,486) |
Number of households with income $60k - 75k:| Billerica: | 6.6% (33,288) |
| State: | 7.5% (155,124) |
Number of households with income $75k - 100k:| Billerica: | 10.1% (51,233) |
| State: | 11.4% (236,252) |
Number of households with income $100k - 125k:| Billerica: | 8.8% (44,486) |
| State: | 9.9% (204,731) |
Number of households with income $125k - 150k:| Billerica: | 8.1% (41,088) |
| State: | 8.5% (175,324) |
Number of households with income $150k - 200k:| Billerica: | 13.2% (66,980) |
| State: | 11.7% (242,980) |
Number of households with income > $200k:| Billerica: | 28.2% (142,501) |
| Massachusetts: | 20.5% (425,966) |
Aggregate household income in Billerica in 2022: $33,734,181,306
Median family income in Billerica in 2022:| Billerica: | $153,328 |
| State: | $133,153 |
Number of families with income < $10k:| Billerica: | 1.9% (116) |
| State: | 2.0% (25,038) |
Number of families with income $10k - 20k:| Billerica: | 1.9% (111) |
| State: | 2.1% (26,403) |
Number of families with income $20k - 30k:| Billerica: | 2.9% (175) |
| State: | 2.6% (32,525) |
Number of families with income $30k - 40k:| Billerica: | 3.6% (213) |
| State: | 3.9% (48,079) |
Number of families with income $40k - 50k:| Billerica: | 4.2% (253) |
| Massachusetts: | 3.8% (46,908) |
Number of families with income $50k - 60k:| Billerica: | 5.5% (330) |
| State: | 3.8% (46,476) |
Number of families with income $60k - 75k:| Billerica: | 8.6% (518) |
| State: | 6.4% (79,040) |
Number of families with income $75k - 100k:| Billerica: | 15.4% (921) |
| Massachusetts: | 11.1% (137,395) |
Number of families with income $100k - 125k:| Billerica: | 14.0% (839) |
| State: | 11.1% (136,771) |
Number of families with income $125k - 150k:| Billerica: | 10.5% (631) |
| State: | 10.0% (123,709) |
Number of families with income $150k - 200k:| Billerica: | 14.1% (848) |
| State: | 14.7% (181,602) |
Number of families with income > $200k:| Billerica: | 17.3% (1,038) |
| Massachusetts: | 28.5% (351,887) |
Median non-family income in Billerica in 2022:| Billerica: | $70,981 |
| State: | $59,323 |
Change in median non-family income between 2000 and 2022:| Billerica, Massachusetts: | +90.7% |
| Massachusetts: | +94.3% |
Median per capita income in Billerica in 2022:| Billerica: | $54,774 |
| Massachusetts: | $60,804 |
Change in median per capita income between 2000 and 2022:| Billerica, Massachusetts: | +117.3% |
| State: | +118.7% |
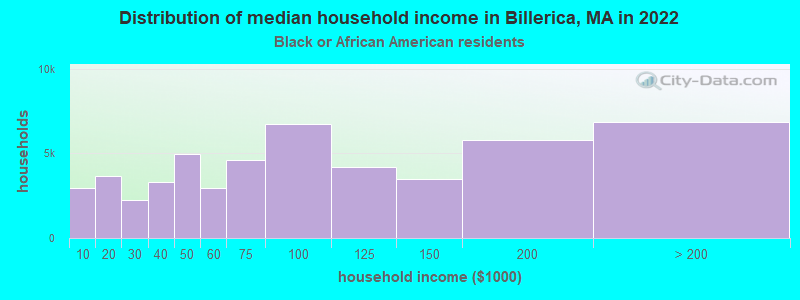
Income statistics for Black or African American residents
Median household income in Billerica, MA in 2022:| Billerica: | $154,888 |
| Massachusetts: | $63,189 |
Change in median household income between 2000 and 2022:| Billerica, Massachusetts: | +92.0% |
| State: | +87.4% |
Number of households with income < $10k:| Billerica: | 5.7% (2,927) |
| State: | 9.1% (15,797) |
Number of households with income $10k - 20k:| Billerica: | 7.1% (3,673) |
| State: | 9.4% (16,267) |
Number of households with income $20k - 30k:| Billerica: | 4.3% (2,232) |
| Massachusetts: | 7.8% (13,520) |
Number of households with income $30k - 40k:| Billerica: | 6.4% (3,324) |
| Massachusetts: | 8.3% (14,412) |
Number of households with income $40k - 50k:| Billerica: | 9.6% (4,943) |
| Massachusetts: | 7.9% (13,790) |
Number of households with income $50k - 60k:| Billerica: | 5.7% (2,939) |
| Massachusetts: | 5.8% (10,041) |
Number of households with income $60k - 75k:| Billerica: | 8.9% (4,606) |
| State: | 8.5% (14,822) |
Number of households with income $75k - 100k:| Billerica: | 13.0% (6,706) |
| State: | 11.0% (19,122) |
Number of households with income $100k - 125k:| Billerica: | 8.1% (4,187) |
| State: | 8.4% (14,575) |
Number of households with income $125k - 150k:| Billerica: | 6.7% (3,468) |
| State: | 6.0% (10,429) |
Number of households with income $150k - 200k:| Billerica: | 11.2% (5,771) |
| State: | 7.2% (12,539) |
Number of households with income > $200k:| Billerica: | 13.3% (6,844) |
| State: | 10.5% (18,185) |
Aggregate household income in Billerica in 2022: $23,794,471
Median family income in Billerica in 2022:| Billerica: | $120,044 |
| State: | $79,815 |
Number of families with income $30k - 40k:| Billerica: | 8.2% (6) |
| Massachusetts: | 6.4% (7,002) |
Number of families with income $40k - 50k:| Billerica: | 14.8% (10) |
| Massachusetts: | 7.9% (8,656) |
Number of families with income $50k - 60k:| Billerica: | 16.7% (12) |
| State: | 6.4% (6,986) |
Number of families with income $60k - 75k:| Billerica: | 13.0% (9) |
| State: | 7.9% (8,699) |
Number of families with income $75k - 100k:| Billerica: | 47.3% (34) |
| State: | 11.5% (12,654) |
Median non-family income in Billerica in 2022:| Billerica: | $59,585 |
| State: | $38,934 |
Change in median non-family income between 2000 and 2022:| Billerica, Massachusetts: | +71.5% |
| State: | +69.2% |
Median per capita income in Billerica in 2022:| Billerica: | $47,134 |
| State: | $33,524 |
Change in median per capita income between 2000 and 2022:| Billerica, Massachusetts: | +98.1% |
| State: | +109.4% |
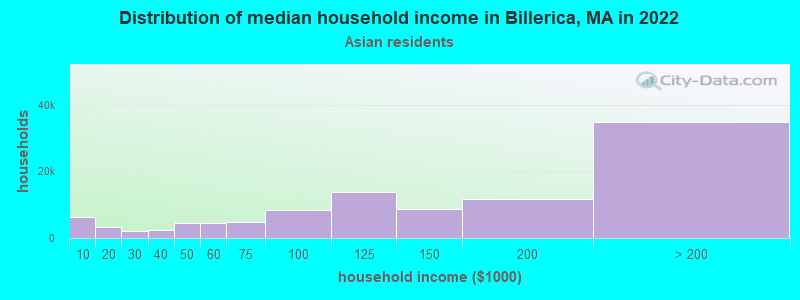
Income statistics for Asian residents
Median household income in Billerica, MA in 2022:| Billerica: | $179,576 |
| State: | $117,855 |
Change in median household income between 2000 and 2022:| Billerica, Massachusetts: | +108.1% |
| Massachusetts: | +129.9% |
Number of households with income < $10k:| Billerica: | 6.0% (6,375) |
| State: | 6.8% (11,982) |
Number of households with income $10k - 20k:| Billerica: | 3.1% (3,290) |
| State: | 4.8% (8,376) |
Number of households with income $20k - 30k:| Billerica: | 1.9% (2,063) |
| Massachusetts: | 3.7% (6,558) |
Number of households with income $30k - 40k:| Billerica: | 2.4% (2,538) |
| State: | 3.3% (5,748) |
Number of households with income $40k - 50k:| Billerica: | 4.4% (4,635) |
| Massachusetts: | 4.1% (7,192) |
Number of households with income $50k - 60k:| Billerica: | 4.3% (4,575) |
| State: | 5.0% (8,734) |
Number of households with income $60k - 75k:| Billerica: | 4.5% (4,762) |
| Massachusetts: | 5.8% (10,203) |
Number of households with income $75k - 100k:| Billerica: | 7.9% (8,416) |
| Massachusetts: | 8.6% (15,154) |
Number of households with income $100k - 125k:| Billerica: | 13.0% (13,799) |
| State: | 10.8% (18,942) |
Number of households with income $125k - 150k:| Billerica: | 8.3% (8,807) |
| State: | 8.0% (14,037) |
Number of households with income $150k - 200k:| Billerica: | 11.1% (11,785) |
| State: | 12.5% (21,856) |
Number of households with income > $200k:| Billerica: | 32.9% (34,887) |
| State: | 26.6% (46,694) |
Aggregate household income in Billerica in 2022: $171,248,896
Median family income in Billerica in 2022:| Billerica: | $190,754 |
| State: | $140,113 |
Number of families with income < $10k:| Billerica: | 1.6% (7) |
| State: | 3.2% (3,752) |
Number of families with income $10k - 20k:| Billerica: | 2.0% (9) |
| Massachusetts: | 3.5% (4,118) |
Number of families with income $20k - 30k:| Billerica: | 2.3% (11) |
| Massachusetts: | 2.3% (2,708) |
Number of families with income $30k - 40k:| Billerica: | 0.5% (2) |
| Massachusetts: | 2.8% (3,234) |
Number of families with income $40k - 50k:| Billerica: | 3.5% (16) |
| State: | 3.9% (4,621) |
Number of families with income $50k - 60k:| Billerica: | 4.3% (20) |
| Massachusetts: | 3.9% (4,606) |
Number of families with income $60k - 75k:| Billerica: | 9.7% (45) |
| State: | 6.1% (7,105) |
Number of families with income $75k - 100k:| Billerica: | 28.5% (133) |
| Massachusetts: | 8.5% (10,022) |
Number of families with income $100k - 125k:| Billerica: | 9.7% (45) |
| State: | 10.0% (11,697) |
Number of families with income $125k - 150k:| Billerica: | 16.9% (79) |
| State: | 8.6% (10,071) |
Number of families with income $150k - 200k:| Billerica: | 20.9% (98) |
| State: | 13.2% (15,478) |
Median non-family income in Billerica in 2022:| Billerica: | $207,236 |
| Massachusetts: | $71,440 |
Change in median non-family income between 2000 and 2022:| Billerica, Massachusetts: | +119.9% |
| State: | +128.0% |
Median per capita income in Billerica in 2022:| Billerica: | $67,733 |
| State: | $58,900 |
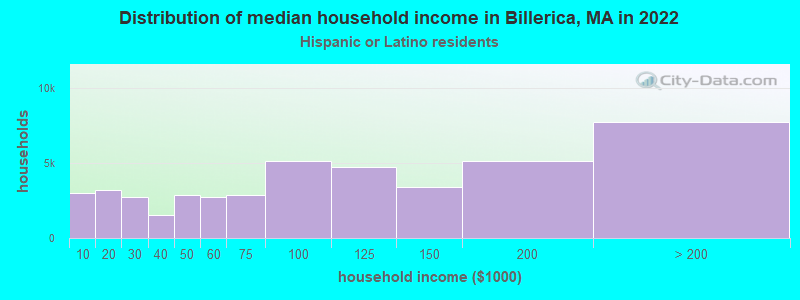
Income statistics for Hispanic or Latino residents
Median household income in Billerica, MA in 2022:| Billerica: | $98,790 |
| State: | $61,523 |
Change in median household income between 2000 and 2022:| Billerica, Massachusetts: | +138.1% |
| State: | +125.4% |
Number of households with income < $10k:| Billerica: | 6.6% (2,972) |
| State: | 8.8% (25,307) |
Number of households with income $10k - 20k:| Billerica: | 7.1% (3,176) |
| State: | 10.0% (28,653) |
Number of households with income $20k - 30k:| Billerica: | 6.0% (2,718) |
| Massachusetts: | 8.8% (25,189) |
Number of households with income $30k - 40k:| Billerica: | 3.4% (1,524) |
| State: | 7.2% (20,822) |
Number of households with income $40k - 50k:| Billerica: | 6.4% (2,874) |
| State: | 7.2% (20,817) |
Number of households with income $50k - 60k:| Billerica: | 6.1% (2,765) |
| Massachusetts: | 6.5% (18,748) |
Number of households with income $60k - 75k:| Billerica: | 6.3% (2,837) |
| Massachusetts: | 8.8% (25,390) |
Number of households with income $75k - 100k:| Billerica: | 11.4% (5,146) |
| Massachusetts: | 12.0% (34,488) |
Number of households with income $100k - 125k:| Billerica: | 10.6% (4,766) |
| Massachusetts: | 8.6% (24,599) |
Number of households with income $125k - 150k:| Billerica: | 7.5% (3,375) |
| State: | 6.2% (17,743) |
Number of households with income $150k - 200k:| Billerica: | 11.4% (5,131) |
| State: | 7.3% (21,017) |
Number of households with income > $200k:| Billerica: | 17.2% (7,740) |
| State: | 8.6% (24,606) |
Aggregate household income in Billerica in 2022: $28,300,706
Median family income in Billerica in 2022:| Billerica: | $88,252 |
| State: | $66,072 |
Number of families with income < $10k:| Billerica: | 3.0% (24) |
| State: | 6.2% (12,456) |
Number of families with income $10k - 20k:| Billerica: | 3.9% (30) |
| State: | 6.0% (12,071) |
Number of families with income $20k - 30k:| Billerica: | 6.8% (53) |
| State: | 10.1% (20,376) |
Number of families with income $30k - 40k:| Billerica: | 2.8% (22) |
| Massachusetts: | 8.2% (16,470) |
Number of families with income $40k - 50k:| Billerica: | 6.9% (54) |
| Massachusetts: | 7.4% (14,829) |
Number of families with income $50k - 60k:| Billerica: | 11.3% (88) |
| State: | 7.3% (14,643) |
Number of families with income $60k - 75k:| Billerica: | 13.1% (103) |
| State: | 10.6% (21,252) |
Number of families with income $75k - 100k:| Billerica: | 17.8% (139) |
| State: | 12.0% (24,088) |
Number of families with income $100k - 125k:| Billerica: | 13.1% (102) |
| Massachusetts: | 8.9% (17,954) |
Number of families with income $125k - 150k:| Billerica: | 6.8% (53) |
| State: | 6.9% (13,837) |
Number of families with income $150k - 200k:| Billerica: | 7.8% (61) |
| State: | 7.3% (14,683) |
Number of families with income > $200k:| Billerica: | 6.7% (52) |
| State: | 9.3% (18,741) |
Median non-family income in Billerica in 2022:| Billerica: | $80,384 |
| Massachusetts: | $37,563 |
Change in median non-family income between 2000 and 2022:| Billerica, Massachusetts: | +98.1% |
| State: | +115.0% |
Median per capita income in Billerica in 2022:| Billerica: | $25,965 |
| Massachusetts: | $28,993 |
Change in median per capita income between 2000 and 2022:| Billerica, Massachusetts: | +142.9% |
| State: | +142.4% |
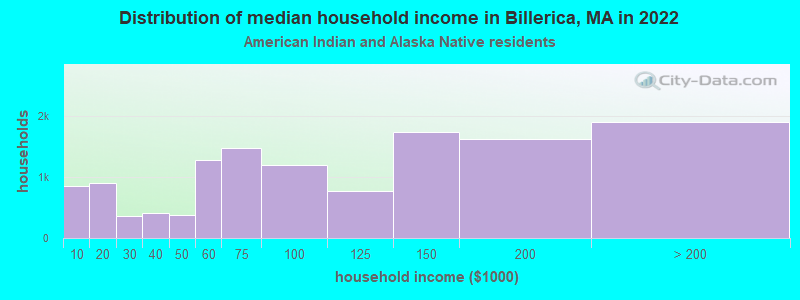
Income statistics for American Indian and Alaska Native residents
Median household income in Billerica, MA in 2022:| Billerica: | $200,527 |
| State: | $87,730 |
Number of households with income < $10k:| Billerica: | 6.6% (855) |
| State: | 6.6% (451) |
Number of households with income $10k - 20k:| Billerica: | 7.0% (902) |
| State: | 7.0% (476) |
Number of households with income $20k - 30k:| Billerica: | 2.8% (364) |
| State: | 2.8% (192) |
Number of households with income $30k - 40k:| Billerica: | 3.2% (413) |
| State: | 3.2% (218) |
Number of households with income $40k - 50k:| Billerica: | 2.9% (377) |
| State: | 2.9% (199) |
Number of households with income $50k - 60k:| Billerica: | 9.9% (1,283) |
| Massachusetts: | 9.9% (677) |
Number of households with income $60k - 75k:| Billerica: | 11.5% (1,480) |
| State: | 11.5% (781) |
Number of households with income $75k - 100k:| Billerica: | 9.2% (1,192) |
| Massachusetts: | 9.2% (629) |
Number of households with income $100k - 125k:| Billerica: | 6.0% (769) |
| State: | 6.0% (406) |
Number of households with income $125k - 150k:| Billerica: | 13.5% (1,745) |
| Massachusetts: | 13.5% (921) |
Number of households with income $150k - 200k:| Billerica: | 12.6% (1,628) |
| State: | 12.6% (859) |
Number of households with income > $200k:| Billerica: | 14.7% (1,901) |
| State: | 14.7% (1,003) |
Aggregate household income in Billerica in 2022: $2,478,592
Median family income in Billerica in 2022:| Billerica: | $75,644 |
| State: | $105,715 |
Number of families with income $60k - 75k:| Billerica: | 100.0% (13) |
| State: | 14.7% (471) |
Median per capita income in Billerica in 2022:| Billerica: | $49,655 |
| State: | $39,434 |
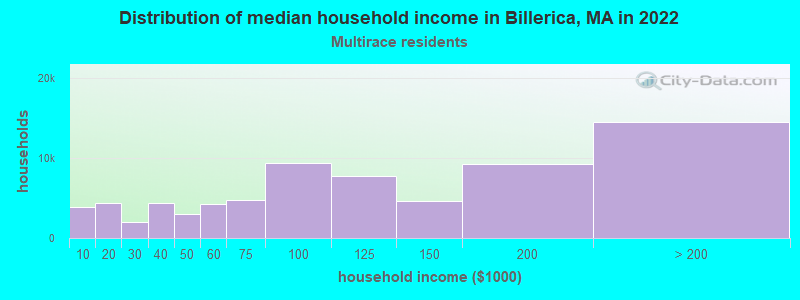
Income statistics for Multirace residents
Median household income in Billerica, MA in 2022:| Billerica: | $162,881 |
| State: | $71,552 |
Change in median household income between 2000 and 2022:| Billerica, Massachusetts: | +146.3% |
| Massachusetts: | +109.0% |
Number of households with income < $10k:| Billerica: | 5.4% (3,871) |
| State: | 6.6% (15,127) |
Number of households with income $10k - 20k:| Billerica: | 6.0% (4,325) |
| State: | 9.2% (21,158) |
Number of households with income $20k - 30k:| Billerica: | 2.8% (2,039) |
| State: | 7.8% (18,016) |
Number of households with income $30k - 40k:| Billerica: | 6.0% (4,347) |
| Massachusetts: | 7.9% (18,260) |
Number of households with income $40k - 50k:| Billerica: | 4.1% (2,964) |
| State: | 5.6% (13,027) |
Number of households with income $50k - 60k:| Billerica: | 5.9% (4,241) |
| State: | 5.6% (12,909) |
Number of households with income $60k - 75k:| Billerica: | 6.7% (4,779) |
| State: | 9.0% (20,800) |
Number of households with income $75k - 100k:| Billerica: | 12.9% (9,299) |
| State: | 12.1% (27,875) |
Number of households with income $100k - 125k:| Billerica: | 10.8% (7,725) |
| State: | 8.1% (18,754) |
Number of households with income $125k - 150k:| Billerica: | 6.4% (4,574) |
| State: | 6.8% (15,621) |
Number of households with income $150k - 200k:| Billerica: | 12.8% (9,217) |
| Massachusetts: | 9.4% (21,618) |
Number of households with income > $200k:| Billerica: | 20.1% (14,477) |
| Massachusetts: | 12.0% (27,592) |
Aggregate household income in Billerica in 2022: $90,814,674
Median family income in Billerica in 2022:| Billerica: | $151,034 |
| State: | $78,380 |
Number of families with income $30k - 40k:| Billerica: | 6.0% (40) |
| State: | 8.2% (12,705) |
Number of families with income $40k - 50k:| Billerica: | 4.7% (31) |
| State: | 5.3% (8,255) |
Number of families with income $50k - 60k:| Billerica: | 2.5% (16) |
| State: | 6.7% (10,445) |
Number of families with income $60k - 75k:| Billerica: | 11.3% (75) |
| State: | 10.3% (16,064) |
Number of families with income $150k - 200k:| Billerica: | 42.7% (282) |
| State: | 10.3% (15,978) |
Number of families with income > $200k:| Billerica: | 32.7% (216) |
| State: | 14.0% (21,838) |
Median non-family income in Billerica in 2022:| Billerica: | $53,992 |
| Massachusetts: | $42,253 |
Median per capita income in Billerica in 2022:| Billerica: | $38,251 |
| State: | $34,029 |
Change in median per capita income between 2000 and 2022:| Billerica, Massachusetts: | +116.4% |
| Massachusetts: | +132.1% |
Income statistics for other residents
Number of households with income < $10k:| Billerica: | 8.1% (7) |
| State: | 8.4% (11,559) |
Number of households with income $10k - 20k:| Billerica: | 4.7% (4) |
| State: | 8.4% (11,499) |
Number of households with income $20k - 30k:| Billerica: | 11.6% (10) |
| State: | 9.5% (13,070) |
Number of households with income $30k - 40k:| Billerica: | 3.5% (3) |
| State: | 6.0% (8,291) |
Number of households with income $40k - 50k:| Billerica: | 9.3% (8) |
| Massachusetts: | 9.2% (12,611) |
Number of households with income $50k - 60k:| Billerica: | 9.3% (8) |
| State: | 7.9% (10,879) |
Number of households with income $60k - 75k:| Billerica: | 8.1% (7) |
| State: | 7.5% (10,239) |
Number of households with income $75k - 100k:| Billerica: | 10.5% (9) |
| Massachusetts: | 13.1% (18,032) |
Number of households with income $100k - 125k:| Billerica: | 9.3% (8) |
| State: | 9.6% (13,141) |
Number of households with income $125k - 150k:| Billerica: | 5.8% (5) |
| State: | 5.0% (6,808) |
Number of households with income $150k - 200k:| Billerica: | 5.8% (5) |
| State: | 6.4% (8,843) |
Number of households with income > $200k:| Billerica: | 14.0% (12) |
| Massachusetts: | 9.0% (12,396) |
Aggregate household income in Billerica in 2022: $10,538,264
Median family income in Billerica in 2022:| Billerica: | $50,202 |
| State: | $66,840 |
Number of families with income $20k - 30k:| Billerica: | 96.4% (61) |
| State: | 10.4% (10,595) |
Number of families with income $30k - 40k:| Billerica: | 3.6% (2) |
| State: | 7.0% (7,154) |
Median non-family income in Billerica in 2022:| Billerica: | $115,883 |
| Massachusetts: | $36,127 |
Change in median non-family income between 2000 and 2022:| Billerica, Massachusetts: | +81.8% |
| State: | +123.4% |
Median per capita income in Billerica in 2022:| Billerica: | $20,284 |
| State: | $30,797 |