The median household income in Blandford, MA in 2022 was $85,118, which was 11.0% less than the median annual income of $94,488 across the entire state of Massachusetts. Compared to the median income of $52,935 in 2000 this represents an increase of 37.8%. The per capita income in 2022 was $42,614, which means an increase of 43.0% compared to 2000 when it was $24,285.
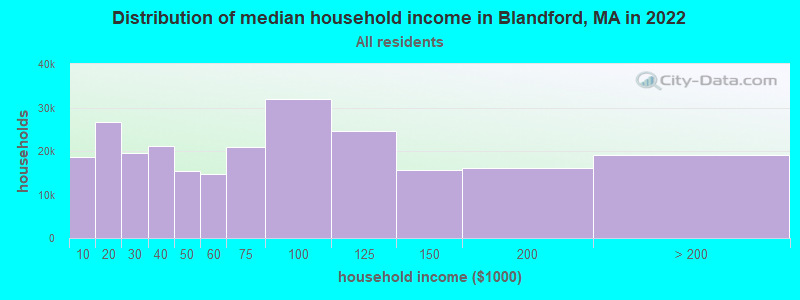
Income statistics for all residents
Median household income in Blandford, MA in 2022:
Blandford:
$85,119
State:
$94,488
Change in median household income between 2000 and 2022:
Blandford, Massachusetts:
+60.8%
Massachusetts:
+87.1%
Number of households with income < $10k:
Blandford:
7.6% (18,675)
State:
5.2% (146,170)
Number of households with income $10k - 20k:
Blandford:
10.9% (26,558)
Massachusetts:
6.4% (180,001)
Number of households with income $20k - 30k:
Blandford:
8.0% (19,647)
State:
5.6% (156,667)
Number of households with income $30k - 40k:
Blandford:
8.6% (21,081)
Massachusetts:
5.6% (157,168)
Number of households with income $40k - 50k:
Blandford:
6.3% (15,446)
State:
5.4% (151,455)
Number of households with income $50k - 60k:
Blandford:
6.0% (14,782)
State:
5.1% (142,726)
Number of households with income $60k - 75k:
Blandford:
8.5% (20,823)
State:
7.6% (212,203)
Number of households with income $75k - 100k:
Blandford:
13.1% (32,065)
Massachusetts:
11.3% (317,064)
Number of households with income $100k - 125k:
Blandford:
10.0% (24,488)
State:
9.7% (270,603)
Number of households with income $125k - 150k:
Blandford:
6.4% (15,725)
State:
8.0% (223,140)
Number of households with income $150k - 200k:
Blandford:
6.6% (16,177)
Massachusetts:
11.0% (308,695)
Number of households with income > $200k:
Blandford:
7.8% (19,019)
State:
19.0% (531,884)
Aggregate household income in Blandford in 2022: $208,452,946
Median family income in Blandford in 2022:
Blandford:
$101,175
Massachusetts:
$120,263
Median non-family income in Blandford in 2022:
Blandford:
$45,800
State:
$55,979
Change in median non-family income between 2000 and 2022:
Blandford, Massachusetts:
+57.0%
State:
+88.0%
Median per capita income in Blandford in 2022:
Blandford:
$42,615
State:
$54,025
Change in median per capita income between 2000 and 2022:
Blandford, Massachusetts:
+75.5%
State:
+108.2%
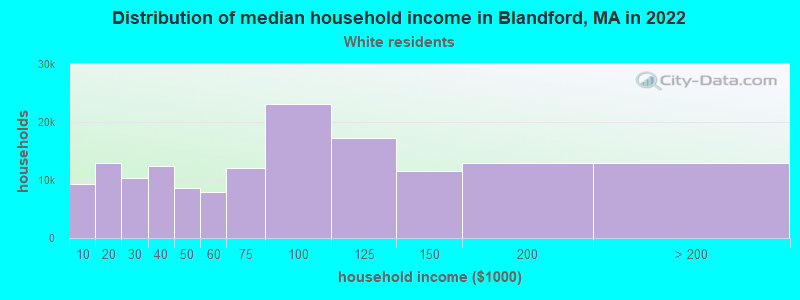
Income statistics for White residents
Median household income in Blandford, MA in 2022:
Blandford:
$95,475
State:
$101,391
Change in median household income between 2000 and 2022:
Blandford, Massachusetts:
+79.4%
State:
+93.3%
Number of households with income < $10k:
Blandford:
6.1% (9,252)
Massachusetts:
4.4% (91,120)
Number of households with income $10k - 20k:
Blandford:
8.6% (13,005)
Massachusetts:
5.9% (122,055)
Number of households with income $20k - 30k:
Blandford:
6.8% (10,314)
Massachusetts:
5.1% (105,311)
Number of households with income $30k - 40k:
Blandford:
8.3% (12,486)
Massachusetts:
5.3% (110,239)
Number of households with income $40k - 50k:
Blandford:
5.7% (8,676)
Massachusetts:
5.0% (104,636)
Number of households with income $50k - 60k:
Blandford:
5.2% (7,885)
State:
4.8% (99,486)
Number of households with income $60k - 75k:
Blandford:
8.0% (12,103)
State:
7.5% (155,124)
Number of households with income $75k - 100k:
Blandford:
15.2% (23,059)
Massachusetts:
11.4% (236,252)
Number of households with income $100k - 125k:
Blandford:
11.3% (17,172)
State:
9.9% (204,731)
Number of households with income $125k - 150k:
Blandford:
7.6% (11,528)
State:
8.5% (175,324)
Number of households with income $150k - 200k:
Blandford:
8.5% (12,882)
Massachusetts:
11.7% (242,980)
Number of households with income > $200k:
Blandford:
8.6% (12,961)
State:
20.5% (425,966)
Aggregate household income in Blandford in 2022: $152,672,964
Median family income in Blandford in 2022:
Blandford:
$107,350
Massachusetts:
$133,153
Number of families with income < $10k:
Blandford:
1.3% (4)
State:
2.0% (25,038)
Number of families with income $10k - 20k:
Blandford:
0.6% (1)
State:
2.1% (26,403)
Number of families with income $20k - 30k:
Blandford:
3.2% (9)
State:
2.6% (32,525)
Number of families with income $30k - 40k:
Blandford:
2.8% (8)
State:
3.9% (48,079)
Number of families with income $40k - 50k:
Blandford:
4.8% (13)
State:
3.8% (46,908)
Number of families with income $50k - 60k:
Blandford:
8.1% (22)
Massachusetts:
3.8% (46,476)
Number of families with income $60k - 75k:
Blandford:
12.7% (34)
State:
6.4% (79,040)
Number of families with income $75k - 100k:
Blandford:
18.6% (50)
State:
11.1% (137,395)
Number of families with income $100k - 125k:
Blandford:
9.4% (25)
Massachusetts:
11.1% (136,771)
Number of families with income $125k - 150k:
Blandford:
3.9% (10)
Massachusetts:
10.0% (123,709)
Number of families with income $150k - 200k:
Blandford:
22.6% (61)
State:
14.7% (181,602)
Number of families with income > $200k:
Blandford:
11.9% (32)
State:
28.5% (351,887)
Median non-family income in Blandford in 2022:
Blandford:
$46,986
State:
$59,323
Change in median non-family income between 2000 and 2022:
Blandford, Massachusetts:
+64.6%
State:
+94.3%
Median per capita income in Blandford in 2022:
Blandford:
$45,615
State:
$60,804
Change in median per capita income between 2000 and 2022:
Blandford, Massachusetts:
+87.0%
State:
+118.7%
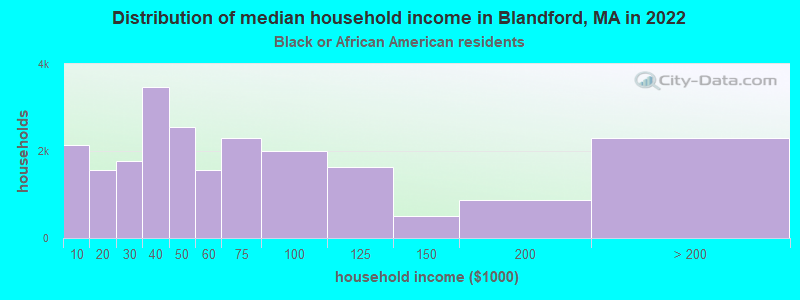
Income statistics for Black or African American residents
Median household income in Blandford, MA in 2022:
Blandford:
$72,750
Massachusetts:
$63,189
Change in median household income between 2000 and 2022:
Blandford, Massachusetts:
+76.4%
State:
+87.4%
Number of households with income < $10k:
Blandford:
9.4% (2,129)
State:
9.1% (15,797)
Number of households with income $10k - 20k:
Blandford:
6.9% (1,572)
State:
9.4% (16,267)
Number of households with income $20k - 30k:
Blandford:
7.8% (1,768)
State:
7.8% (13,520)
Number of households with income $30k - 40k:
Blandford:
15.3% (3,474)
State:
8.3% (14,412)
Number of households with income $40k - 50k:
Blandford:
11.2% (2,546)
Massachusetts:
7.9% (13,790)
Number of households with income $50k - 60k:
Blandford:
6.9% (1,569)
State:
5.8% (10,041)
Number of households with income $60k - 75k:
Blandford:
10.1% (2,297)
State:
8.5% (14,822)
Number of households with income $75k - 100k:
Blandford:
8.8% (1,994)
Massachusetts:
11.0% (19,122)
Number of households with income $100k - 125k:
Blandford:
7.2% (1,639)
State:
8.4% (14,575)
Number of households with income $125k - 150k:
Blandford:
2.2% (502)
State:
6.0% (10,429)
Number of households with income $150k - 200k:
Blandford:
3.8% (863)
State:
7.2% (12,539)
Number of households with income > $200k:
Blandford:
10.1% (2,288)
Massachusetts:
10.5% (18,185)
Aggregate household income in Blandford in 2022: $188,878
Median non-family income in Blandford in 2022:
Blandford:
$73,836
State:
$38,934
Change in median non-family income between 2000 and 2022:
Blandford, Massachusetts:
+79.0%
Massachusetts:
+69.2%
Median per capita income in Blandford in 2022:
Blandford:
$82,191
Massachusetts:
$33,524
Change in median per capita income between 2000 and 2022:
Blandford, Massachusetts:
+95.7%
State:
+109.4%
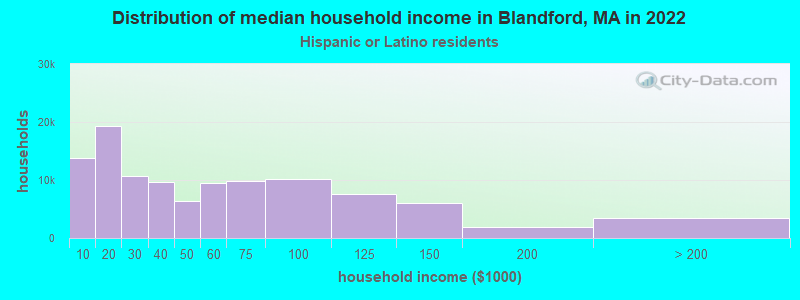
Income statistics for Hispanic or Latino residents
Median household income in Blandford, MA in 2022:
Blandford:
$101,937
Massachusetts:
$61,523
Change in median household income between 2000 and 2022:
Blandford, Massachusetts:
+120.4%
State:
+125.4%
Number of households with income < $10k:
Blandford:
12.7% (13,709)
State:
8.8% (25,307)
Number of households with income $10k - 20k:
Blandford:
17.8% (19,267)
State:
10.0% (28,653)
Number of households with income $20k - 30k:
Blandford:
10.0% (10,762)
Massachusetts:
8.8% (25,189)
Number of households with income $30k - 40k:
Blandford:
9.0% (9,735)
Massachusetts:
7.2% (20,822)
Number of households with income $40k - 50k:
Blandford:
5.9% (6,431)
Massachusetts:
7.2% (20,817)
Number of households with income $50k - 60k:
Blandford:
8.8% (9,470)
Massachusetts:
6.5% (18,748)
Number of households with income $60k - 75k:
Blandford:
9.0% (9,747)
State:
8.8% (25,390)
Number of households with income $75k - 100k:
Blandford:
9.3% (10,110)
State:
12.0% (34,488)
Number of households with income $100k - 125k:
Blandford:
7.0% (7,591)
State:
8.6% (24,599)
Number of households with income $125k - 150k:
Blandford:
5.5% (5,988)
State:
6.2% (17,743)
Number of households with income $150k - 200k:
Blandford:
1.7% (1,821)
State:
7.3% (21,017)
Number of households with income > $200k:
Blandford:
3.2% (3,509)
State:
8.6% (24,606)
Aggregate household income in Blandford in 2022: $391,167
Median family income in Blandford in 2022:
Blandford:
$123,804
State:
$66,072
Number of families with income < $10k:
Blandford:
5.4% (5)
Massachusetts:
6.2% (12,456)
Number of families with income $10k - 20k:
Blandford:
2.9% (3)
Massachusetts:
6.0% (12,071)
Number of families with income $20k - 30k:
Blandford:
12.3% (12)
State:
10.1% (20,376)
Number of families with income $30k - 40k:
Blandford:
5.2% (5)
State:
8.2% (16,470)
Number of families with income $40k - 50k:
Blandford:
7.4% (7)
State:
7.4% (14,829)
Number of families with income $50k - 60k:
Blandford:
17.1% (17)
State:
7.3% (14,643)
Number of families with income $60k - 75k:
Blandford:
19.0% (18)
State:
10.6% (21,252)
Number of families with income $75k - 100k:
Blandford:
14.1% (14)
State:
12.0% (24,088)
Number of families with income $100k - 125k:
Blandford:
6.4% (6)
State:
8.9% (17,954)
Number of families with income $125k - 150k:
Blandford:
2.3% (2)
State:
6.9% (13,837)
Number of families with income $150k - 200k:
Blandford:
3.6% (3)
Massachusetts:
7.3% (14,683)
Number of families with income > $200k:
Blandford:
4.2% (4)
State:
9.3% (18,741)
Median per capita income in Blandford in 2022:
Blandford:
$35,949
State:
$28,993
Change in median per capita income between 2000 and 2022:
Blandford, Massachusetts:
+129.0%
Massachusetts:
+142.4%
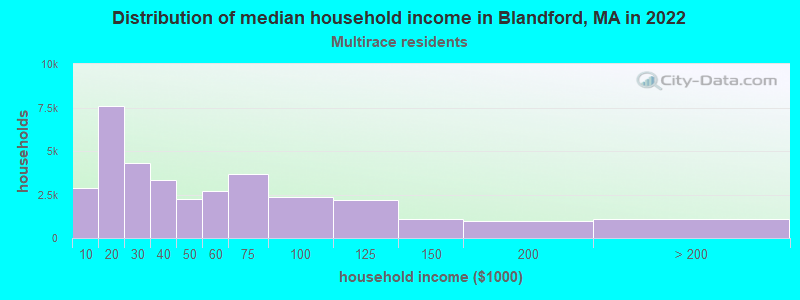
Income statistics for Multirace residents
Median household income in Blandford, MA in 2022:
Blandford:
$48,141
State:
$71,552
Change in median household income between 2000 and 2022:
Blandford, Massachusetts:
+42.6%
Massachusetts:
+109.0%
Number of households with income < $10k:
Blandford:
8.4% (2,886)
State:
6.6% (15,127)
Number of households with income $10k - 20k:
Blandford:
22.0% (7,572)
Massachusetts:
9.2% (21,158)
Number of households with income $20k - 30k:
Blandford:
12.5% (4,303)
Massachusetts:
7.8% (18,016)
Number of households with income $30k - 40k:
Blandford:
9.7% (3,361)
State:
7.9% (18,260)
Number of households with income $40k - 50k:
Blandford:
6.6% (2,263)
State:
5.6% (13,027)
Number of households with income $50k - 60k:
Blandford:
7.9% (2,721)
State:
5.6% (12,909)
Number of households with income $60k - 75k:
Blandford:
10.7% (3,694)
State:
9.0% (20,800)
Number of households with income $75k - 100k:
Blandford:
6.8% (2,348)
State:
12.1% (27,875)
Number of households with income $100k - 125k:
Blandford:
6.4% (2,195)
State:
8.1% (18,754)
Number of households with income $125k - 150k:
Blandford:
3.2% (1,106)
Massachusetts:
6.8% (15,621)
Number of households with income $150k - 200k:
Blandford:
2.8% (951)
Massachusetts:
9.4% (21,618)
Number of households with income > $200k:
Blandford:
3.2% (1,091)
Massachusetts:
12.0% (27,592)
Aggregate household income in Blandford in 2022: $4,441,503
Median family income in Blandford in 2022:
Blandford:
$145,558
State:
$78,380
Number of families with income $100k - 125k:
Blandford:
100.0% (31)
Massachusetts:
7.9% (12,321)
Median non-family income in Blandford in 2022:
Blandford:
$34,030
State:
$42,253
Change in median non-family income between 2000 and 2022:
Blandford, Massachusetts:
+3.4%
Massachusetts:
+93.7%
Median per capita income in Blandford in 2022:
Blandford:
$14,678
State:
$34,029
Change in median per capita income between 2000 and 2022:
Blandford, Massachusetts:
+88.2%
State:
+132.1%
Income statistics for other residents
Number of households with income < $10k:
Blandford:
16.2% (11,613)
State:
8.4% (11,559)
Number of households with income $10k - 20k:
Blandford:
12.7% (9,095)
Massachusetts:
8.4% (11,499)
Number of households with income $20k - 30k:
Blandford:
6.5% (4,638)
State:
9.5% (13,070)
Number of households with income $30k - 40k:
Blandford:
5.4% (3,849)
State:
6.0% (8,291)
Number of households with income $40k - 50k:
Blandford:
7.2% (5,136)
State:
9.2% (12,611)
Number of households with income $50k - 60k:
Blandford:
8.8% (6,314)
State:
7.9% (10,879)
Number of households with income $60k - 75k:
Blandford:
7.1% (5,110)
State:
7.5% (10,239)
Number of households with income $75k - 100k:
Blandford:
13.3% (9,529)
State:
13.1% (18,032)
Number of households with income $100k - 125k:
Blandford:
8.8% (6,330)
Massachusetts:
9.6% (13,141)
Number of households with income $125k - 150k:
Blandford:
7.2% (5,173)
State:
5.0% (6,808)
Number of households with income $150k - 200k:
Blandford:
0.4% (309)
State:
6.4% (8,843)
Number of households with income > $200k:
Blandford:
6.6% (4,707)
Massachusetts:
9.0% (12,396)
Median per capita income in Blandford in 2022:
Blandford:
$121,361
Massachusetts:
$30,797
Discuss Blandford, Massachusetts (MA) on our hugely popular Massachusetts forum.