The median household income in Bloomingburg, NY in 2022 was $39,954, which was 99.1% less than the median annual income of $79,557 across the entire state of New York. Compared to the median income of $38,571 in 2000 this represents an increase of 3.5%. The per capita income in 2022 was $12,542, which means a decrease of 70.9% compared to 2000 when it was $21,441.
Whole page based on the data from 2000 / 2022 when the population of Bloomingburg, New York was 353 / 973
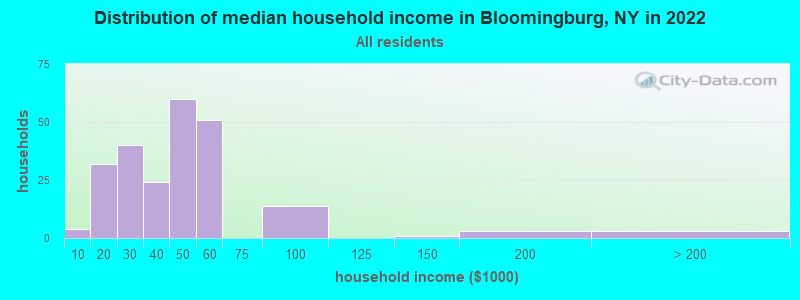
Income statistics for all residents
Median household income in Bloomingburg, NY in 2022:
Bloomingburg:
$39,954
State:
$79,557
Change in median household income between 2000 and 2022:
Bloomingburg, New York:
+3.6%
State:
+83.3%
Number of households with income < $10k:
Bloomingburg:
1.7% (4)
State:
6.8% (527,598)
Number of households with income $10k - 20k:
Bloomingburg:
13.8% (32)
State:
7.4% (574,940)
Number of households with income $20k - 30k:
Bloomingburg:
17.2% (40)
State:
6.7% (517,718)
Number of households with income $30k - 40k:
Bloomingburg:
10.3% (24)
State:
6.5% (506,674)
Number of households with income $40k - 50k:
Bloomingburg:
25.9% (60)
State:
6.1% (470,439)
Number of households with income $50k - 60k:
Bloomingburg:
22.0% (51)
State:
5.8% (454,042)
Number of households with income $60k - 75k:
Bloomingburg:
0.0% (0)
State:
8.5% (657,508)
Number of households with income $75k - 100k:
Bloomingburg:
6.0% (14)
State:
11.6% (899,824)
Number of households with income $100k - 125k:
Bloomingburg:
0.0% (0)
State:
9.3% (723,825)
Number of households with income $125k - 150k:
Bloomingburg:
0.4% (1)
State:
7.1% (552,420)
Number of households with income $150k - 200k:
Bloomingburg:
1.3% (3)
State:
9.4% (727,051)
Number of households with income > $200k:
Bloomingburg:
1.3% (3)
New York:
15.0% (1,162,269)
Aggregate household income in Bloomingburg in 2022: $11,365,357
Median family income in Bloomingburg in 2022:
Bloomingburg:
$48,978
State:
$99,066
Number of families with income $10k - 20k:
Bloomingburg:
10.9% (19)
State:
4.3% (205,373)
Number of families with income $20k - 30k:
Bloomingburg:
22.9% (39)
State:
5.1% (241,229)
Number of families with income $30k - 40k:
Bloomingburg:
8.1% (14)
State:
5.5% (259,233)
Number of families with income $40k - 50k:
Bloomingburg:
19.5% (33)
State:
5.5% (259,113)
Number of families with income $50k - 60k:
Bloomingburg:
25.7% (44)
State:
5.4% (255,320)
Number of families with income $75k - 100k:
Bloomingburg:
8.8% (15)
State:
12.3% (583,110)
Number of families with income $125k - 150k:
Bloomingburg:
0.8% (1)
State:
8.5% (400,594)
Number of families with income $150k - 200k:
Bloomingburg:
1.8% (3)
State:
11.6% (551,650)
Number of families with income > $200k:
Bloomingburg:
1.6% (3)
New York:
18.9% (895,998)
Median per capita income in Bloomingburg in 2022:
Bloomingburg:
$12,543
New York:
$47,421
Change in median per capita income between 2000 and 2022:: -41.5%
Bloomingburg, New York:
-41.5%
State:
+102.7%
Income statistics for White residents
Median household income in Bloomingburg, NY in 2022:
Bloomingburg:
$40,698
New York:
$89,408
Change in median household income between 2000 and 2022:
Bloomingburg, New York:
+5.7%
State:
+85.5%
Number of households with income < $10k:
Bloomingburg:
1.1% (2)
State:
4.8% (225,550)
Number of households with income $10k - 20k:
Bloomingburg:
15.4% (29)
State:
6.1% (289,425)
Number of households with income $20k - 30k:
Bloomingburg:
18.1% (34)
State:
5.9% (280,254)
Number of households with income $30k - 40k:
Bloomingburg:
11.7% (22)
New York:
6.1% (288,263)
Number of households with income $40k - 50k:
Bloomingburg:
28.2% (53)
State:
5.9% (278,079)
Number of households with income $50k - 60k:
Bloomingburg:
16.0% (30)
State:
5.7% (267,554)
Number of households with income $60k - 75k:
Bloomingburg:
0.0% (0)
New York:
8.4% (398,344)
Number of households with income $75k - 100k:
Bloomingburg:
6.4% (12)
New York:
11.8% (554,841)
Number of households with income $100k - 125k:
Bloomingburg:
0.0% (0)
New York:
10.0% (469,794)
Number of households with income $125k - 150k:
Bloomingburg:
0.5% (1)
State:
7.6% (360,467)
Number of households with income $150k - 200k:
Bloomingburg:
1.1% (2)
State:
10.1% (477,078)
Number of households with income > $200k:
Bloomingburg:
1.6% (3)
New York:
17.6% (829,233)
Aggregate household income in Bloomingburg in 2022: $9,860,753
Median family income in Bloomingburg in 2022:
Bloomingburg:
$44,834
State:
$115,170
Number of families with income $10k - 20k:
Bloomingburg:
13.9% (17)
New York:
3.0% (83,127)
Number of families with income $20k - 30k:
Bloomingburg:
22.3% (28)
State:
3.5% (97,578)
Number of families with income $30k - 40k:
Bloomingburg:
10.5% (13)
New York:
4.1% (114,108)
Number of families with income $40k - 50k:
Bloomingburg:
19.8% (25)
State:
4.7% (130,902)
Number of families with income $50k - 60k:
Bloomingburg:
18.2% (23)
State:
4.9% (135,118)
Number of families with income $75k - 100k:
Bloomingburg:
9.8% (12)
State:
12.4% (342,382)
Number of families with income $125k - 150k:
Bloomingburg:
1.0% (1)
State:
9.4% (260,489)
Number of families with income $150k - 200k:
Bloomingburg:
2.3% (3)
State:
13.2% (365,586)
Number of families with income > $200k:
Bloomingburg:
2.3% (3)
State:
23.2% (642,319)
Median per capita income in Bloomingburg in 2022:
Bloomingburg:
$12,230
State:
$57,640
Change in median per capita income between 2000 and 2022:: -43.8%
Bloomingburg, New York:
-43.8%
New York:
+111.6%
Income statistics for Hispanic or Latino residents
Number of households with income < $10k:
Bloomingburg:
0.0% (0)
State:
9.9% (127,185)
Number of households with income $10k - 20k:
Bloomingburg:
0.0% (0)
State:
10.7% (136,699)
Number of households with income $20k - 30k:
Bloomingburg:
0.0% (0)
State:
8.1% (102,991)
Number of households with income $30k - 40k:
Bloomingburg:
0.0% (0)
State:
7.8% (100,149)
Number of households with income $40k - 50k:
Bloomingburg:
0.0% (0)
State:
6.9% (87,760)
Number of households with income $50k - 60k:
Bloomingburg:
100.0% (20)
State:
6.3% (80,968)
Number of households with income $60k - 75k:
Bloomingburg:
0.0% (0)
State:
8.7% (110,631)
Number of households with income $75k - 100k:
Bloomingburg:
0.0% (0)
State:
11.2% (142,787)
Number of households with income $100k - 125k:
Bloomingburg:
0.0% (0)
State:
8.2% (104,850)
Number of households with income $125k - 150k:
Bloomingburg:
0.0% (0)
State:
6.3% (80,274)
Number of households with income $150k - 200k:
Bloomingburg:
0.0% (0)
State:
7.4% (95,117)
Number of households with income > $200k:
Bloomingburg:
0.0% (0)
State:
8.6% (109,514)
Aggregate household income in Bloomingburg in 2022: $464,881
Median per capita income in Bloomingburg in 2022:
Bloomingburg:
$20,627
New York:
$29,761
Change in median per capita income between 2000 and 2022:
Bloomingburg, New York:
+18.7%
New York:
+132.7%
Income statistics for Multirace residents
Aggregate household income in Bloomingburg in 2022: $1,667,528
Median per capita income in Bloomingburg in 2022:
Bloomingburg:
$9,184
State:
$36,931
Change in median per capita income between 2000 and 2022:: -53.5%
Bloomingburg, New York:
-53.5%
New York:
+158.8%
Income statistics for other residents
Number of households with income < $10k:
Bloomingburg:
0.0% (0)
State:
10.3% (69,252)
Number of households with income $10k - 20k:
Bloomingburg:
0.0% (0)
New York:
11.0% (73,890)
Number of households with income $20k - 30k:
Bloomingburg:
0.0% (0)
State:
8.8% (59,096)
Number of households with income $30k - 40k:
Bloomingburg:
0.0% (0)
State:
8.1% (54,418)
Number of households with income $40k - 50k:
Bloomingburg:
0.0% (0)
State:
7.3% (49,042)
Number of households with income $50k - 60k:
Bloomingburg:
100.0% (23)
State:
6.5% (43,945)
Number of households with income $60k - 75k:
Bloomingburg:
0.0% (0)
State:
9.5% (64,087)
Number of households with income $75k - 100k:
Bloomingburg:
0.0% (0)
State:
10.9% (73,094)
Number of households with income $100k - 125k:
Bloomingburg:
0.0% (0)
State:
7.9% (53,055)
Number of households with income $125k - 150k:
Bloomingburg:
0.0% (0)
New York:
5.9% (39,446)
Number of households with income $150k - 200k:
Bloomingburg:
0.0% (0)
State:
7.2% (48,653)
Number of households with income > $200k:
Bloomingburg:
0.0% (0)
State:
6.6% (44,703)
Aggregate household income in Bloomingburg in 2022: $485,718
Median per capita income in Bloomingburg in 2022:
Bloomingburg:
$52,365
State:
$26,975
Discuss Bloomingburg, New York (NY) on our hugely popular New York forum.