The median household income in Bodega Bay, CA in 2022 was $153,528, which was 40.4% greater than the median annual income of $91,551 across the entire state of California. Compared to the median income of $56,818 in 2000 this represents an increase of 63.0%. The per capita income in 2022 was $69,189, which means an increase of 46.2% compared to 2000 when it was $37,226.
Whole page based on the data from 2000 / 2022 when the population of Bodega Bay, California was 1,423 / 1,172
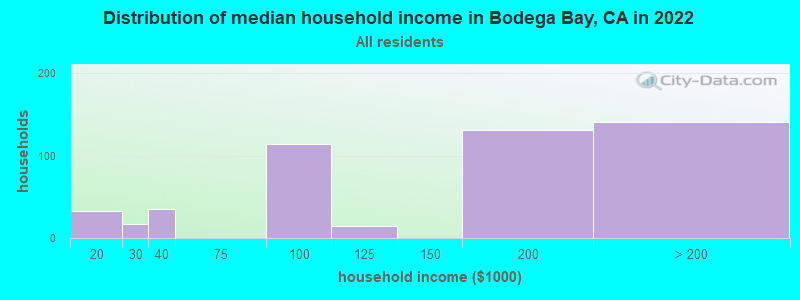
Income statistics for all residents
Median household income in Bodega Bay, CA in 2022:
Bodega Bay:
$153,529
State:
$91,551
Number of households with income < $10k:
Bodega Bay:
0.0% (0)
State:
4.8% (654,370)
Number of households with income $10k - 20k:
Bodega Bay:
6.8% (33)
California:
5.8% (789,493)
Number of households with income $20k - 30k:
Bodega Bay:
3.5% (17)
California:
5.7% (778,318)
Number of households with income $30k - 40k:
Bodega Bay:
7.2% (35)
State:
5.8% (783,170)
Number of households with income $40k - 50k:
Bodega Bay:
0.0% (0)
California:
5.8% (781,352)
Number of households with income $50k - 60k:
Bodega Bay:
0.0% (0)
State:
5.6% (760,175)
Number of households with income $60k - 75k:
Bodega Bay:
0.0% (0)
California:
8.2% (1,104,699)
Number of households with income $75k - 100k:
Bodega Bay:
23.5% (114)
State:
12.0% (1,627,633)
Number of households with income $100k - 125k:
Bodega Bay:
3.1% (15)
State:
10.0% (1,358,619)
Number of households with income $125k - 150k:
Bodega Bay:
0.0% (0)
State:
7.6% (1,027,455)
Number of households with income $150k - 200k:
Bodega Bay:
27.0% (131)
State:
10.6% (1,439,811)
Number of households with income > $200k:
Bodega Bay:
29.0% (141)
State:
18.0% (2,445,491)
Aggregate household income in Bodega Bay in 2022: $78,638,121
Median family income in Bodega Bay in 2022:
Bodega Bay:
$173,697
State:
$104,823
Number of families with income $20k - 30k:
Bodega Bay:
5.4% (16)
State:
4.7% (433,722)
Number of families with income $60k - 75k:
Bodega Bay:
9.3% (28)
California:
8.0% (731,094)
Number of families with income $75k - 100k:
Bodega Bay:
14.2% (42)
State:
12.2% (1,115,621)
Number of families with income $100k - 125k:
Bodega Bay:
4.9% (15)
State:
10.5% (959,600)
Number of families with income $150k - 200k:
Bodega Bay:
33.3% (99)
State:
11.9% (1,087,239)
Number of families with income > $200k:
Bodega Bay:
32.9% (98)
State:
21.5% (1,963,769)
Median income for 2 person families:
Bodega Bay:
$177,360
State:
$92,781
Median income for families with 0 earners:
Bodega Bay:
$169,272
State:
$49,362
Median income for families with 1 earner:
Bodega Bay:
$0
California:
$71,861
Median income for families with 2 earners:
Bodega Bay:
$0
California:
$133,967
Median income for families with 3+ earners:
Bodega Bay:
$0
State:
$148,892
Median non-family income in Bodega Bay in 2022:
Bodega Bay:
$76,309
State:
$59,348
Change in median non-family income between 2000 and 2022:
Bodega Bay, California:
+66.8%
State:
+85.3%
Median per capita income in Bodega Bay in 2022:
Bodega Bay:
$69,190
State:
$46,661
Change in median per capita income between 2000 and 2022:
Bodega Bay, California:
+85.9%
State:
+105.5%
Income statistics for White residents
Median household income in Bodega Bay, CA in 2022:
Bodega Bay:
$167,592
California:
$100,917
Number of households with income < $10k:
Bodega Bay:
0.0% (0)
State:
4.4% (284,109)
Number of households with income $10k - 20k:
Bodega Bay:
7.8% (32)
State:
5.3% (340,330)
Number of households with income $20k - 30k:
Bodega Bay:
3.9% (16)
State:
5.3% (343,145)
Number of households with income $30k - 40k:
Bodega Bay:
7.5% (31)
State:
5.1% (330,146)
Number of households with income $40k - 50k:
Bodega Bay:
0.0% (0)
State:
5.2% (335,310)
Number of households with income $50k - 60k:
Bodega Bay:
0.0% (0)
California:
5.1% (326,299)
Number of households with income $60k - 75k:
Bodega Bay:
0.0% (0)
California:
7.6% (487,640)
Number of households with income $75k - 100k:
Bodega Bay:
16.3% (67)
California:
11.5% (736,578)
Number of households with income $100k - 125k:
Bodega Bay:
3.2% (13)
California:
10.1% (648,782)
Number of households with income $125k - 150k:
Bodega Bay:
0.0% (0)
State:
7.8% (499,671)
Number of households with income $150k - 200k:
Bodega Bay:
29.7% (122)
California:
11.4% (729,603)
Number of households with income > $200k:
Bodega Bay:
31.6% (130)
State:
21.2% (1,364,246)
Aggregate household income in Bodega Bay in 2022: $68,854,928
Median family income in Bodega Bay in 2022:
Bodega Bay:
$180,273
California:
$125,379
Number of families with income $20k - 30k:
Bodega Bay:
7.2% (17)
State:
3.5% (137,295)
Number of families with income $60k - 75k:
Bodega Bay:
10.6% (25)
State:
7.0% (274,752)
Number of families with income $100k - 125k:
Bodega Bay:
5.5% (13)
California:
10.7% (423,630)
Number of families with income $150k - 200k:
Bodega Bay:
38.3% (91)
State:
13.5% (532,693)
Number of families with income > $200k:
Bodega Bay:
38.3% (91)
State:
27.6% (1,086,948)
Median non-family income in Bodega Bay in 2022:
Bodega Bay:
$76,350
State:
$62,819
Change in median non-family income between 2000 and 2022:
Bodega Bay, California:
+139.1%
California:
+84.4%
Median per capita income in Bodega Bay in 2022:
Bodega Bay:
$88,959
State:
$61,706
Change in median per capita income between 2000 and 2022:
Bodega Bay, California:
+121.7%
California:
+122.7%
Income statistics for Black or African American residents
Median per capita income in Bodega Bay in 2022:
Bodega Bay:
$21,404
California:
$36,708
Change in median per capita income between 2000 and 2022:
Bodega Bay, California:
+137.8%
California:
+110.4%
Income statistics for Hispanic or Latino residents
Number of households with income < $10k:
Bodega Bay:
0.0% (0)
State:
4.3% (183,294)
Number of households with income $10k - 20k:
Bodega Bay:
0.0% (0)
California:
6.0% (253,903)
Number of households with income $20k - 30k:
Bodega Bay:
0.0% (0)
California:
6.8% (286,386)
Number of households with income $30k - 40k:
Bodega Bay:
0.0% (0)
State:
7.4% (313,728)
Number of households with income $40k - 50k:
Bodega Bay:
0.0% (0)
California:
7.4% (313,199)
Number of households with income $50k - 60k:
Bodega Bay:
0.0% (0)
State:
7.2% (305,366)
Number of households with income $60k - 75k:
Bodega Bay:
0.0% (0)
State:
10.3% (434,937)
Number of households with income $75k - 100k:
Bodega Bay:
100.0% (44)
State:
14.4% (607,302)
Number of households with income $100k - 125k:
Bodega Bay:
0.0% (0)
State:
10.6% (447,424)
Number of households with income $125k - 150k:
Bodega Bay:
0.0% (0)
California:
7.5% (316,022)
Number of households with income $150k - 200k:
Bodega Bay:
0.0% (0)
California:
9.2% (386,269)
Number of households with income > $200k:
Bodega Bay:
0.0% (0)
State:
8.8% (372,651)
Aggregate household income in Bodega Bay in 2022: $4,514,344
Median per capita income in Bodega Bay in 2022:
Bodega Bay:
$17,268
State:
$27,240
Change in median per capita income between 2000 and 2022:
Bodega Bay, California:
+17.6%
California:
+133.3%
Income statistics for other residents
Number of households with income < $10k:
Bodega Bay:
0.0% (0)
California:
4.6% (93,035)
Number of households with income $10k - 20k:
Bodega Bay:
0.0% (0)
State:
6.3% (126,222)
Number of households with income $20k - 30k:
Bodega Bay:
0.0% (0)
State:
7.1% (142,656)
Number of households with income $30k - 40k:
Bodega Bay:
0.0% (0)
State:
8.2% (165,018)
Number of households with income $40k - 50k:
Bodega Bay:
0.0% (0)
State:
8.0% (161,732)
Number of households with income $50k - 60k:
Bodega Bay:
0.0% (0)
California:
7.6% (152,152)
Number of households with income $60k - 75k:
Bodega Bay:
0.0% (0)
State:
10.4% (209,951)
Number of households with income $75k - 100k:
Bodega Bay:
100.0% (47)
State:
14.7% (296,102)
Number of households with income $100k - 125k:
Bodega Bay:
0.0% (0)
California:
10.7% (214,281)
Number of households with income $125k - 150k:
Bodega Bay:
0.0% (0)
State:
7.1% (143,092)
Number of households with income $150k - 200k:
Bodega Bay:
0.0% (0)
State:
8.6% (172,215)
Number of households with income > $200k:
Bodega Bay:
0.0% (0)
California:
6.7% (134,102)
Aggregate household income in Bodega Bay in 2022: $5,777,556
Median per capita income in Bodega Bay in 2022:
Bodega Bay:
$18,402
State:
$25,164
Change in median per capita income between 2000 and 2022:
Bodega Bay, California:
+100.6%
State:
+137.9%
Discuss Bodega Bay, California (CA) on our hugely popular California forum.