The median household income in Bolingbrook, IL in 2022 was $91,928, which was 16.6% greater than the median annual income of $76,708 across the entire state of Illinois. Compared to the median income of $67,852 in 2000 this represents an increase of 26.2%. The per capita income in 2022 was $38,270, which means an increase of 38.7% compared to 2000 when it was $23,468.
Whole page based on the data from 2000 / 2022 when the population of Bolingbrook, Illinois was 56,321 / 75,444
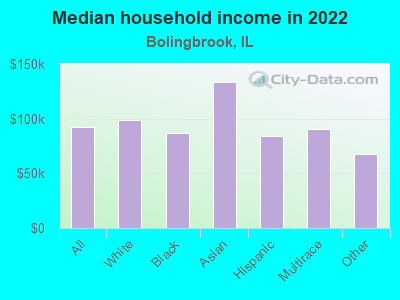
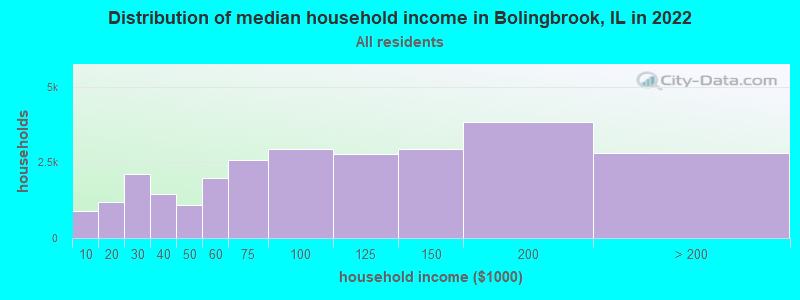
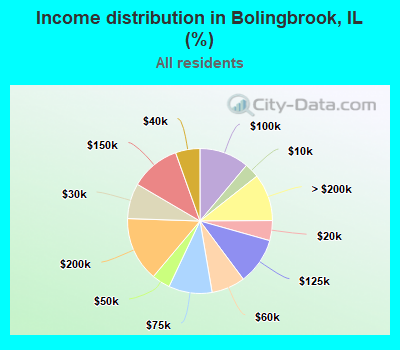
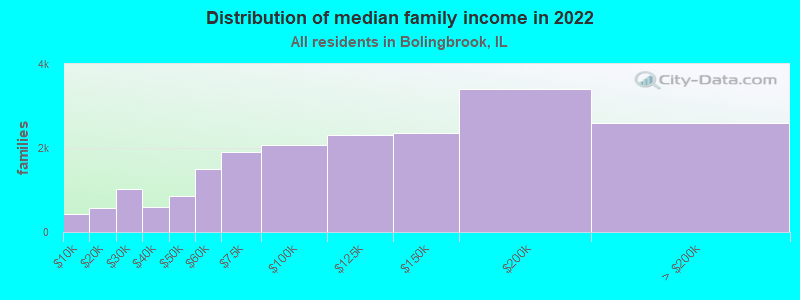
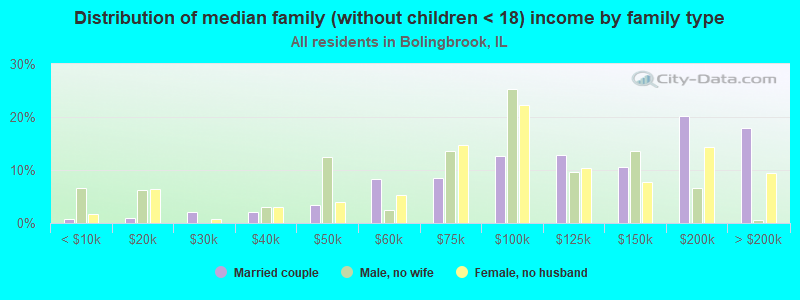
Income statistics for all residents
Median household income in Bolingbrook, IL in 2022:
Bolingbrook:
$91,928
State:
$76,708
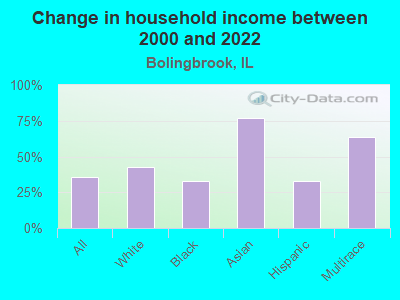
Change in median household income between 2000 and 2022:
Bolingbrook, Illinois:
+35.5%
Illinois:
+64.6%
Number of households with income < $10k:
Bolingbrook:
3.3% (880)
State:
5.9% (296,090)
Number of households with income $10k - 20k:
Bolingbrook:
4.5% (1,190)
Illinois:
6.6% (333,259)
Number of households with income $20k - 30k:
Bolingbrook:
7.9% (2,099)
Illinois:
6.8% (342,921)
Number of households with income $30k - 40k:
Bolingbrook:
5.5% (1,449)
State:
7.0% (355,254)
Number of households with income $40k - 50k:
Bolingbrook:
4.1% (1,092)
State:
6.7% (340,678)
Number of households with income $50k - 60k:
Bolingbrook:
7.5% (1,996)
State:
6.7% (339,405)
Number of households with income $60k - 75k:
Bolingbrook:
9.7% (2,578)
State:
9.2% (465,709)
Number of households with income $75k - 100k:
Bolingbrook:
11.1% (2,942)
State:
12.9% (651,353)
Number of households with income $100k - 125k:
Bolingbrook:
10.4% (2,778)
State:
10.3% (522,359)
Number of households with income $125k - 150k:
Bolingbrook:
11.1% (2,954)
Illinois:
7.3% (367,136)
Number of households with income $150k - 200k:
Bolingbrook:
14.4% (3,830)
Illinois:
9.0% (455,249)
Number of households with income > $200k:
Bolingbrook:
10.5% (2,797)
Illinois:
11.6% (586,947)
Aggregate household income in Bolingbrook in 2022: $2,838,362,400
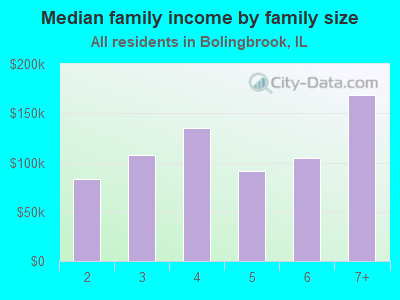
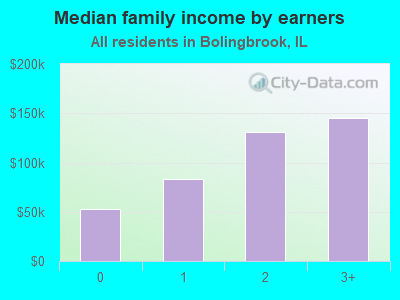
Median family income in Bolingbrook in 2022:
Bolingbrook:
$106,884
State:
$96,948
Number of families with income < $10k:
Bolingbrook:
2.2% (427)
Illinois:
3.4% (105,875)
Number of families with income $10k - 20k:
Bolingbrook:
3.0% (582)
State:
3.3% (105,017)
Number of families with income $20k - 30k:
Bolingbrook:
5.2% (1,020)
Illinois:
4.7% (146,403)
Number of families with income $30k - 40k:
Bolingbrook:
3.0% (594)
State:
5.3% (167,069)
Number of families with income $40k - 50k:
Bolingbrook:
4.4% (864)
State:
5.8% (181,164)
Number of families with income $50k - 60k:
Bolingbrook:
7.6% (1,502)
State:
6.1% (191,561)
Number of families with income $60k - 75k:
Bolingbrook:
9.7% (1,904)
Illinois:
9.0% (282,985)
Number of families with income $75k - 100k:
Bolingbrook:
10.6% (2,076)
State:
13.8% (432,725)
Number of families with income $100k - 125k:
Bolingbrook:
11.8% (2,314)
State:
11.9% (373,296)
Number of families with income $125k - 150k:
Bolingbrook:
12.0% (2,362)
State:
8.9% (279,791)
Number of families with income $150k - 200k:
Bolingbrook:
17.4% (3,412)
State:
11.9% (372,004)
Number of families with income > $200k:
Bolingbrook:
13.2% (2,588)
State:
15.9% (500,033)
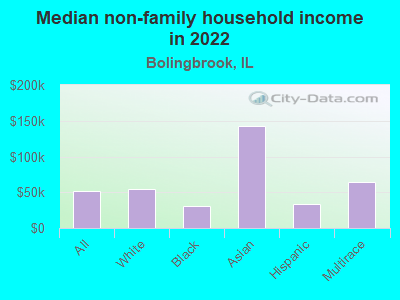
Median non-family income in Bolingbrook in 2022:
Bolingbrook:
$51,197
State:
$46,533
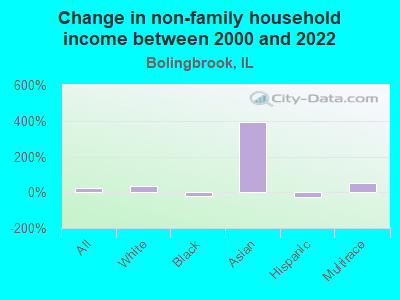
Change in median non-family income between 2000 and 2022:
Bolingbrook, Illinois:
+25.4%
State:
+64.0%
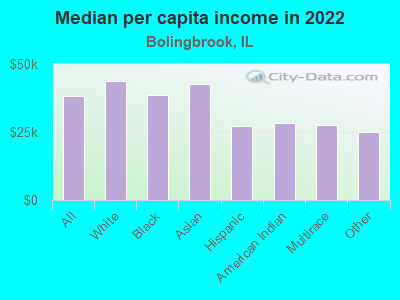
Median per capita income in Bolingbrook in 2022:
Bolingbrook:
$38,270
State:
$43,317
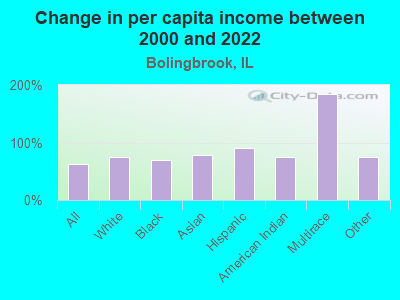
Change in median per capita income between 2000 and 2022:
Bolingbrook, Illinois:
+63.1%
State:
+87.5%
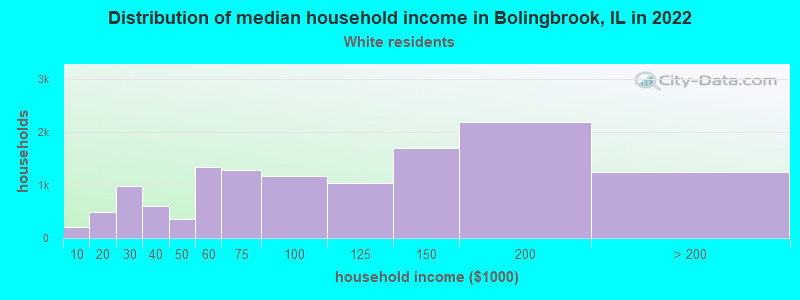
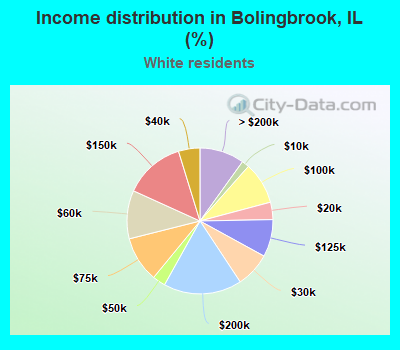
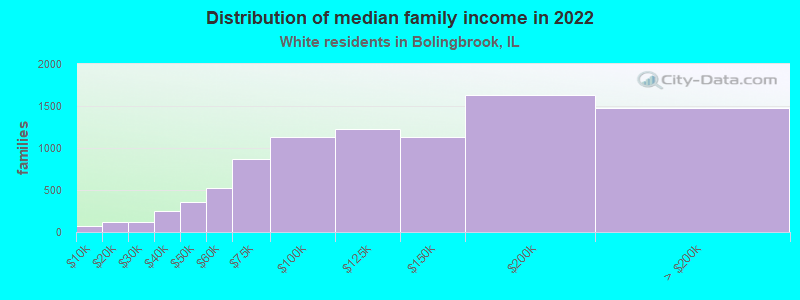
Income statistics for White residents
Median household income in Bolingbrook, IL in 2022:
Bolingbrook:
$98,944
State:
$83,346
Change in median household income between 2000 and 2022:
Bolingbrook, Illinois:
+42.4%
Illinois:
+67.5%
Number of households with income < $10k:
Bolingbrook:
1.6% (207)
Illinois:
4.5% (149,895)
Number of households with income $10k - 20k:
Bolingbrook:
3.8% (486)
State:
5.5% (184,529)
Number of households with income $20k - 30k:
Bolingbrook:
7.7% (978)
State:
6.1% (205,767)
Number of households with income $30k - 40k:
Bolingbrook:
4.7% (600)
State:
6.7% (225,572)
Number of households with income $40k - 50k:
Bolingbrook:
2.9% (362)
Illinois:
6.5% (216,965)
Number of households with income $50k - 60k:
Bolingbrook:
10.7% (1,352)
State:
6.6% (222,841)
Number of households with income $60k - 75k:
Bolingbrook:
10.1% (1,280)
State:
9.3% (312,758)
Number of households with income $75k - 100k:
Bolingbrook:
9.3% (1,177)
State:
12.9% (433,180)
Number of households with income $100k - 125k:
Bolingbrook:
8.3% (1,047)
Illinois:
10.7% (360,753)
Number of households with income $125k - 150k:
Bolingbrook:
13.5% (1,703)
State:
7.9% (266,532)
Number of households with income $150k - 200k:
Bolingbrook:
17.4% (2,195)
Illinois:
10.0% (337,357)
Number of households with income > $200k:
Bolingbrook:
9.9% (1,252)
State:
13.3% (446,069)
Aggregate household income in Bolingbrook in 2022: $1,422,311,700
Median family income in Bolingbrook in 2022:
Bolingbrook:
$125,261
State:
$107,938
Number of families with income < $10k:
Bolingbrook:
0.8% (73)
State:
2.2% (45,983)
Number of families with income $10k - 20k:
Bolingbrook:
1.4% (125)
State:
2.5% (50,574)
Number of families with income $20k - 30k:
Bolingbrook:
1.3% (116)
State:
3.5% (70,927)
Number of families with income $30k - 40k:
Bolingbrook:
2.8% (251)
State:
4.4% (90,563)
Number of families with income $40k - 50k:
Bolingbrook:
4.1% (363)
State:
5.0% (102,597)
Number of families with income $50k - 60k:
Bolingbrook:
5.9% (524)
Illinois:
5.8% (119,129)
Number of families with income $60k - 75k:
Bolingbrook:
9.8% (872)
State:
8.8% (179,665)
Number of families with income $75k - 100k:
Bolingbrook:
12.6% (1,126)
Illinois:
13.5% (276,887)
Number of families with income $100k - 125k:
Bolingbrook:
13.7% (1,223)
State:
12.5% (256,099)
Number of families with income $125k - 150k:
Bolingbrook:
12.7% (1,134)
Illinois:
9.8% (199,855)
Number of families with income $150k - 200k:
Bolingbrook:
18.3% (1,628)
State:
13.4% (274,569)
Number of families with income > $200k:
Bolingbrook:
16.5% (1,474)
State:
18.6% (381,354)
Median non-family income in Bolingbrook in 2022:
Bolingbrook:
$54,990
State:
$50,934
Change in median non-family income between 2000 and 2022:
Bolingbrook, Illinois:
+32.6%
State:
+70.7%
Median per capita income in Bolingbrook in 2022:
Bolingbrook:
$43,678
State:
$50,738
Change in median per capita income between 2000 and 2022:
Bolingbrook, Illinois:
+73.9%
State:
+95.5%
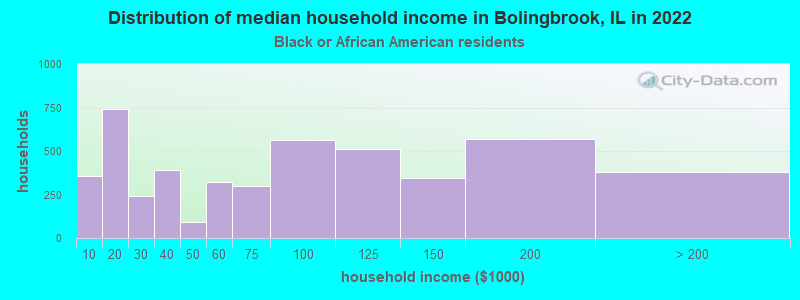
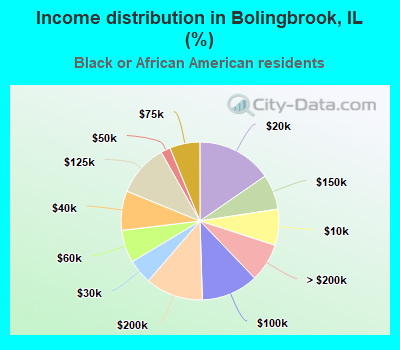
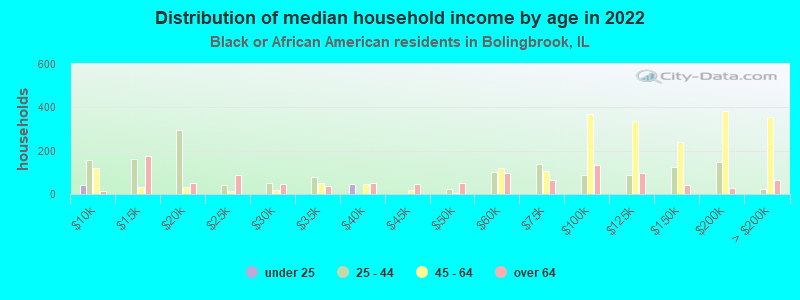
Income statistics for Black or African American residents
Median household income in Bolingbrook, IL in 2022:
Bolingbrook:
$86,726
Illinois:
$45,019
Change in median household income between 2000 and 2022:
Bolingbrook, Illinois:
+32.9%
State:
+42.0%
Number of households with income < $10k:
Bolingbrook:
7.4% (356)
State:
13.3% (92,224)
Number of households with income $10k - 20k:
Bolingbrook:
15.4% (741)
State:
13.5% (93,732)
Number of households with income $20k - 30k:
Bolingbrook:
5.1% (243)
Illinois:
9.9% (68,453)
Number of households with income $30k - 40k:
Bolingbrook:
8.1% (389)
State:
8.5% (59,072)
Number of households with income $40k - 50k:
Bolingbrook:
2.0% (94)
State:
7.9% (55,033)
Number of households with income $50k - 60k:
Bolingbrook:
6.7% (322)
State:
7.2% (49,556)
Number of households with income $60k - 75k:
Bolingbrook:
6.2% (298)
State:
7.8% (53,726)
Number of households with income $75k - 100k:
Bolingbrook:
11.7% (561)
State:
11.6% (80,439)
Number of households with income $100k - 125k:
Bolingbrook:
10.7% (513)
State:
7.5% (52,244)
Number of households with income $125k - 150k:
Bolingbrook:
7.2% (346)
Illinois:
3.9% (27,058)
Number of households with income $150k - 200k:
Bolingbrook:
11.8% (569)
Illinois:
4.6% (32,057)
Number of households with income > $200k:
Bolingbrook:
7.9% (378)
State:
4.1% (28,731)
Aggregate household income in Bolingbrook in 2022: $427,050,800
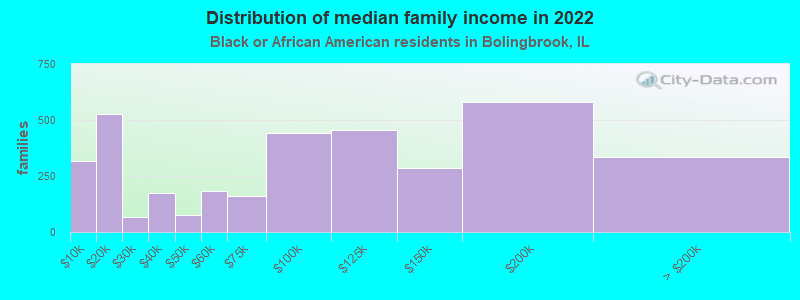
Median family income in Bolingbrook in 2022:
Bolingbrook:
$92,566
State:
$60,661
Number of families with income < $10k:
Bolingbrook:
8.9% (319)
State:
9.5% (35,136)
Number of families with income $10k - 20k:
Bolingbrook:
14.7% (528)
State:
7.9% (29,324)
Number of families with income $20k - 30k:
Bolingbrook:
1.9% (67)
State:
8.8% (32,666)
Number of families with income $30k - 40k:
Bolingbrook:
4.8% (174)
State:
7.8% (28,775)
Number of families with income $40k - 50k:
Bolingbrook:
2.2% (78)
State:
8.5% (31,429)
Number of families with income $50k - 60k:
Bolingbrook:
5.0% (181)
Illinois:
7.1% (26,341)
Number of families with income $60k - 75k:
Bolingbrook:
4.5% (161)
State:
8.3% (30,626)
Number of families with income $75k - 100k:
Bolingbrook:
12.2% (440)
Illinois:
14.0% (51,750)
Number of families with income $100k - 125k:
Bolingbrook:
12.7% (456)
State:
9.3% (34,471)
Number of families with income $125k - 150k:
Bolingbrook:
7.9% (284)
State:
5.7% (21,103)
Number of families with income $150k - 200k:
Bolingbrook:
16.1% (580)
State:
6.8% (25,177)
Number of families with income > $200k:
Bolingbrook:
9.2% (333)
State:
6.3% (23,371)
Median non-family income in Bolingbrook in 2022:
Bolingbrook:
$31,250
Illinois:
$29,966
Change in median non-family income between 2000 and 2022:: -20.8%
Bolingbrook, Illinois:
-20.8%
State:
+44.4%
Median per capita income in Bolingbrook in 2022:
Bolingbrook:
$38,685
State:
$28,045
Change in median per capita income between 2000 and 2022:
Bolingbrook, Illinois:
+68.7%
Illinois:
+90.2%
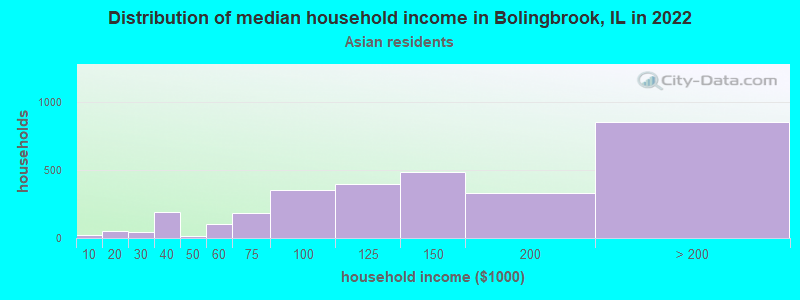
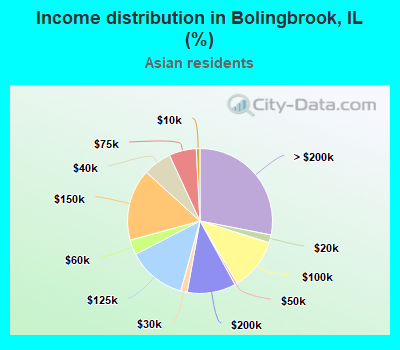
Income statistics for Asian residents
Median household income in Bolingbrook, IL in 2022:
Bolingbrook:
$133,725
State:
$104,287
Change in median household income between 2000 and 2022:
Bolingbrook, Illinois:
+77.0%
State:
+81.9%
Number of households with income < $10k:
Bolingbrook:
0.8% (25)
State:
5.3% (14,653)
Number of households with income $10k - 20k:
Bolingbrook:
1.7% (53)
Illinois:
4.5% (12,283)
Number of households with income $20k - 30k:
Bolingbrook:
1.4% (44)
State:
4.8% (13,135)
Number of households with income $30k - 40k:
Bolingbrook:
6.3% (193)
State:
5.0% (13,655)
Number of households with income $40k - 50k:
Bolingbrook:
0.6% (17)
State:
4.5% (12,357)
Number of households with income $50k - 60k:
Bolingbrook:
3.3% (101)
Illinois:
4.9% (13,568)
Number of households with income $60k - 75k:
Bolingbrook:
6.1% (185)
State:
7.1% (19,606)
Number of households with income $75k - 100k:
Bolingbrook:
11.6% (353)
State:
12.1% (33,349)
Number of households with income $100k - 125k:
Bolingbrook:
13.1% (399)
State:
9.7% (26,669)
Number of households with income $125k - 150k:
Bolingbrook:
16.0% (487)
State:
7.3% (20,172)
Number of households with income $150k - 200k:
Bolingbrook:
10.8% (330)
State:
11.5% (31,711)
Number of households with income > $200k:
Bolingbrook:
28.1% (855)
Illinois:
23.1% (63,411)
Aggregate household income in Bolingbrook in 2022: $499,114,700
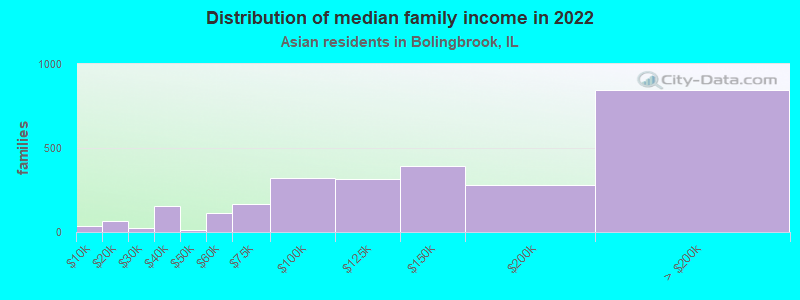
Median family income in Bolingbrook in 2022:
Bolingbrook:
$134,983
Illinois:
$124,630
Number of families with income < $10k:
Bolingbrook:
1.3% (35)
Illinois:
2.0% (3,841)
Number of families with income $10k - 20k:
Bolingbrook:
2.4% (65)
State:
2.6% (5,077)
Number of families with income $20k - 30k:
Bolingbrook:
0.8% (21)
Illinois:
4.4% (8,618)
Number of families with income $30k - 40k:
Bolingbrook:
5.7% (157)
State:
4.4% (8,628)
Number of families with income $40k - 50k:
Bolingbrook:
0.4% (11)
State:
3.9% (7,584)
Number of families with income $50k - 60k:
Bolingbrook:
4.1% (111)
Illinois:
4.1% (7,974)
Number of families with income $60k - 75k:
Bolingbrook:
6.2% (168)
State:
7.0% (13,773)
Number of families with income $75k - 100k:
Bolingbrook:
11.9% (324)
Illinois:
12.3% (24,156)
Number of families with income $100k - 125k:
Bolingbrook:
11.7% (318)
State:
9.6% (18,808)
Number of families with income $125k - 150k:
Bolingbrook:
14.3% (390)
State:
8.0% (15,639)
Number of families with income $150k - 200k:
Bolingbrook:
10.3% (281)
State:
13.9% (27,222)
Number of families with income > $200k:
Bolingbrook:
31.1% (848)
State:
28.0% (54,999)
Median non-family income in Bolingbrook in 2022:
Bolingbrook:
$143,177
State:
$57,292
Median per capita income in Bolingbrook in 2022:
Bolingbrook:
$42,726
State:
$52,977
Change in median per capita income between 2000 and 2022:
Bolingbrook, Illinois:
+78.8%
Illinois:
+119.5%
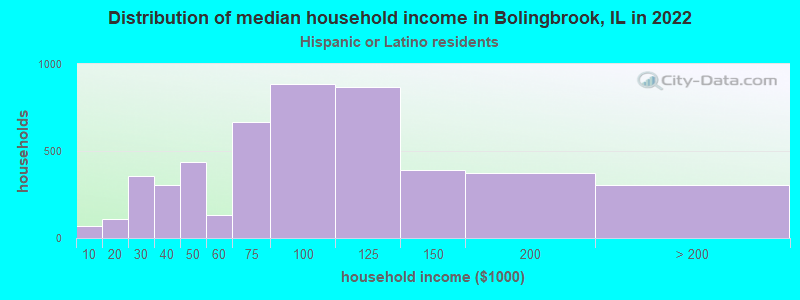
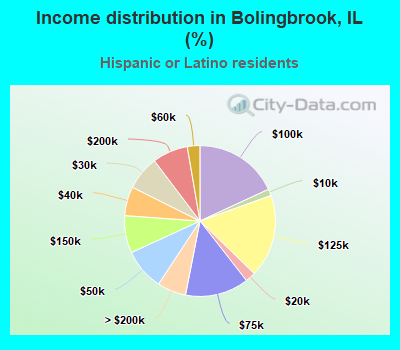
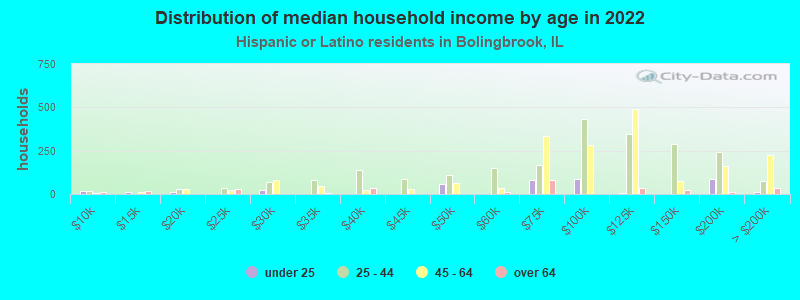
Income statistics for Hispanic or Latino residents
Median household income in Bolingbrook, IL in 2022:
Bolingbrook:
$83,915
State:
$72,139
Change in median household income between 2000 and 2022:
Bolingbrook, Illinois:
+33.0%
State:
+75.7%
Number of households with income < $10k:
Bolingbrook:
1.4% (69)
State:
4.9% (33,145)
Number of households with income $10k - 20k:
Bolingbrook:
2.2% (107)
State:
5.4% (36,345)
Number of households with income $20k - 30k:
Bolingbrook:
7.3% (357)
State:
7.5% (50,677)
Number of households with income $30k - 40k:
Bolingbrook:
6.2% (305)
State:
7.7% (52,008)
Number of households with income $40k - 50k:
Bolingbrook:
8.9% (434)
Illinois:
8.1% (54,702)
Number of households with income $50k - 60k:
Bolingbrook:
2.7% (132)
Illinois:
7.5% (51,062)
Number of households with income $60k - 75k:
Bolingbrook:
13.6% (666)
State:
11.3% (76,576)
Number of households with income $75k - 100k:
Bolingbrook:
18.1% (885)
Illinois:
15.5% (105,152)
Number of households with income $100k - 125k:
Bolingbrook:
17.8% (868)
State:
11.5% (77,760)
Number of households with income $125k - 150k:
Bolingbrook:
8.0% (391)
State:
7.3% (49,310)
Number of households with income $150k - 200k:
Bolingbrook:
7.6% (372)
State:
7.6% (51,233)
Number of households with income > $200k:
Bolingbrook:
6.2% (302)
State:
5.9% (40,028)
Aggregate household income in Bolingbrook in 2022: $535,637,200
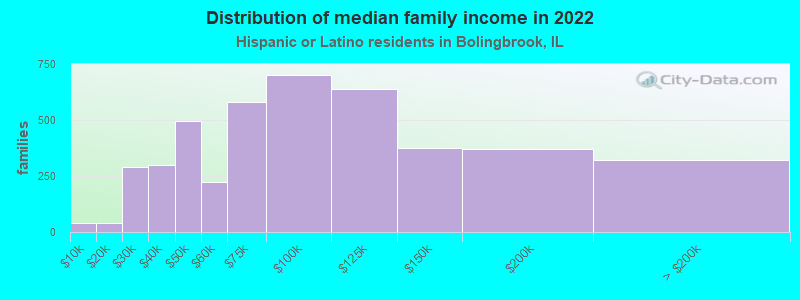
Median family income in Bolingbrook in 2022:
Bolingbrook:
$82,837
State:
$76,467
Number of families with income < $10k:
Bolingbrook:
0.9% (41)
Illinois:
3.8% (19,330)
Number of families with income $10k - 20k:
Bolingbrook:
0.9% (39)
State:
3.8% (19,314)
Number of families with income $20k - 30k:
Bolingbrook:
6.6% (289)
State:
6.8% (34,467)
Number of families with income $30k - 40k:
Bolingbrook:
6.9% (300)
State:
7.5% (37,976)
Number of families with income $40k - 50k:
Bolingbrook:
11.3% (497)
State:
7.7% (38,858)
Number of families with income $50k - 60k:
Bolingbrook:
5.1% (223)
State:
7.6% (38,606)
Number of families with income $60k - 75k:
Bolingbrook:
13.3% (581)
State:
11.5% (58,164)
Number of families with income $75k - 100k:
Bolingbrook:
16.0% (701)
State:
16.0% (81,055)
Number of families with income $100k - 125k:
Bolingbrook:
14.6% (638)
Illinois:
12.1% (61,491)
Number of families with income $125k - 150k:
Bolingbrook:
8.6% (376)
State:
8.0% (40,271)
Number of families with income $150k - 200k:
Bolingbrook:
8.4% (369)
State:
8.6% (43,536)
Number of families with income > $200k:
Bolingbrook:
7.4% (322)
State:
6.6% (33,240)
Median non-family income in Bolingbrook in 2022:
Bolingbrook:
$33,960
State:
$45,965
Change in median non-family income between 2000 and 2022:: -29.3%
Bolingbrook, Illinois:
-29.3%
State:
+75.9%
Median per capita income in Bolingbrook in 2022:
Bolingbrook:
$27,311
State:
$26,551
Change in median per capita income between 2000 and 2022:
Bolingbrook, Illinois:
+90.1%
Illinois:
+111.0%
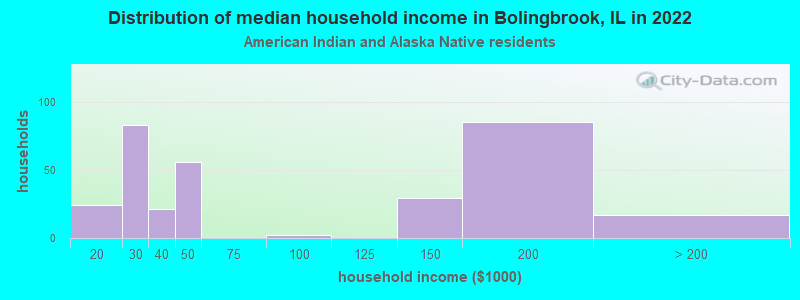
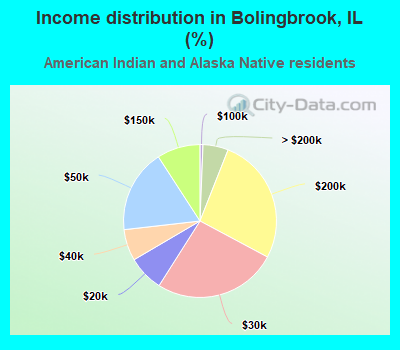
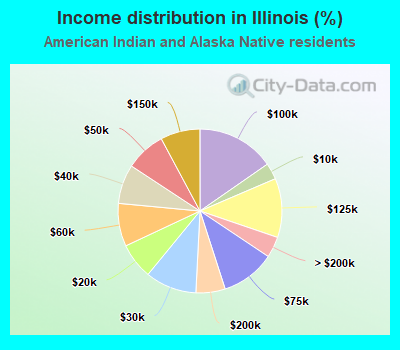
Income statistics for American Indian and Alaska Native residents
Number of households with income < $10k:
Bolingbrook:
0.0% (0)
State:
3.2% (935)
Number of households with income $10k - 20k:
Bolingbrook:
7.6% (24)
State:
7.1% (2,053)
Number of households with income $20k - 30k:
Bolingbrook:
26.2% (83)
State:
10.1% (2,939)
Number of households with income $30k - 40k:
Bolingbrook:
6.6% (21)
State:
7.7% (2,246)
Number of households with income $40k - 50k:
Bolingbrook:
17.7% (56)
State:
7.9% (2,300)
Number of households with income $50k - 60k:
Bolingbrook:
0.0% (0)
Illinois:
8.5% (2,460)
Number of households with income $60k - 75k:
Bolingbrook:
0.0% (0)
State:
10.7% (3,095)
Number of households with income $75k - 100k:
Bolingbrook:
0.6% (2)
Illinois:
15.3% (4,451)
Number of households with income $100k - 125k:
Bolingbrook:
0.0% (0)
Illinois:
11.7% (3,386)
Number of households with income $125k - 150k:
Bolingbrook:
9.1% (29)
State:
7.8% (2,269)
Number of households with income $150k - 200k:
Bolingbrook:
26.8% (85)
Illinois:
5.8% (1,673)
Number of households with income > $200k:
Bolingbrook:
5.4% (17)
State:
4.1% (1,198)
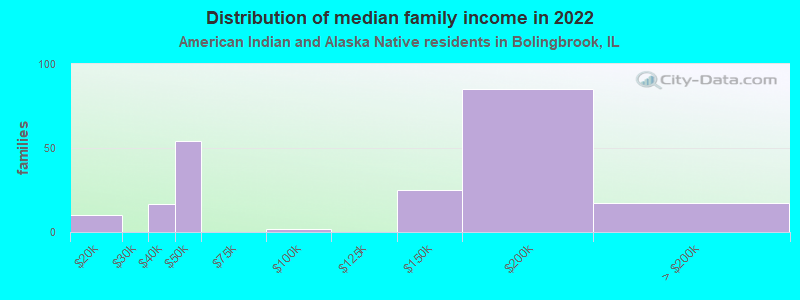
Aggregate household income in Bolingbrook in 2022: $20,023,375
Median family income in Bolingbrook in 2022:
Bolingbrook:
$100,922
State:
$73,202
Number of families with income $10k - 20k:
Bolingbrook:
4.9% (10)
State:
4.0% (827)
Number of families with income $30k - 40k:
Bolingbrook:
7.9% (17)
State:
6.0% (1,236)
Number of families with income $40k - 50k:
Bolingbrook:
25.7% (54)
State:
8.6% (1,774)
Number of families with income $75k - 100k:
Bolingbrook:
1.0% (2)
State:
17.1% (3,515)
Number of families with income $125k - 150k:
Bolingbrook:
11.8% (25)
State:
7.4% (1,533)
Number of families with income $150k - 200k:
Bolingbrook:
40.4% (85)
State:
7.4% (1,525)
Number of families with income > $200k:
Bolingbrook:
8.3% (17)
State:
4.8% (983)
Median per capita income in Bolingbrook in 2022:
Bolingbrook:
$28,436
Illinois:
$26,979
Change in median per capita income between 2000 and 2022:
Bolingbrook, Illinois:
+74.5%
State:
+64.2%
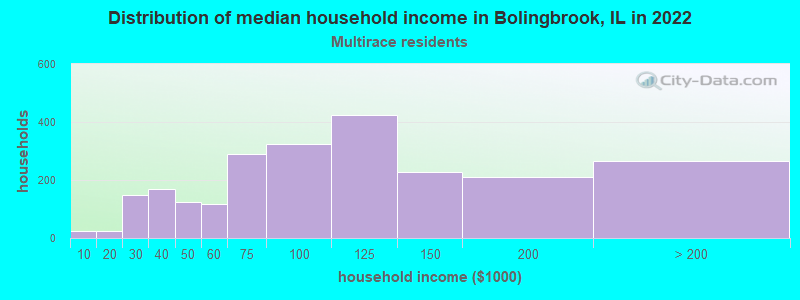
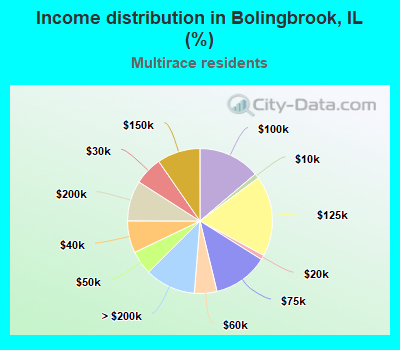
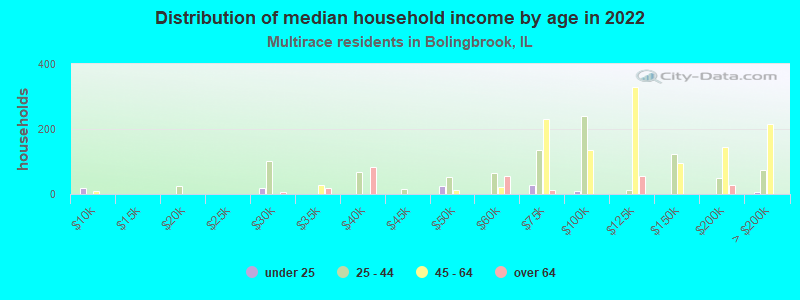
Income statistics for Multirace residents
Median household income in Bolingbrook, IL in 2022:
Bolingbrook:
$90,762
State:
$71,185
Change in median household income between 2000 and 2022:
Bolingbrook, Illinois:
+64.0%
State:
+81.4%
Number of households with income < $10k:
Bolingbrook:
1.1% (25)
State:
5.3% (21,595)
Number of households with income $10k - 20k:
Bolingbrook:
1.0% (24)
State:
6.5% (26,720)
Number of households with income $20k - 30k:
Bolingbrook:
6.3% (148)
State:
8.0% (32,573)
Number of households with income $30k - 40k:
Bolingbrook:
7.2% (168)
State:
8.4% (34,383)
Number of households with income $40k - 50k:
Bolingbrook:
5.3% (125)
State:
7.4% (30,234)
Number of households with income $50k - 60k:
Bolingbrook:
5.0% (118)
State:
6.9% (28,432)
Number of households with income $60k - 75k:
Bolingbrook:
12.3% (289)
State:
10.2% (41,780)
Number of households with income $75k - 100k:
Bolingbrook:
13.8% (324)
State:
13.0% (53,426)
Number of households with income $100k - 125k:
Bolingbrook:
18.0% (423)
State:
10.5% (43,126)
Number of households with income $125k - 150k:
Bolingbrook:
9.6% (226)
State:
7.6% (31,153)
Number of households with income $150k - 200k:
Bolingbrook:
9.0% (212)
State:
7.6% (30,946)
Number of households with income > $200k:
Bolingbrook:
11.3% (265)
Illinois:
8.6% (35,208)
Aggregate household income in Bolingbrook in 2022: $282,107,000
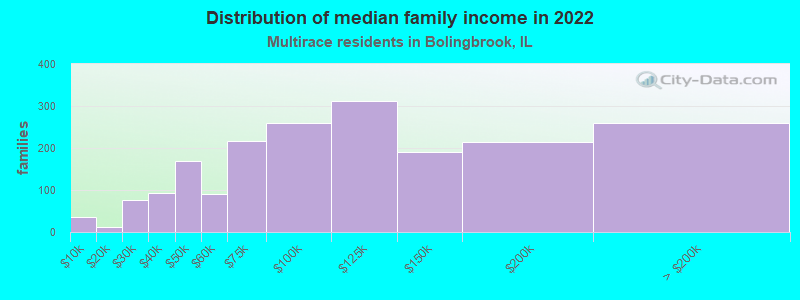
Median family income in Bolingbrook in 2022:
Bolingbrook:
$91,929
State:
$84,400
Number of families with income < $10k:
Bolingbrook:
1.8% (35)
State:
3.9% (10,812)
Number of families with income $10k - 20k:
Bolingbrook:
0.6% (11)
State:
4.2% (11,692)
Number of families with income $20k - 30k:
Bolingbrook:
4.0% (77)
State:
6.3% (17,559)
Number of families with income $30k - 40k:
Bolingbrook:
4.9% (94)
State:
7.5% (20,780)
Number of families with income $40k - 50k:
Bolingbrook:
8.7% (168)
State:
7.1% (19,595)
Number of families with income $50k - 60k:
Bolingbrook:
4.7% (91)
State:
6.9% (19,177)
Number of families with income $60k - 75k:
Bolingbrook:
11.2% (216)
State:
9.3% (25,936)
Number of families with income $75k - 100k:
Bolingbrook:
13.5% (260)
State:
13.6% (37,857)
Number of families with income $100k - 125k:
Bolingbrook:
16.2% (313)
Illinois:
12.2% (33,852)
Number of families with income $125k - 150k:
Bolingbrook:
9.8% (190)
State:
9.0% (25,085)
Number of families with income $150k - 200k:
Bolingbrook:
11.1% (214)
State:
9.5% (26,306)
Number of families with income > $200k:
Bolingbrook:
13.5% (260)
State:
10.4% (28,926)
Median non-family income in Bolingbrook in 2022:
Bolingbrook:
$63,725
Illinois:
$43,615
Change in median non-family income between 2000 and 2022:
Bolingbrook, Illinois:
+53.6%
State:
+77.3%
Median per capita income in Bolingbrook in 2022:
Bolingbrook:
$27,700
State:
$29,285
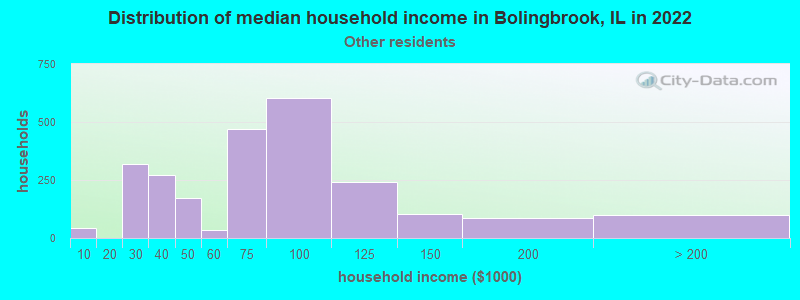
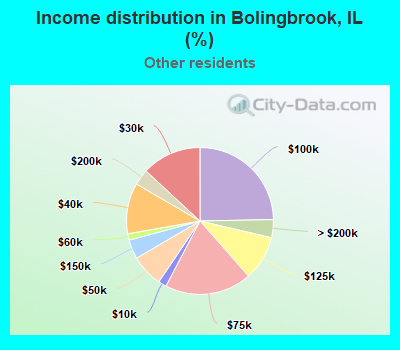
Income statistics for other residents
Median household income in Bolingbrook, IL in 2022:
Bolingbrook:
$67,483
State:
$71,711
Number of households with income < $10k:
Bolingbrook:
1.8% (44)
Illinois:
5.7% (16,383)
Number of households with income $10k - 20k:
Bolingbrook:
0.0% (0)
State:
4.8% (13,886)
Number of households with income $20k - 30k:
Bolingbrook:
13.1% (320)
Illinois:
7.0% (20,054)
Number of households with income $30k - 40k:
Bolingbrook:
11.2% (273)
State:
7.0% (20,038)
Number of households with income $40k - 50k:
Bolingbrook:
7.1% (174)
State:
8.3% (23,759)
Number of households with income $50k - 60k:
Bolingbrook:
1.4% (35)
State:
7.8% (22,410)
Number of households with income $60k - 75k:
Bolingbrook:
19.1% (468)
State:
12.0% (34,448)
Number of households with income $75k - 100k:
Bolingbrook:
24.7% (604)
Illinois:
16.2% (46,508)
Number of households with income $100k - 125k:
Bolingbrook:
9.9% (241)
State:
12.5% (35,952)
Number of households with income $125k - 150k:
Bolingbrook:
4.2% (103)
State:
6.9% (19,732)
Number of households with income $150k - 200k:
Bolingbrook:
3.5% (86)
Illinois:
7.5% (21,422)
Number of households with income > $200k:
Bolingbrook:
4.0% (97)
Illinois:
4.3% (12,194)
Aggregate household income in Bolingbrook in 2022: $177,709,100
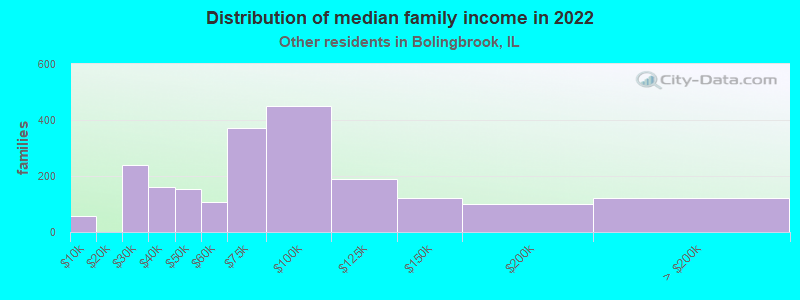
Median family income in Bolingbrook in 2022:
Bolingbrook:
$67,266
Illinois:
$74,069
Number of families with income < $10k:
Bolingbrook:
2.8% (57)
State:
4.1% (9,256)
Number of families with income $20k - 30k:
Bolingbrook:
11.6% (241)
State:
6.8% (15,193)
Number of families with income $30k - 40k:
Bolingbrook:
7.6% (159)
Illinois:
7.6% (17,087)
Number of families with income $40k - 50k:
Bolingbrook:
7.4% (153)
State:
8.1% (18,155)
Number of families with income $50k - 60k:
Bolingbrook:
5.2% (108)
Illinois:
7.4% (16,614)
Number of families with income $60k - 75k:
Bolingbrook:
17.9% (372)
State:
13.4% (30,011)
Number of families with income $75k - 100k:
Bolingbrook:
21.7% (451)
Illinois:
17.2% (38,560)
Number of families with income $100k - 125k:
Bolingbrook:
9.2% (190)
State:
12.3% (27,638)
Number of families with income $125k - 150k:
Bolingbrook:
5.9% (122)
State:
7.3% (16,287)
Number of families with income $150k - 200k:
Bolingbrook:
4.9% (101)
State:
7.7% (17,122)
Number of families with income > $200k:
Bolingbrook:
5.9% (122)
State:
4.6% (10,400)
Median per capita income in Bolingbrook in 2022:
Bolingbrook:
$25,135
State:
$25,392
Change in median per capita income between 2000 and 2022:
Bolingbrook, Illinois:
+74.8%
State:
+117.4%
Discuss Bolingbrook, Illinois (IL) on our hugely popular Illinois forum.