Braintree, Massachusetts (MA) income map, earnings map, and wages data
The median household income in Braintree, MA in 2022 was $113,025, which was 16.4% greater than the median annual income of $94,488 across the entire state of Massachusetts. Compared to the median income of $61,822 in 2000 this represents an increase of 45.3%. The per capita income in 2022 was $58,391, which means an increase of 50.9% compared to 2000 when it was $28,667.
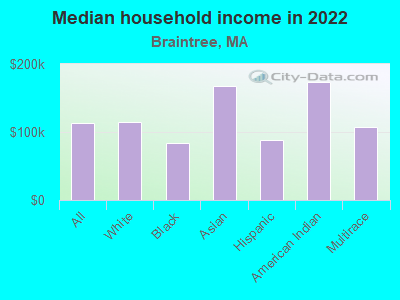
Income statistics for all residents
Median household income in Braintree, MA in 2022:| Braintree: | $113,026 |
| Massachusetts: | $94,488 |
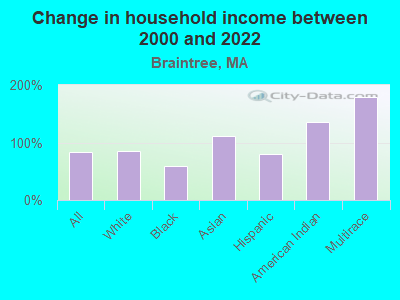
Change in median household income between 2000 and 2022:| Braintree, Massachusetts: | +82.8% |
| State: | +87.1% |
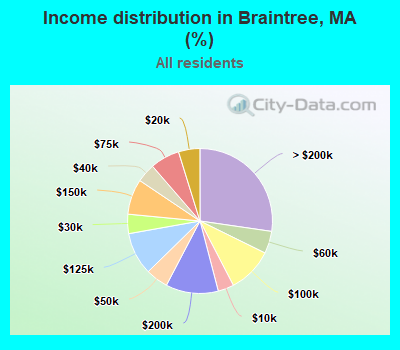
Number of households with income < $10k:| Braintree: | 3.6% (9,769) |
| State: | 5.2% (146,170) |
Number of households with income $10k - 20k:| Braintree: | 4.8% (13,124) |
| State: | 6.4% (180,001) |
Number of households with income $20k - 30k:| Braintree: | 4.3% (11,838) |
| State: | 5.6% (156,667) |
Number of households with income $30k - 40k:| Braintree: | 4.2% (11,588) |
| State: | 5.6% (157,168) |
Number of households with income $40k - 50k:| Braintree: | 5.0% (13,775) |
| Massachusetts: | 5.4% (151,455) |
Number of households with income $50k - 60k:| Braintree: | 5.0% (13,677) |
| Massachusetts: | 5.1% (142,726) |
Number of households with income $60k - 75k:| Braintree: | 6.6% (18,056) |
| State: | 7.6% (212,203) |
Number of households with income $75k - 100k:| Braintree: | 10.1% (27,738) |
| State: | 11.3% (317,064) |
Number of households with income $100k - 125k:| Braintree: | 9.5% (26,140) |
| State: | 9.7% (270,603) |
Number of households with income $125k - 150k:| Braintree: | 7.9% (21,741) |
| State: | 8.0% (223,140) |
Number of households with income $150k - 200k:| Braintree: | 11.7% (32,220) |
| State: | 11.0% (308,695) |
Number of households with income > $200k:| Braintree: | 27.3% (75,021) |
| Massachusetts: | 19.0% (531,884) |
Aggregate household income in Braintree in 2022: $21,131,326,628
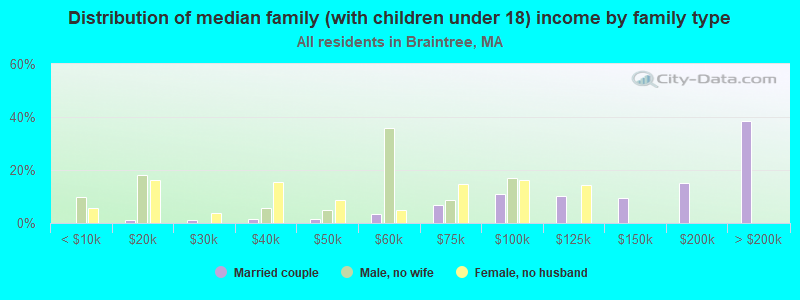
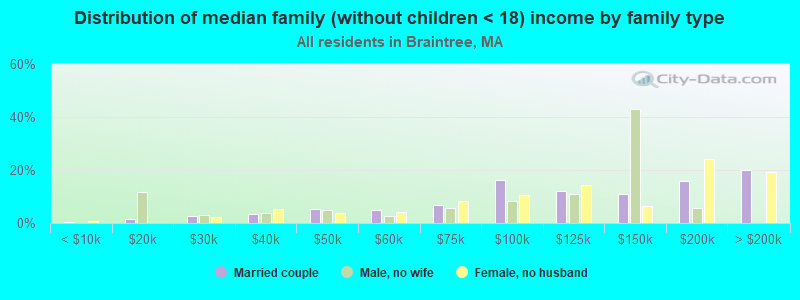
Median family income in Braintree in 2022:| Braintree: | $145,417 |
| Massachusetts: | $120,263 |
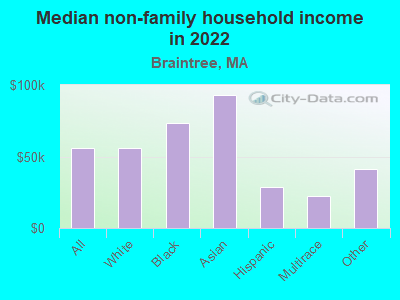
Median non-family income in Braintree in 2022:| Braintree: | $56,052 |
| State: | $55,979 |
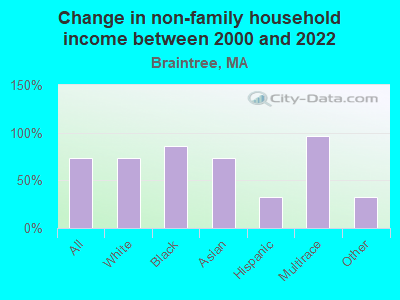
Change in median non-family income between 2000 and 2022:| Braintree, Massachusetts: | +73.0% |
| Massachusetts: | +88.0% |
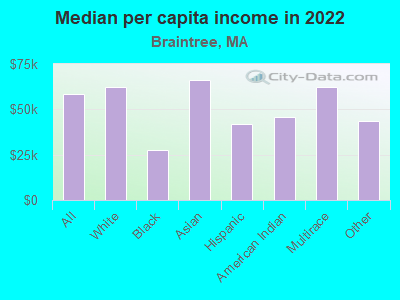
Median per capita income in Braintree in 2022:| Braintree: | $58,391 |
| State: | $54,025 |
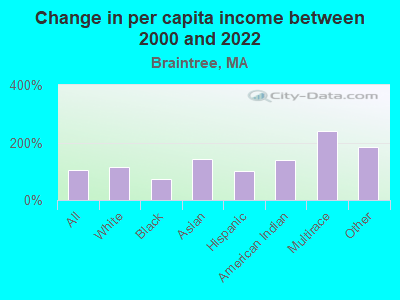
Change in median per capita income between 2000 and 2022:| Braintree, Massachusetts: | +103.7% |
| State: | +108.2% |
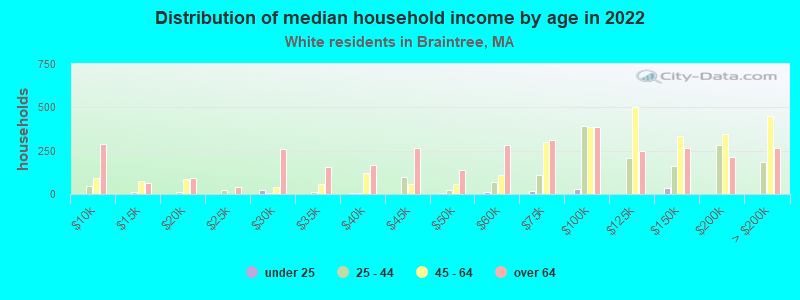
Income statistics for White residents
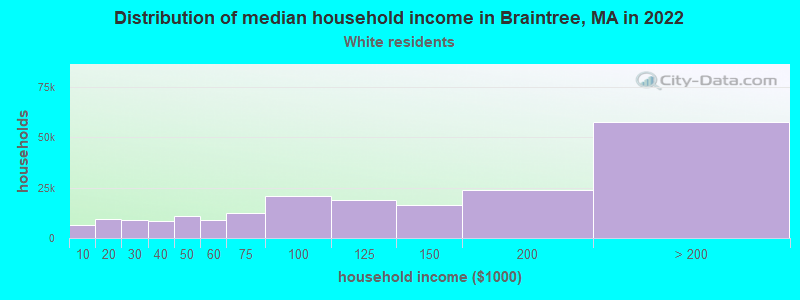
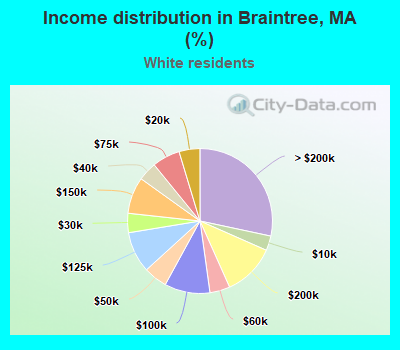
Median household income in Braintree, MA in 2022:| Braintree: | $114,785 |
| Massachusetts: | $101,391 |
Change in median household income between 2000 and 2022:| Braintree, Massachusetts: | +85.3% |
| Massachusetts: | +93.3% |
Number of households with income < $10k:| Braintree: | 3.3% (6,639) |
| Massachusetts: | 4.4% (91,120) |
Number of households with income $10k - 20k:| Braintree: | 4.7% (9,466) |
| Massachusetts: | 5.9% (122,055) |
Number of households with income $20k - 30k:| Braintree: | 4.3% (8,751) |
| State: | 5.1% (105,311) |
Number of households with income $30k - 40k:| Braintree: | 4.2% (8,567) |
| State: | 5.3% (110,239) |
Number of households with income $40k - 50k:| Braintree: | 5.3% (10,717) |
| Massachusetts: | 5.0% (104,636) |
Number of households with income $50k - 60k:| Braintree: | 4.5% (9,107) |
| State: | 4.8% (99,486) |
Number of households with income $60k - 75k:| Braintree: | 6.2% (12,609) |
| State: | 7.5% (155,124) |
Number of households with income $75k - 100k:| Braintree: | 10.2% (20,629) |
| State: | 11.4% (236,252) |
Number of households with income $100k - 125k:| Braintree: | 9.2% (18,629) |
| State: | 9.9% (204,731) |
Number of households with income $125k - 150k:| Braintree: | 8.2% (16,631) |
| Massachusetts: | 8.5% (175,324) |
Number of households with income $150k - 200k:| Braintree: | 11.7% (23,758) |
| Massachusetts: | 11.7% (242,980) |
Number of households with income > $200k:| Braintree: | 28.4% (57,597) |
| State: | 20.5% (425,966) |
Aggregate household income in Braintree in 2022: $15,513,137,416
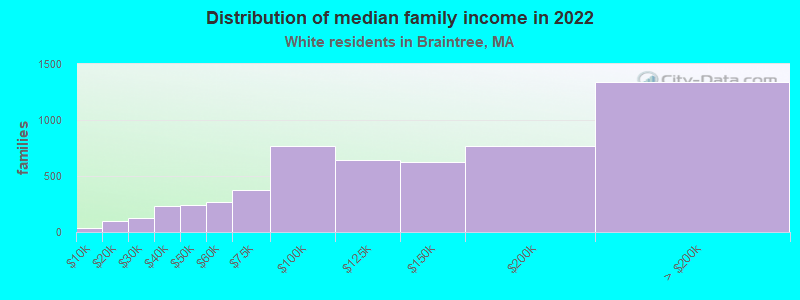
Median family income in Braintree in 2022:| Braintree: | $151,055 |
| Massachusetts: | $133,153 |
Number of families with income < $10k:| Braintree: | 0.7% (36) |
| Massachusetts: | 2.0% (25,038) |
Number of families with income $10k - 20k:| Braintree: | 1.7% (95) |
| Massachusetts: | 2.1% (26,403) |
Number of families with income $20k - 30k:| Braintree: | 2.3% (125) |
| State: | 2.6% (32,525) |
Number of families with income $30k - 40k:| Braintree: | 4.3% (236) |
| Massachusetts: | 3.9% (48,079) |
Number of families with income $40k - 50k:| Braintree: | 4.3% (237) |
| State: | 3.8% (46,908) |
Number of families with income $50k - 60k:| Braintree: | 4.9% (269) |
| Massachusetts: | 3.8% (46,476) |
Number of families with income $60k - 75k:| Braintree: | 6.8% (373) |
| State: | 6.4% (79,040) |
Number of families with income $75k - 100k:| Braintree: | 14.0% (770) |
| State: | 11.1% (137,395) |
Number of families with income $100k - 125k:| Braintree: | 11.6% (639) |
| Massachusetts: | 11.1% (136,771) |
Number of families with income $125k - 150k:| Braintree: | 11.4% (626) |
| State: | 10.0% (123,709) |
Number of families with income $150k - 200k:| Braintree: | 13.9% (768) |
| State: | 14.7% (181,602) |
Number of families with income > $200k:| Braintree: | 24.3% (1,342) |
| State: | 28.5% (351,887) |
Median non-family income in Braintree in 2022:| Braintree: | $55,895 |
| State: | $59,323 |
Change in median non-family income between 2000 and 2022:| Braintree, Massachusetts: | +73.0% |
| State: | +94.3% |
Median per capita income in Braintree in 2022:| Braintree: | $62,157 |
| Massachusetts: | $60,804 |
Change in median per capita income between 2000 and 2022:| Braintree, Massachusetts: | +114.1% |
| State: | +118.7% |
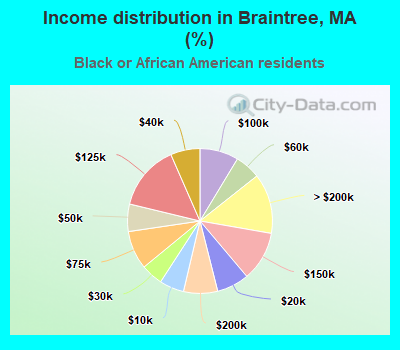
Income statistics for Black or African American residents
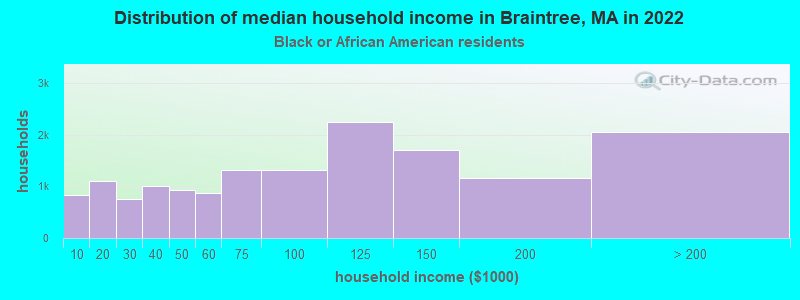
Median household income in Braintree, MA in 2022:| Braintree: | $83,957 |
| State: | $63,189 |
Change in median household income between 2000 and 2022:| Braintree, Massachusetts: | +58.5% |
| State: | +87.4% |
Number of households with income < $10k:| Braintree: | 5.5% (839) |
| Massachusetts: | 9.1% (15,797) |
Number of households with income $10k - 20k:| Braintree: | 7.2% (1,106) |
| State: | 9.4% (16,267) |
Number of households with income $20k - 30k:| Braintree: | 4.9% (752) |
| State: | 7.8% (13,520) |
Number of households with income $30k - 40k:| Braintree: | 6.6% (1,005) |
| Massachusetts: | 8.3% (14,412) |
Number of households with income $40k - 50k:| Braintree: | 6.1% (938) |
| State: | 7.9% (13,790) |
Number of households with income $50k - 60k:| Braintree: | 5.7% (873) |
| State: | 5.8% (10,041) |
Number of households with income $60k - 75k:| Braintree: | 8.6% (1,318) |
| Massachusetts: | 8.5% (14,822) |
Number of households with income $75k - 100k:| Braintree: | 8.7% (1,327) |
| Massachusetts: | 11.0% (19,122) |
Number of households with income $100k - 125k:| Braintree: | 14.7% (2,248) |
| State: | 8.4% (14,575) |
Number of households with income $125k - 150k:| Braintree: | 11.1% (1,702) |
| State: | 6.0% (10,429) |
Number of households with income $150k - 200k:| Braintree: | 7.6% (1,168) |
| State: | 7.2% (12,539) |
Number of households with income > $200k:| Braintree: | 13.4% (2,054) |
| State: | 10.5% (18,185) |
Aggregate household income in Braintree in 2022: $23,720,326
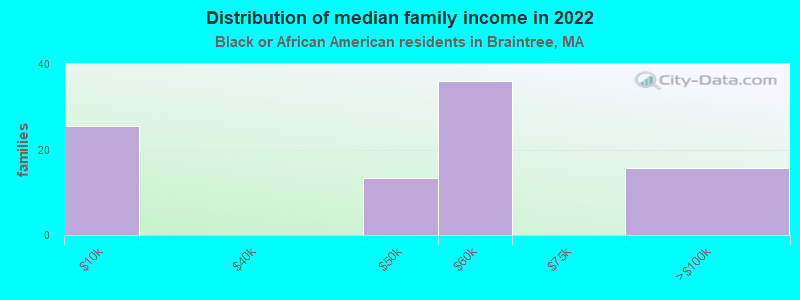
Median family income in Braintree in 2022:| Braintree: | $84,312 |
| State: | $79,815 |
Number of families with income < $10k:| Braintree: | 28.1% (26) |
| Massachusetts: | 6.3% (6,915) |
Number of families with income $40k - 50k:| Braintree: | 14.6% (13) |
| State: | 7.9% (8,656) |
Number of families with income $50k - 60k:| Braintree: | 39.8% (36) |
| State: | 6.4% (6,986) |
Number of families with income $75k - 100k:| Braintree: | 17.4% (16) |
| State: | 11.5% (12,654) |
Median non-family income in Braintree in 2022:| Braintree: | $73,629 |
| State: | $38,934 |
Change in median non-family income between 2000 and 2022:| Braintree, Massachusetts: | +86.5% |
| Massachusetts: | +69.2% |
Median per capita income in Braintree in 2022:| Braintree: | $27,757 |
| State: | $33,524 |
Change in median per capita income between 2000 and 2022:| Braintree, Massachusetts: | +73.4% |
| Massachusetts: | +109.4% |
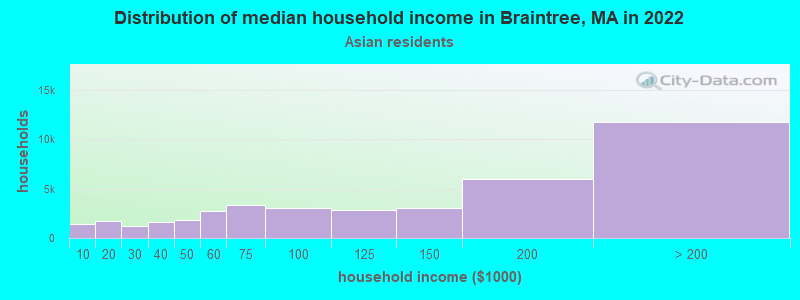
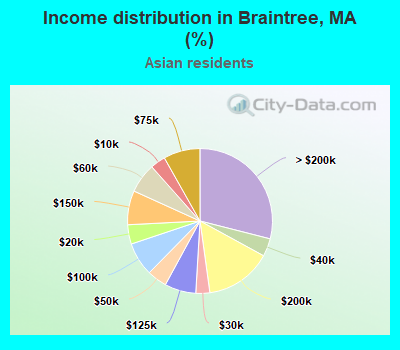
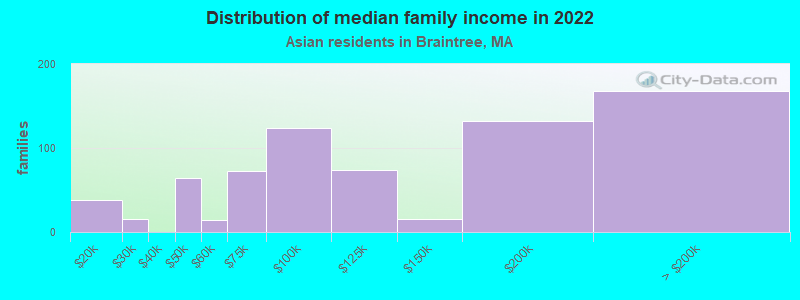
Income statistics for Asian residents
Median household income in Braintree, MA in 2022:| Braintree: | $168,179 |
| State: | $117,855 |
Change in median household income between 2000 and 2022:| Braintree, Massachusetts: | +110.7% |
| Massachusetts: | +129.9% |
Number of households with income < $10k:| Braintree: | 3.4% (1,369) |
| State: | 6.8% (11,982) |
Number of households with income $10k - 20k:| Braintree: | 4.3% (1,748) |
| State: | 4.8% (8,376) |
Number of households with income $20k - 30k:| Braintree: | 3.1% (1,261) |
| State: | 3.7% (6,558) |
Number of households with income $30k - 40k:| Braintree: | 4.0% (1,616) |
| Massachusetts: | 3.3% (5,748) |
Number of households with income $40k - 50k:| Braintree: | 4.4% (1,786) |
| State: | 4.1% (7,192) |
Number of households with income $50k - 60k:| Braintree: | 6.7% (2,691) |
| State: | 5.0% (8,734) |
Number of households with income $60k - 75k:| Braintree: | 8.2% (3,306) |
| Massachusetts: | 5.8% (10,203) |
Number of households with income $75k - 100k:| Braintree: | 7.5% (3,037) |
| State: | 8.6% (15,154) |
Number of households with income $100k - 125k:| Braintree: | 7.0% (2,829) |
| Massachusetts: | 10.8% (18,942) |
Number of households with income $125k - 150k:| Braintree: | 7.6% (3,071) |
| State: | 8.0% (14,037) |
Number of households with income $150k - 200k:| Braintree: | 14.8% (5,999) |
| State: | 12.5% (21,856) |
Number of households with income > $200k:| Braintree: | 29.0% (11,718) |
| State: | 26.6% (46,694) |
Aggregate household income in Braintree in 2022: $169,489,716
Median family income in Braintree in 2022:| Braintree: | $175,281 |
| State: | $140,113 |
Number of families with income $10k - 20k:| Braintree: | 5.3% (38) |
| State: | 3.5% (4,118) |
Number of families with income $20k - 30k:| Braintree: | 2.2% (16) |
| State: | 2.3% (2,708) |
Number of families with income $40k - 50k:| Braintree: | 8.9% (64) |
| Massachusetts: | 3.9% (4,621) |
Number of families with income $50k - 60k:| Braintree: | 1.9% (14) |
| Massachusetts: | 3.9% (4,606) |
Number of families with income $60k - 75k:| Braintree: | 10.1% (73) |
| Massachusetts: | 6.1% (7,105) |
Number of families with income $75k - 100k:| Braintree: | 17.2% (124) |
| Massachusetts: | 8.5% (10,022) |
Number of families with income $100k - 125k:| Braintree: | 10.3% (74) |
| Massachusetts: | 10.0% (11,697) |
Number of families with income $125k - 150k:| Braintree: | 2.3% (16) |
| State: | 8.6% (10,071) |
Number of families with income $150k - 200k:| Braintree: | 18.4% (132) |
| State: | 13.2% (15,478) |
Number of families with income > $200k:| Braintree: | 23.4% (168) |
| Massachusetts: | 34.0% (39,856) |
Median non-family income in Braintree in 2022:| Braintree: | $93,271 |
| State: | $71,440 |
Change in median non-family income between 2000 and 2022:| Braintree, Massachusetts: | +73.5% |
| State: | +128.0% |
Median per capita income in Braintree in 2022:| Braintree: | $66,271 |
| Massachusetts: | $58,900 |
Change in median per capita income between 2000 and 2022:| Braintree, Massachusetts: | +141.2% |
| State: | +174.6% |
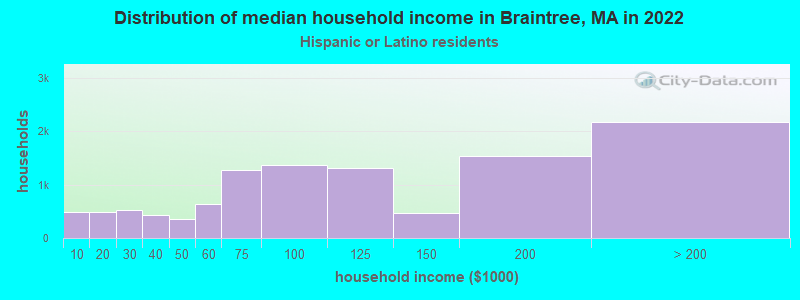
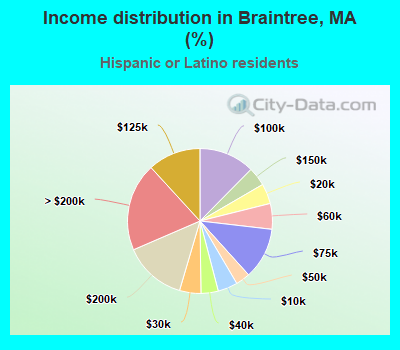
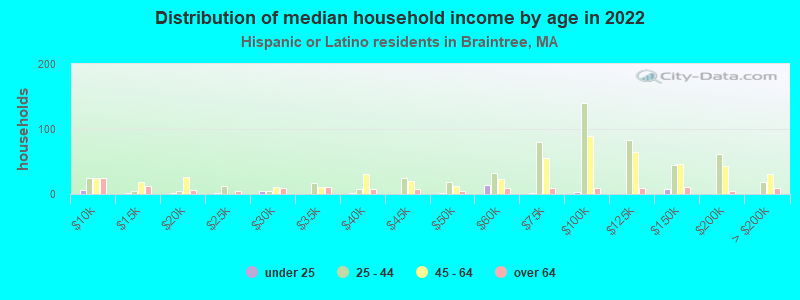
Income statistics for Hispanic or Latino residents
Median household income in Braintree, MA in 2022:| Braintree: | $87,644 |
| Massachusetts: | $61,523 |
Change in median household income between 2000 and 2022:| Braintree, Massachusetts: | +79.8% |
| State: | +125.4% |
Number of households with income < $10k:| Braintree: | 4.4% (486) |
| State: | 8.8% (25,307) |
Number of households with income $10k - 20k:| Braintree: | 4.5% (495) |
| State: | 10.0% (28,653) |
Number of households with income $20k - 30k:| Braintree: | 4.8% (526) |
| State: | 8.8% (25,189) |
Number of households with income $30k - 40k:| Braintree: | 3.9% (425) |
| State: | 7.2% (20,822) |
Number of households with income $40k - 50k:| Braintree: | 3.2% (353) |
| Massachusetts: | 7.2% (20,817) |
Number of households with income $50k - 60k:| Braintree: | 5.7% (633) |
| State: | 6.5% (18,748) |
Number of households with income $60k - 75k:| Braintree: | 11.5% (1,264) |
| State: | 8.8% (25,390) |
Number of households with income $75k - 100k:| Braintree: | 12.4% (1,369) |
| Massachusetts: | 12.0% (34,488) |
Number of households with income $100k - 125k:| Braintree: | 11.8% (1,301) |
| Massachusetts: | 8.6% (24,599) |
Number of households with income $125k - 150k:| Braintree: | 4.2% (462) |
| State: | 6.2% (17,743) |
Number of households with income $150k - 200k:| Braintree: | 13.9% (1,536) |
| State: | 7.3% (21,017) |
Number of households with income > $200k:| Braintree: | 19.7% (2,169) |
| State: | 8.6% (24,606) |
Aggregate household income in Braintree in 2022: $85,558,254
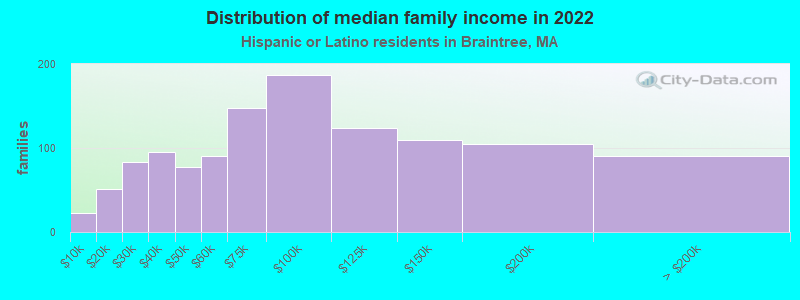
Median family income in Braintree in 2022:| Braintree: | $219,333 |
| State: | $66,072 |
Number of families with income < $10k:| Braintree: | 1.9% (23) |
| State: | 6.2% (12,456) |
Number of families with income $10k - 20k:| Braintree: | 4.4% (51) |
| State: | 6.0% (12,071) |
Number of families with income $20k - 30k:| Braintree: | 7.0% (83) |
| Massachusetts: | 10.1% (20,376) |
Number of families with income $30k - 40k:| Braintree: | 8.0% (95) |
| State: | 8.2% (16,470) |
Number of families with income $40k - 50k:| Braintree: | 6.5% (77) |
| State: | 7.4% (14,829) |
Number of families with income $50k - 60k:| Braintree: | 7.6% (90) |
| State: | 7.3% (14,643) |
Number of families with income $60k - 75k:| Braintree: | 12.5% (148) |
| State: | 10.6% (21,252) |
Number of families with income $75k - 100k:| Braintree: | 15.8% (187) |
| State: | 12.0% (24,088) |
Number of families with income $100k - 125k:| Braintree: | 10.5% (124) |
| Massachusetts: | 8.9% (17,954) |
Number of families with income $125k - 150k:| Braintree: | 9.3% (110) |
| State: | 6.9% (13,837) |
Number of families with income $150k - 200k:| Braintree: | 8.9% (105) |
| State: | 7.3% (14,683) |
Number of families with income > $200k:| Braintree: | 7.6% (90) |
| Massachusetts: | 9.3% (18,741) |
Median non-family income in Braintree in 2022:| Braintree: | $28,461 |
| State: | $37,563 |
Change in median non-family income between 2000 and 2022:| Braintree, Massachusetts: | +32.8% |
| State: | +115.0% |
Median per capita income in Braintree in 2022:| Braintree: | $41,986 |
| State: | $28,993 |
Change in median per capita income between 2000 and 2022:| Braintree, Massachusetts: | +100.6% |
| Massachusetts: | +142.4% |
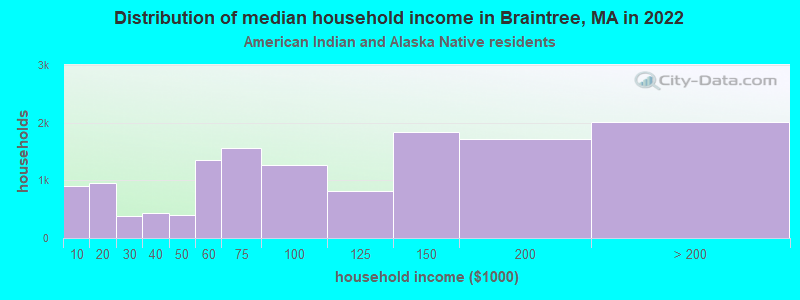
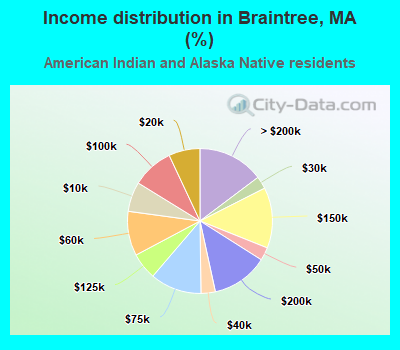
Income statistics for American Indian and Alaska Native residents
Median household income in Braintree, MA in 2022:| Braintree: | $173,044 |
| State: | $87,730 |
Change in median household income between 2000 and 2022:| Braintree, Massachusetts: | +134.6% |
| Massachusetts: | +138.3% |
Number of households with income < $10k:| Braintree: | 6.6% (904) |
| Massachusetts: | 6.6% (451) |
Number of households with income $10k - 20k:| Braintree: | 7.0% (953) |
| State: | 7.0% (476) |
Number of households with income $20k - 30k:| Braintree: | 2.8% (384) |
| Massachusetts: | 2.8% (192) |
Number of households with income $30k - 40k:| Braintree: | 3.2% (437) |
| State: | 3.2% (218) |
Number of households with income $40k - 50k:| Braintree: | 2.9% (399) |
| State: | 2.9% (199) |
Number of households with income $50k - 60k:| Braintree: | 9.9% (1,356) |
| State: | 9.9% (677) |
Number of households with income $60k - 75k:| Braintree: | 11.5% (1,565) |
| Massachusetts: | 11.5% (781) |
Number of households with income $75k - 100k:| Braintree: | 9.2% (1,260) |
| Massachusetts: | 9.2% (629) |
Number of households with income $100k - 125k:| Braintree: | 6.0% (813) |
| Massachusetts: | 6.0% (406) |
Number of households with income $125k - 150k:| Braintree: | 13.5% (1,845) |
| Massachusetts: | 13.5% (921) |
Number of households with income $150k - 200k:| Braintree: | 12.6% (1,721) |
| State: | 12.6% (859) |
Number of households with income > $200k:| Braintree: | 14.7% (2,010) |
| State: | 14.7% (1,003) |
Aggregate household income in Braintree in 2022: $2,758,714
Median per capita income in Braintree in 2022:| Braintree: | $45,734 |
| State: | $39,434 |
Change in median per capita income between 2000 and 2022:| Braintree, Massachusetts: | +140.2% |
| State: | +148.2% |
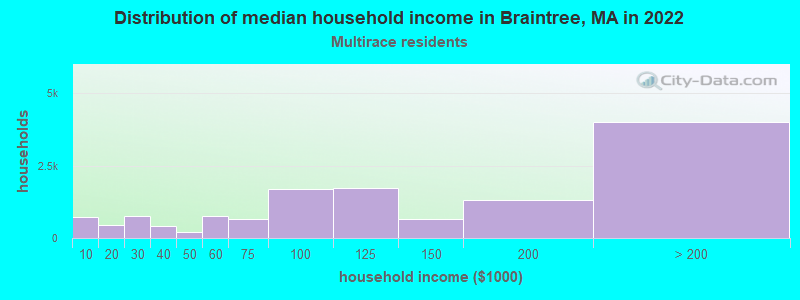
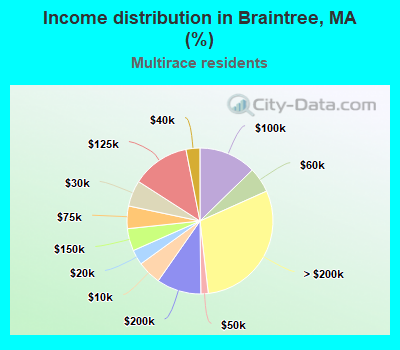
Income statistics for Multirace residents
Median household income in Braintree, MA in 2022:| Braintree: | $107,881 |
| State: | $71,552 |
Number of households with income < $10k:| Braintree: | 5.3% (712) |
| State: | 6.6% (15,127) |
Number of households with income $10k - 20k:| Braintree: | 3.3% (449) |
| State: | 9.2% (21,158) |
Number of households with income $20k - 30k:| Braintree: | 5.8% (775) |
| Massachusetts: | 7.8% (18,016) |
Number of households with income $30k - 40k:| Braintree: | 3.1% (412) |
| Massachusetts: | 7.9% (18,260) |
Number of households with income $40k - 50k:| Braintree: | 1.6% (219) |
| State: | 5.6% (13,027) |
Number of households with income $50k - 60k:| Braintree: | 5.6% (749) |
| State: | 5.6% (12,909) |
Number of households with income $60k - 75k:| Braintree: | 5.0% (669) |
| State: | 9.0% (20,800) |
Number of households with income $75k - 100k:| Braintree: | 12.7% (1,706) |
| State: | 12.1% (27,875) |
Number of households with income $100k - 125k:| Braintree: | 12.8% (1,722) |
| State: | 8.1% (18,754) |
Number of households with income $125k - 150k:| Braintree: | 5.0% (665) |
| State: | 6.8% (15,621) |
Number of households with income $150k - 200k:| Braintree: | 9.9% (1,327) |
| State: | 9.4% (21,618) |
Number of households with income > $200k:| Braintree: | 29.9% (4,009) |
| State: | 12.0% (27,592) |
Aggregate household income in Braintree in 2022: $94,145,804
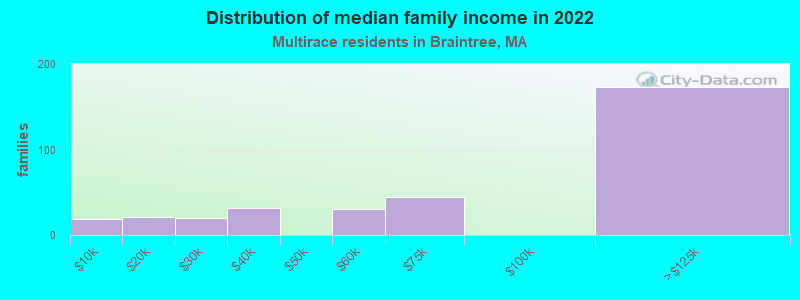
Median family income in Braintree in 2022:| Braintree: | $135,168 |
| Massachusetts: | $78,380 |
Number of families with income < $10k:| Braintree: | 5.7% (19) |
| State: | 4.5% (7,017) |
Number of families with income $10k - 20k:| Braintree: | 6.3% (21) |
| State: | 4.9% (7,678) |
Number of families with income $20k - 30k:| Braintree: | 6.0% (20) |
| Massachusetts: | 8.5% (13,245) |
Number of families with income $30k - 40k:| Braintree: | 9.4% (32) |
| State: | 8.2% (12,705) |
Number of families with income $50k - 60k:| Braintree: | 8.9% (30) |
| Massachusetts: | 6.7% (10,445) |
Number of families with income $60k - 75k:| Braintree: | 12.9% (44) |
| State: | 10.3% (16,064) |
Number of families with income $100k - 125k:| Braintree: | 50.9% (173) |
| Massachusetts: | 7.9% (12,321) |
Median non-family income in Braintree in 2022:| Braintree: | $22,350 |
| Massachusetts: | $42,253 |
Change in median non-family income between 2000 and 2022:| Braintree, Massachusetts: | +96.2% |
| State: | +93.7% |
Median per capita income in Braintree in 2022:| Braintree: | $62,045 |
| State: | $34,029 |
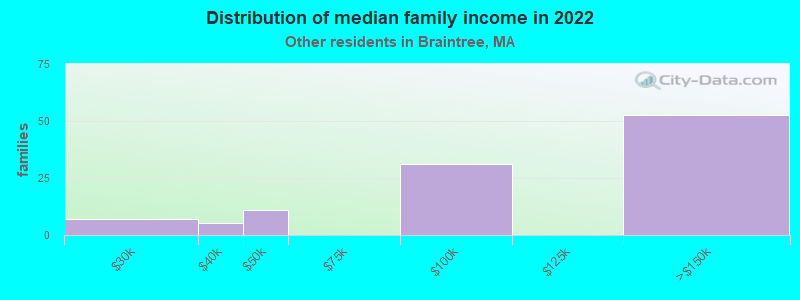
Income statistics for other residents
Number of households with income < $10k:| Braintree: | 8.2% (11) |
| State: | 8.4% (11,559) |
Number of households with income $10k - 20k:| Braintree: | 8.2% (11) |
| State: | 8.4% (11,499) |
Number of households with income $20k - 30k:| Braintree: | 9.0% (12) |
| State: | 9.5% (13,070) |
Number of households with income $30k - 40k:| Braintree: | 6.0% (8) |
| State: | 6.0% (8,291) |
Number of households with income $40k - 50k:| Braintree: | 9.0% (12) |
| Massachusetts: | 9.2% (12,611) |
Number of households with income $50k - 60k:| Braintree: | 8.2% (11) |
| Massachusetts: | 7.9% (10,879) |
Number of households with income $60k - 75k:| Braintree: | 7.5% (10) |
| Massachusetts: | 7.5% (10,239) |
Number of households with income $75k - 100k:| Braintree: | 13.4% (18) |
| State: | 13.1% (18,032) |
Number of households with income $100k - 125k:| Braintree: | 9.7% (13) |
| Massachusetts: | 9.6% (13,141) |
Number of households with income $125k - 150k:| Braintree: | 5.2% (7) |
| State: | 5.0% (6,808) |
Number of households with income $150k - 200k:| Braintree: | 6.7% (9) |
| Massachusetts: | 6.4% (8,843) |
Number of households with income > $200k:| Braintree: | 9.0% (12) |
| State: | 9.0% (12,396) |
Aggregate household income in Braintree in 2022: $27,421,197
Median family income in Braintree in 2022:| Braintree: | $104,673 |
| State: | $66,840 |
Number of families with income $20k - 30k:| Braintree: | 6.5% (7) |
| State: | 10.4% (10,595) |
Number of families with income $30k - 40k:| Braintree: | 4.9% (5) |
| Massachusetts: | 7.0% (7,154) |
Number of families with income $40k - 50k:| Braintree: | 10.1% (11) |
| State: | 8.9% (9,052) |
Number of families with income $75k - 100k:| Braintree: | 29.0% (31) |
| State: | 12.8% (12,997) |
Number of families with income $125k - 150k:| Braintree: | 49.5% (53) |
| State: | 5.3% (5,373) |
Median non-family income in Braintree in 2022:| Braintree: | $41,572 |
| State: | $36,127 |
Change in median non-family income between 2000 and 2022:| Braintree, Massachusetts: | +33.0% |
| State: | +123.4% |
Median per capita income in Braintree in 2022:| Braintree: | $43,642 |
| State: | $30,797 |