The median household income in Braintree Town, MA in 2022 was $115,942, which was 18.5% greater than the median annual income of $94,488 across the entire state of Massachusetts. Compared to the median income of $63,432 in 2000 this represents an increase of 45.3%. The per capita income in 2022 was $56,113, which means an increase of 42.1% compared to 2000 when it was $32,484.
Whole page based on the data from 2000 / 2022 when the population of Braintree Town, Massachusetts was 35,744 / 38,931
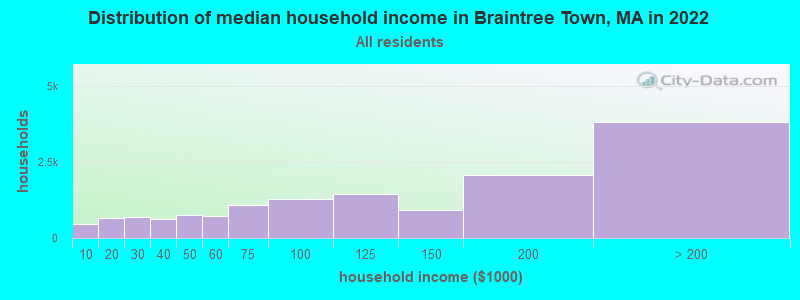
Income statistics for all residents
Median household income in Braintree Town, MA in 2022:
Braintree Town:
$115,942
State:
$94,488
Change in median household income between 2000 and 2022:
Braintree Town, Massachusetts:
+82.8%
Massachusetts:
+87.1%
Number of households with income < $10k:
Braintree Town:
3.1% (446)
Massachusetts:
5.2% (146,170)
Number of households with income $10k - 20k:
Braintree Town:
4.5% (657)
Massachusetts:
6.4% (180,001)
Number of households with income $20k - 30k:
Braintree Town:
4.7% (688)
Massachusetts:
5.6% (156,667)
Number of households with income $30k - 40k:
Braintree Town:
4.4% (642)
Massachusetts:
5.6% (157,168)
Number of households with income $40k - 50k:
Braintree Town:
5.2% (755)
State:
5.4% (151,455)
Number of households with income $50k - 60k:
Braintree Town:
5.0% (731)
State:
5.1% (142,726)
Number of households with income $60k - 75k:
Braintree Town:
7.4% (1,079)
Massachusetts:
7.6% (212,203)
Number of households with income $75k - 100k:
Braintree Town:
8.8% (1,286)
State:
11.3% (317,064)
Number of households with income $100k - 125k:
Braintree Town:
9.9% (1,440)
State:
9.7% (270,603)
Number of households with income $125k - 150k:
Braintree Town:
6.4% (926)
Massachusetts:
8.0% (223,140)
Number of households with income $150k - 200k:
Braintree Town:
14.2% (2,072)
State:
11.0% (308,695)
Number of households with income > $200k:
Braintree Town:
26.3% (3,821)
Massachusetts:
19.0% (531,884)
Aggregate household income in Braintree Town in 2022: $2,151,492,776
Median family income in Braintree Town in 2022:
Braintree Town:
$153,236
State:
$120,263
Number of families with income < $10k:
Braintree Town:
1.0% (97)
State:
2.9% (49,671)
Number of families with income $10k - 20k:
Braintree Town:
2.2% (210)
State:
2.9% (50,542)
Number of families with income $20k - 30k:
Braintree Town:
2.5% (245)
State:
3.9% (66,398)
Number of families with income $30k - 40k:
Braintree Town:
4.5% (435)
State:
4.5% (78,234)
Number of families with income $40k - 50k:
Braintree Town:
3.3% (324)
Massachusetts:
4.5% (77,656)
Number of families with income $50k - 60k:
Braintree Town:
3.8% (370)
State:
4.5% (77,928)
Number of families with income $60k - 75k:
Braintree Town:
7.0% (679)
State:
7.0% (120,295)
Number of families with income $75k - 100k:
Braintree Town:
7.0% (677)
Massachusetts:
11.1% (192,172)
Number of families with income $100k - 125k:
Braintree Town:
9.2% (889)
Massachusetts:
10.6% (182,105)
Number of families with income $125k - 150k:
Braintree Town:
8.3% (804)
State:
9.3% (159,566)
Number of families with income $150k - 200k:
Braintree Town:
16.4% (1,594)
State:
13.4% (231,410)
Number of families with income > $200k:
Braintree Town:
34.7% (3,367)
State:
25.4% (438,378)
Median non-family income in Braintree Town in 2022:
Braintree Town:
$62,154
State:
$55,979
Change in median non-family income between 2000 and 2022:
Braintree Town, Massachusetts:
+72.5%
State:
+88.0%
Median per capita income in Braintree Town in 2022:
Braintree Town:
$56,114
Massachusetts:
$54,025
Change in median per capita income between 2000 and 2022:
Braintree Town, Massachusetts:
+72.7%
State:
+108.2%
Income statistics for White residents
Median household income in Braintree Town, MA in 2022:
Braintree Town:
$105,505
State:
$101,391
Change in median household income between 2000 and 2022:
Braintree Town, Massachusetts:
+64.1%
State:
+93.3%
Number of households with income < $10k:
Braintree Town:
3.3% (354)
Massachusetts:
4.4% (91,120)
Number of households with income $10k - 20k:
Braintree Town:
4.7% (497)
State:
5.9% (122,055)
Number of households with income $20k - 30k:
Braintree Town:
5.5% (586)
Massachusetts:
5.1% (105,311)
Number of households with income $30k - 40k:
Braintree Town:
4.7% (506)
Massachusetts:
5.3% (110,239)
Number of households with income $40k - 50k:
Braintree Town:
5.4% (578)
State:
5.0% (104,636)
Number of households with income $50k - 60k:
Braintree Town:
4.7% (501)
Massachusetts:
4.8% (99,486)
Number of households with income $60k - 75k:
Braintree Town:
8.1% (869)
State:
7.5% (155,124)
Number of households with income $75k - 100k:
Braintree Town:
10.5% (1,120)
State:
11.4% (236,252)
Number of households with income $100k - 125k:
Braintree Town:
10.4% (1,110)
State:
9.9% (204,731)
Number of households with income $125k - 150k:
Braintree Town:
5.5% (586)
Massachusetts:
8.5% (175,324)
Number of households with income $150k - 200k:
Braintree Town:
11.6% (1,235)
Massachusetts:
11.7% (242,980)
Number of households with income > $200k:
Braintree Town:
25.6% (2,737)
Massachusetts:
20.5% (425,966)
Aggregate household income in Braintree Town in 2022: $1,504,972,871
Median family income in Braintree Town in 2022:
Braintree Town:
$154,059
Massachusetts:
$133,153
Number of families with income < $10k:
Braintree Town:
0.9% (59)
State:
2.0% (25,038)
Number of families with income $10k - 20k:
Braintree Town:
1.6% (111)
State:
2.1% (26,403)
Number of families with income $20k - 30k:
Braintree Town:
2.3% (154)
State:
2.6% (32,525)
Number of families with income $30k - 40k:
Braintree Town:
4.3% (287)
State:
3.9% (48,079)
Number of families with income $40k - 50k:
Braintree Town:
3.5% (236)
State:
3.8% (46,908)
Number of families with income $50k - 60k:
Braintree Town:
3.3% (221)
State:
3.8% (46,476)
Number of families with income $60k - 75k:
Braintree Town:
7.2% (482)
State:
6.4% (79,040)
Number of families with income $75k - 100k:
Braintree Town:
7.5% (506)
Massachusetts:
11.1% (137,395)
Number of families with income $100k - 125k:
Braintree Town:
9.7% (650)
Massachusetts:
11.1% (136,771)
Number of families with income $125k - 150k:
Braintree Town:
8.4% (565)
State:
10.0% (123,709)
Number of families with income $150k - 200k:
Braintree Town:
15.1% (1,014)
State:
14.7% (181,602)
Number of families with income > $200k:
Braintree Town:
36.1% (2,425)
State:
28.5% (351,887)
Median non-family income in Braintree Town in 2022:
Braintree Town:
$57,896
State:
$59,323
Change in median non-family income between 2000 and 2022:
Braintree Town, Massachusetts:
+61.4%
State:
+94.3%
Median per capita income in Braintree Town in 2022:
Braintree Town:
$57,814
State:
$60,804
Change in median per capita income between 2000 and 2022:
Braintree Town, Massachusetts:
+71.4%
State:
+118.7%
Income statistics for Black or African American residents
Median household income in Braintree Town, MA in 2022:
Braintree Town:
$108,992
State:
$63,189
Change in median household income between 2000 and 2022:
Braintree Town, Massachusetts:
+81.8%
Massachusetts:
+87.4%
Number of households with income < $10k:
Braintree Town:
0.0% (0)
State:
9.1% (15,797)
Number of households with income $10k - 20k:
Braintree Town:
12.0% (61)
State:
9.4% (16,267)
Number of households with income $20k - 30k:
Braintree Town:
5.9% (30)
Massachusetts:
7.8% (13,520)
Number of households with income $30k - 40k:
Braintree Town:
3.1% (16)
State:
8.3% (14,412)
Number of households with income $40k - 50k:
Braintree Town:
11.0% (56)
Massachusetts:
7.9% (13,790)
Number of households with income $50k - 60k:
Braintree Town:
2.2% (11)
State:
5.8% (10,041)
Number of households with income $60k - 75k:
Braintree Town:
10.0% (51)
Massachusetts:
8.5% (14,822)
Number of households with income $75k - 100k:
Braintree Town:
8.3% (42)
Massachusetts:
11.0% (19,122)
Number of households with income $100k - 125k:
Braintree Town:
3.3% (17)
State:
8.4% (14,575)
Number of households with income $125k - 150k:
Braintree Town:
0.0% (0)
State:
6.0% (10,429)
Number of households with income $150k - 200k:
Braintree Town:
24.0% (122)
State:
7.2% (12,539)
Number of households with income > $200k:
Braintree Town:
20.2% (103)
State:
10.5% (18,185)
Aggregate household income in Braintree Town in 2022: $68,311,893
Median family income in Braintree Town in 2022:
Braintree Town:
$147,314
State:
$79,815
Number of families with income $20k - 30k:
Braintree Town:
9.5% (32)
State:
6.6% (7,274)
Number of families with income $30k - 40k:
Braintree Town:
8.2% (28)
Massachusetts:
6.4% (7,002)
Number of families with income $50k - 60k:
Braintree Town:
2.8% (9)
Massachusetts:
6.4% (6,986)
Number of families with income $60k - 75k:
Braintree Town:
12.1% (41)
Massachusetts:
7.9% (8,699)
Number of families with income $75k - 100k:
Braintree Town:
17.5% (59)
State:
11.5% (12,654)
Number of families with income $100k - 125k:
Braintree Town:
2.7% (9)
Massachusetts:
10.4% (11,452)
Number of families with income $150k - 200k:
Braintree Town:
28.1% (95)
State:
9.3% (10,230)
Number of families with income > $200k:
Braintree Town:
19.2% (65)
Massachusetts:
12.9% (14,108)
Median per capita income in Braintree Town in 2022:
Braintree Town:
$41,789
State:
$33,524
Change in median per capita income between 2000 and 2022:
Braintree Town, Massachusetts:
+77.1%
State:
+109.4%
Income statistics for Asian residents
Median household income in Braintree Town, MA in 2022:
Braintree Town:
$176,414
State:
$117,855
Number of households with income < $10k:
Braintree Town:
1.8% (47)
Massachusetts:
6.8% (11,982)
Number of households with income $10k - 20k:
Braintree Town:
1.9% (51)
State:
4.8% (8,376)
Number of households with income $20k - 30k:
Braintree Town:
0.8% (21)
State:
3.7% (6,558)
Number of households with income $30k - 40k:
Braintree Town:
1.6% (42)
State:
3.3% (5,748)
Number of households with income $40k - 50k:
Braintree Town:
5.6% (149)
State:
4.1% (7,192)
Number of households with income $50k - 60k:
Braintree Town:
7.4% (197)
State:
5.0% (8,734)
Number of households with income $60k - 75k:
Braintree Town:
5.4% (143)
State:
5.8% (10,203)
Number of households with income $75k - 100k:
Braintree Town:
2.8% (75)
Massachusetts:
8.6% (15,154)
Number of households with income $100k - 125k:
Braintree Town:
5.4% (142)
State:
10.8% (18,942)
Number of households with income $125k - 150k:
Braintree Town:
10.7% (283)
State:
8.0% (14,037)
Number of households with income $150k - 200k:
Braintree Town:
24.4% (646)
Massachusetts:
12.5% (21,856)
Number of households with income > $200k:
Braintree Town:
32.3% (856)
Massachusetts:
26.6% (46,694)
Aggregate household income in Braintree Town in 2022: $460,895,034
Median family income in Braintree Town in 2022:
Braintree Town:
$177,600
Massachusetts:
$140,113
Number of families with income < $10k:
Braintree Town:
0.9% (17)
Massachusetts:
3.2% (3,752)
Number of families with income $10k - 20k:
Braintree Town:
2.4% (47)
State:
3.5% (4,118)
Number of families with income $20k - 30k:
Braintree Town:
0.8% (15)
State:
2.3% (2,708)
Number of families with income $30k - 40k:
Braintree Town:
2.3% (45)
State:
2.8% (3,234)
Number of families with income $40k - 50k:
Braintree Town:
6.0% (118)
State:
3.9% (4,621)
Number of families with income $50k - 60k:
Braintree Town:
6.5% (129)
State:
3.9% (4,606)
Number of families with income $60k - 75k:
Braintree Town:
6.6% (130)
State:
6.1% (7,105)
Number of families with income $75k - 100k:
Braintree Town:
3.4% (67)
State:
8.5% (10,022)
Number of families with income $100k - 125k:
Braintree Town:
4.9% (96)
Massachusetts:
10.0% (11,697)
Number of families with income $125k - 150k:
Braintree Town:
9.8% (194)
Massachusetts:
8.6% (10,071)
Number of families with income $150k - 200k:
Braintree Town:
16.9% (334)
State:
13.2% (15,478)
Number of families with income > $200k:
Braintree Town:
39.5% (779)
State:
34.0% (39,856)
Median non-family income in Braintree Town in 2022:
Braintree Town:
$135,914
State:
$71,440
Median per capita income in Braintree Town in 2022:
Braintree Town:
$57,198
Massachusetts:
$58,900
Change in median per capita income between 2000 and 2022:
Braintree Town, Massachusetts:
+132.7%
State:
+174.6%
Income statistics for Hispanic or Latino residents
Median household income in Braintree Town, MA in 2022:
Braintree Town:
$92,503
State:
$61,523
Change in median household income between 2000 and 2022:
Braintree Town, Massachusetts:
+71.6%
State:
+125.4%
Number of households with income < $10k:
Braintree Town:
2.8% (11)
Massachusetts:
8.8% (25,307)
Number of households with income $10k - 20k:
Braintree Town:
13.5% (54)
State:
10.0% (28,653)
Number of households with income $20k - 30k:
Braintree Town:
11.8% (47)
Massachusetts:
8.8% (25,189)
Number of households with income $30k - 40k:
Braintree Town:
8.8% (35)
State:
7.2% (20,822)
Number of households with income $40k - 50k:
Braintree Town:
0.0% (0)
State:
7.2% (20,817)
Number of households with income $50k - 60k:
Braintree Town:
0.0% (0)
State:
6.5% (18,748)
Number of households with income $60k - 75k:
Braintree Town:
15.0% (60)
State:
8.8% (25,390)
Number of households with income $75k - 100k:
Braintree Town:
5.2% (21)
State:
12.0% (34,488)
Number of households with income $100k - 125k:
Braintree Town:
13.8% (55)
State:
8.6% (24,599)
Number of households with income $125k - 150k:
Braintree Town:
5.5% (22)
State:
6.2% (17,743)
Number of households with income $150k - 200k:
Braintree Town:
12.8% (51)
Massachusetts:
7.3% (21,017)
Number of households with income > $200k:
Braintree Town:
11.0% (44)
State:
8.6% (24,606)
Aggregate household income in Braintree Town in 2022: $38,894,195
Median family income in Braintree Town in 2022:
Braintree Town:
$117,208
Massachusetts:
$66,072
Number of families with income < $10k:
Braintree Town:
3.4% (10)
State:
6.2% (12,456)
Number of families with income $20k - 30k:
Braintree Town:
16.3% (48)
Massachusetts:
10.1% (20,376)
Number of families with income $30k - 40k:
Braintree Town:
11.2% (33)
State:
8.2% (16,470)
Number of families with income $60k - 75k:
Braintree Town:
4.4% (13)
State:
10.6% (21,252)
Number of families with income $75k - 100k:
Braintree Town:
7.2% (21)
State:
12.0% (24,088)
Number of families with income $100k - 125k:
Braintree Town:
16.6% (49)
State:
8.9% (17,954)
Number of families with income $125k - 150k:
Braintree Town:
14.2% (42)
State:
6.9% (13,837)
Number of families with income $150k - 200k:
Braintree Town:
17.8% (53)
State:
7.3% (14,683)
Number of families with income > $200k:
Braintree Town:
8.8% (26)
Massachusetts:
9.3% (18,741)
Median per capita income in Braintree Town in 2022:
Braintree Town:
$34,720
State:
$28,993
Change in median per capita income between 2000 and 2022:
Braintree Town, Massachusetts:
+64.9%
State:
+142.4%
Income statistics for American Indian and Alaska Native residents
Median per capita income in Braintree Town in 2022:
Braintree Town:
$45,229
State:
$39,434
Change in median per capita income between 2000 and 2022:
Braintree Town, Massachusetts:
+140.2%
Massachusetts:
+148.2%
Income statistics for Multirace residents
Median household income in Braintree Town, MA in 2022:
Braintree Town:
$139,056
State:
$71,552
Number of households with income < $10k:
Braintree Town:
4.6% (21)
State:
6.6% (15,127)
Number of households with income $10k - 20k:
Braintree Town:
2.6% (12)
State:
9.2% (21,158)
Number of households with income $20k - 30k:
Braintree Town:
12.0% (55)
State:
7.8% (18,016)
Number of households with income $30k - 40k:
Braintree Town:
1.3% (6)
State:
7.9% (18,260)
Number of households with income $40k - 50k:
Braintree Town:
0.0% (0)
State:
5.6% (13,027)
Number of households with income $50k - 60k:
Braintree Town:
7.8% (36)
Massachusetts:
5.6% (12,909)
Number of households with income $60k - 75k:
Braintree Town:
0.0% (0)
Massachusetts:
9.0% (20,800)
Number of households with income $75k - 100k:
Braintree Town:
5.4% (25)
State:
12.1% (27,875)
Number of households with income $100k - 125k:
Braintree Town:
25.9% (119)
State:
8.1% (18,754)
Number of households with income $125k - 150k:
Braintree Town:
8.5% (39)
State:
6.8% (15,621)
Number of households with income $150k - 200k:
Braintree Town:
19.2% (88)
State:
9.4% (21,618)
Number of households with income > $200k:
Braintree Town:
12.6% (58)
State:
12.0% (27,592)
Aggregate household income in Braintree Town in 2022: $59,975,647
Median family income in Braintree Town in 2022:
Braintree Town:
$133,595
State:
$78,380
Number of families with income < $10k:
Braintree Town:
3.5% (13)
State:
4.5% (7,017)
Number of families with income $10k - 20k:
Braintree Town:
5.0% (19)
Massachusetts:
4.9% (7,678)
Number of families with income $20k - 30k:
Braintree Town:
17.1% (64)
State:
8.5% (13,245)
Number of families with income $75k - 100k:
Braintree Town:
8.0% (30)
Massachusetts:
12.1% (18,758)
Number of families with income $100k - 125k:
Braintree Town:
17.7% (66)
State:
7.9% (12,321)
Number of families with income $125k - 150k:
Braintree Town:
15.4% (57)
State:
7.2% (11,128)
Number of families with income $150k - 200k:
Braintree Town:
29.4% (110)
State:
10.3% (15,978)
Number of families with income > $200k:
Braintree Town:
3.9% (14)
State:
14.0% (21,838)
Median per capita income in Braintree Town in 2022:
Braintree Town:
$41,574
Massachusetts:
$34,029
Income statistics for other residents
Number of households with income < $10k:
Braintree Town:
0.0% (0)
State:
8.4% (11,559)
Number of households with income $10k - 20k:
Braintree Town:
9.2% (13)
State:
8.4% (11,499)
Number of households with income $20k - 30k:
Braintree Town:
0.0% (0)
Massachusetts:
9.5% (13,070)
Number of households with income $30k - 40k:
Braintree Town:
24.8% (35)
State:
6.0% (8,291)
Number of households with income $40k - 50k:
Braintree Town:
0.0% (0)
State:
9.2% (12,611)
Number of households with income $50k - 60k:
Braintree Town:
0.0% (0)
State:
7.9% (10,879)
Number of households with income $60k - 75k:
Braintree Town:
0.0% (0)
Massachusetts:
7.5% (10,239)
Number of households with income $75k - 100k:
Braintree Town:
0.0% (0)
State:
13.1% (18,032)
Number of households with income $100k - 125k:
Braintree Town:
9.9% (14)
State:
9.6% (13,141)
Number of households with income $125k - 150k:
Braintree Town:
0.0% (0)
State:
5.0% (6,808)
Number of households with income $150k - 200k:
Braintree Town:
30.5% (43)
Massachusetts:
6.4% (8,843)
Number of households with income > $200k:
Braintree Town:
25.5% (36)
State:
9.0% (12,396)
Aggregate household income in Braintree Town in 2022: $30,015,245
Median family income in Braintree Town in 2022:
Braintree Town:
$162,552
State:
$66,840
Number of families with income $30k - 40k:
Braintree Town:
29.9% (41)
State:
7.0% (7,154)
Number of families with income $100k - 125k:
Braintree Town:
10.0% (14)
State:
9.3% (9,480)
Number of families with income $150k - 200k:
Braintree Town:
31.6% (44)
State:
7.5% (7,659)
Number of families with income > $200k:
Braintree Town:
28.5% (39)
Massachusetts:
10.0% (10,188)
Median per capita income in Braintree Town in 2022:
Braintree Town:
$46,135
Massachusetts:
$30,797
Discuss Braintree Town, Massachusetts (MA) on our hugely popular Massachusetts forum.