Browning, Wisconsin (WI) income map, earnings map, and wages data
The median household income in Browning, WI in 2022 was $75,183, which was 5.6% greater than the median annual income of $70,996 across the entire state of Wisconsin. Compared to the median income of $45,917 in 2000 this represents an increase of 38.9%. The per capita income in 2022 was $35,831, which means an increase of 47.8% compared to 2000 when it was $18,687.
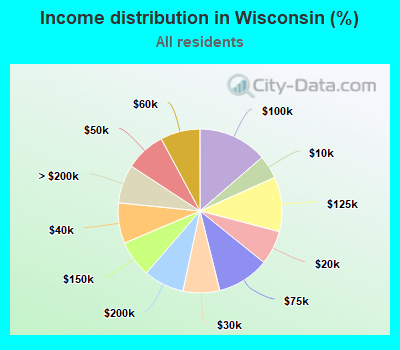
Income statistics for all residents
Median household income in Browning, WI in 2022:| Browning: | $75,184 |
| State: | $70,996 |
Change in median household income between 2000 and 2022:| Browning, Wisconsin: | +63.7% |
| Wisconsin: | +62.1% |
Number of households with income < $10k:| Browning: | 4.6% (60,619) |
| State: | 4.6% (115,058) |
Number of households with income $10k - 20k:| Browning: | 6.8% (88,354) |
| State: | 6.7% (167,685) |
Number of households with income $20k - 30k:| Browning: | 7.3% (94,948) |
| State: | 7.2% (180,435) |
Number of households with income $30k - 40k:| Browning: | 8.0% (104,854) |
| State: | 8.0% (199,167) |
Number of households with income $40k - 50k:| Browning: | 7.9% (103,882) |
| State: | 7.9% (197,648) |
Number of households with income $50k - 60k:| Browning: | 7.8% (102,588) |
| State: | 7.8% (195,297) |
Number of households with income $60k - 75k:| Browning: | 10.3% (134,797) |
| State: | 10.3% (256,633) |
Number of households with income $75k - 100k:| Browning: | 13.7% (178,584) |
| Wisconsin: | 13.7% (340,492) |
Number of households with income $100k - 125k:| Browning: | 10.8% (140,739) |
| State: | 10.8% (268,847) |
Number of households with income $125k - 150k:| Browning: | 7.2% (94,737) |
| State: | 7.3% (180,911) |
Number of households with income $150k - 200k:| Browning: | 8.0% (104,412) |
| State: | 8.0% (199,297) |
Number of households with income > $200k:| Browning: | 7.6% (99,548) |
| State: | 7.6% (189,651) |
Aggregate household income in Browning in 2022: $862,389,404
Median family income in Browning in 2022:| Browning: | $81,684 |
| State: | $91,700 |
Median non-family income in Browning in 2022:| Browning: | $57,850 |
| State: | $42,812 |
Change in median non-family income between 2000 and 2022:| Browning, Wisconsin: | +68.3% |
| Wisconsin: | +65.7% |
Median per capita income in Browning in 2022:| Browning: | $35,831 |
| State: | $40,188 |
Change in median per capita income between 2000 and 2022:| Browning, Wisconsin: | +91.7% |
| State: | +88.9% |
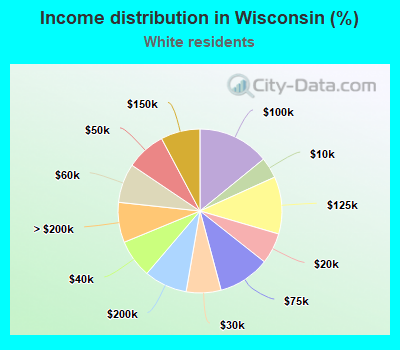
Income statistics for White residents
Median household income in Browning, WI in 2022:| Browning: | $76,873 |
| State: | $74,405 |
Change in median household income between 2000 and 2022:| Browning, Wisconsin: | +65.9% |
| State: | +64.5% |
Number of households with income < $10k:| Browning: | 4.1% (44,800) |
| State: | 4.1% (87,410) |
Number of households with income $10k - 20k:| Browning: | 6.1% (66,394) |
| Wisconsin: | 6.1% (129,511) |
Number of households with income $20k - 30k:| Browning: | 6.9% (74,428) |
| State: | 6.9% (145,235) |
Number of households with income $30k - 40k:| Browning: | 7.6% (82,120) |
| Wisconsin: | 7.6% (160,205) |
Number of households with income $40k - 50k:| Browning: | 7.8% (84,873) |
| Wisconsin: | 7.8% (165,627) |
Number of households with income $50k - 60k:| Browning: | 7.7% (83,754) |
| State: | 7.7% (163,506) |
Number of households with income $60k - 75k:| Browning: | 10.2% (110,909) |
| Wisconsin: | 10.2% (216,479) |
Number of households with income $75k - 100k:| Browning: | 14.1% (153,109) |
| State: | 14.1% (298,984) |
Number of households with income $100k - 125k:| Browning: | 11.3% (122,617) |
| State: | 11.3% (239,588) |
Number of households with income $125k - 150k:| Browning: | 7.8% (84,212) |
| State: | 7.8% (164,502) |
Number of households with income $150k - 200k:| Browning: | 8.5% (92,186) |
| State: | 8.5% (180,048) |
Number of households with income > $200k:| Browning: | 7.9% (86,072) |
| State: | 7.9% (167,999) |
Aggregate household income in Browning in 2022: $748,769,777
Median family income in Browning in 2022:| Browning: | $83,738 |
| State: | $96,327 |
Number of families with income < $10k:| Browning: | 2.7% (6) |
| State: | 2.0% (25,684) |
Number of families with income $10k - 20k:| Browning: | 2.3% (5) |
| State: | 2.4% (30,426) |
Number of families with income $20k - 30k:| Browning: | 4.2% (10) |
| State: | 3.5% (45,298) |
Number of families with income $30k - 40k:| Browning: | 7.0% (16) |
| Wisconsin: | 4.9% (62,935) |
Number of families with income $40k - 50k:| Browning: | 9.4% (21) |
| State: | 6.0% (76,575) |
Number of families with income $50k - 60k:| Browning: | 9.2% (21) |
| State: | 6.9% (88,079) |
Number of families with income $60k - 75k:| Browning: | 5.6% (13) |
| State: | 10.6% (136,022) |
Number of families with income $75k - 100k:| Browning: | 11.3% (25) |
| State: | 16.0% (204,807) |
Number of families with income $100k - 125k:| Browning: | 17.8% (40) |
| State: | 14.3% (183,287) |
Number of families with income $125k - 150k:| Browning: | 7.8% (18) |
| State: | 10.2% (131,464) |
Number of families with income $150k - 200k:| Browning: | 17.5% (40) |
| State: | 12.1% (155,060) |
Number of families with income > $200k:| Browning: | 5.2% (12) |
| State: | 11.2% (143,836) |
Median non-family income in Browning in 2022:| Browning: | $58,448 |
| State: | $44,213 |
Change in median non-family income between 2000 and 2022:| Browning, Wisconsin: | +70.0% |
| State: | +68.5% |
Median per capita income in Browning in 2022:| Browning: | $37,306 |
| State: | $43,415 |
Change in median per capita income between 2000 and 2022:| Browning, Wisconsin: | +96.6% |
| State: | +94.0% |
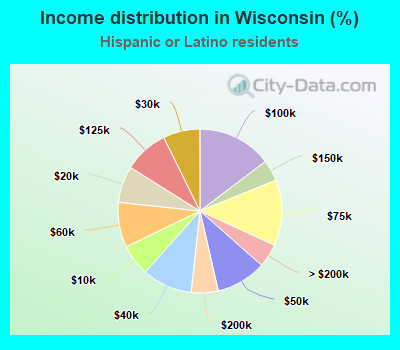
Income statistics for Hispanic or Latino residents
Median household income in Browning, WI in 2022:| Browning: | $68,294 |
| State: | $60,422 |
Change in median household income between 2000 and 2022:| Browning, Wisconsin: | +69.0% |
| State: | +72.7% |
Number of households with income < $10k:| Browning: | 6.2% (4,530) |
| Wisconsin: | 6.2% (7,841) |
Number of households with income $10k - 20k:| Browning: | 7.2% (5,227) |
| State: | 7.2% (9,100) |
Number of households with income $20k - 30k:| Browning: | 7.3% (5,295) |
| State: | 7.3% (9,213) |
Number of households with income $30k - 40k:| Browning: | 10.0% (7,213) |
| State: | 9.9% (12,505) |
Number of households with income $40k - 50k:| Browning: | 9.9% (7,161) |
| State: | 9.9% (12,552) |
Number of households with income $50k - 60k:| Browning: | 8.9% (6,473) |
| State: | 8.9% (11,263) |
Number of households with income $60k - 75k:| Browning: | 13.0% (9,400) |
| State: | 13.0% (16,458) |
Number of households with income $75k - 100k:| Browning: | 14.7% (10,671) |
| State: | 14.7% (18,587) |
Number of households with income $100k - 125k:| Browning: | 8.8% (6,375) |
| State: | 8.8% (11,136) |
Number of households with income $125k - 150k:| Browning: | 4.1% (3,004) |
| State: | 4.2% (5,292) |
Number of households with income $150k - 200k:| Browning: | 5.3% (3,829) |
| Wisconsin: | 5.3% (6,737) |
Number of households with income > $200k:| Browning: | 4.6% (3,307) |
| State: | 4.6% (5,851) |
Aggregate household income in Browning in 2022: $1,131,650
Median family income in Browning in 2022:| Browning: | $35,529 |
| State: | $62,574 |
Number of families with income < $10k:| Browning: | 9.5% (1) |
| State: | 7.4% (6,511) |
Number of families with income $10k - 20k:| Browning: | 5.5% (1) |
| Wisconsin: | 5.3% (4,663) |
Number of families with income $20k - 30k:| Browning: | 7.6% (1) |
| State: | 6.5% (5,706) |
Number of families with income $30k - 40k:| Browning: | 14.6% (2) |
| State: | 10.7% (9,335) |
Number of families with income $40k - 50k:| Browning: | 14.4% (2) |
| State: | 9.6% (8,400) |
Number of families with income $50k - 60k:| Browning: | 9.1% (1) |
| Wisconsin: | 7.1% (6,250) |
Number of families with income $60k - 75k:| Browning: | 6.0% (1) |
| State: | 12.1% (10,577) |
Number of families with income $75k - 100k:| Browning: | 9.2% (1) |
| Wisconsin: | 15.1% (13,191) |
Number of families with income $100k - 125k:| Browning: | 11.0% (2) |
| State: | 10.4% (9,073) |
Number of families with income $125k - 150k:| Browning: | 3.5% (0) |
| State: | 5.1% (4,509) |
Number of families with income $150k - 200k:| Browning: | 7.4% (1) |
| State: | 5.7% (5,013) |
Number of families with income > $200k:| Browning: | 2.2% (0) |
| State: | 5.0% (4,360) |
Median per capita income in Browning in 2022:| Browning: | $13,121 |
| Wisconsin: | $23,991 |
Change in median per capita income between 2000 and 2022:| Browning, Wisconsin: | +101.2% |
| State: | +108.6% |
Income statistics for other residents
Number of households with income < $10k:| Browning: | 7.7% (1) |
| State: | 7.2% (2,622) |
Number of households with income $10k - 20k:| Browning: | 0.0% (0) |
| Wisconsin: | 5.9% (2,142) |
Number of households with income $20k - 30k:| Browning: | 7.7% (1) |
| Wisconsin: | 7.5% (2,715) |
Number of households with income $30k - 40k:| Browning: | 15.4% (2) |
| Wisconsin: | 11.7% (4,249) |
Number of households with income $40k - 50k:| Browning: | 15.4% (2) |
| State: | 11.4% (4,111) |
Number of households with income $50k - 60k:| Browning: | 7.7% (1) |
| State: | 5.9% (2,134) |
Number of households with income $60k - 75k:| Browning: | 15.4% (2) |
| Wisconsin: | 16.5% (5,962) |
Number of households with income $75k - 100k:| Browning: | 7.7% (1) |
| State: | 12.5% (4,527) |
Number of households with income $100k - 125k:| Browning: | 7.7% (1) |
| Wisconsin: | 7.0% (2,551) |
Number of households with income $125k - 150k:| Browning: | 7.7% (1) |
| State: | 4.2% (1,517) |
Number of households with income $150k - 200k:| Browning: | 7.7% (1) |
| Wisconsin: | 6.4% (2,318) |
Number of households with income > $200k:| Browning: | 0.0% (0) |
| State: | 3.7% (1,344) |
Aggregate household income in Browning in 2022: $1,054,521
Median family income in Browning in 2022:| Browning: | $37,663 |
| State: | $61,543 |
Median per capita income in Browning in 2022:| Browning: | $18,153 |
| State: | $27,766 |