The median household income in Bryant, WA in 2022 was $111,882, which was 18.4% greater than the median annual income of $91,306 across the entire state of Washington. Compared to the median income of $53,060 in 2000 this represents an increase of 52.6%. The per capita income in 2022 was $47,506, which means an increase of 50.7% compared to 2000 when it was $23,417.
Whole page based on the data from 2000 / 2022 when the population of Bryant, Washington was 1,870 / 2,521
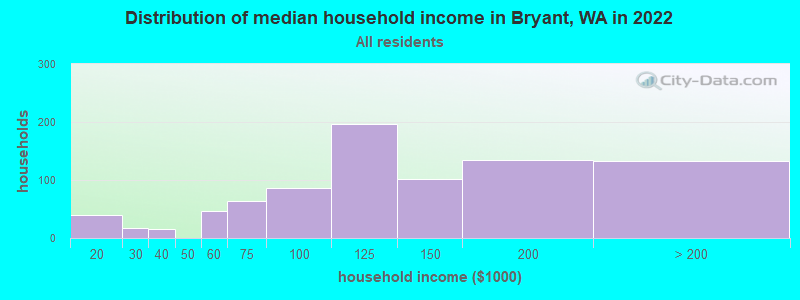
Income statistics for all residents
Median household income in Bryant, WA in 2022:
Bryant:
$111,883
State:
$91,306
Change in median household income between 2000 and 2022:
Bryant, Washington:
+110.9%
State:
+99.5%
Number of households with income < $10k:
Bryant:
0.0% (0)
Washington:
4.5% (139,331)
Number of households with income $10k - 20k:
Bryant:
4.7% (39)
Washington:
5.0% (154,508)
Number of households with income $20k - 30k:
Bryant:
2.2% (18)
Washington:
5.4% (166,555)
Number of households with income $30k - 40k:
Bryant:
1.9% (16)
State:
5.5% (170,324)
Number of households with income $40k - 50k:
Bryant:
0.0% (0)
Washington:
6.0% (183,941)
Number of households with income $50k - 60k:
Bryant:
5.6% (47)
State:
6.1% (187,395)
Number of households with income $60k - 75k:
Bryant:
7.5% (63)
Washington:
8.7% (266,771)
Number of households with income $75k - 100k:
Bryant:
10.4% (87)
State:
13.1% (404,672)
Number of households with income $100k - 125k:
Bryant:
23.5% (196)
State:
11.0% (337,911)
Number of households with income $125k - 150k:
Bryant:
12.2% (102)
State:
8.0% (244,934)
Number of households with income $150k - 200k:
Bryant:
16.2% (135)
Washington:
10.5% (323,812)
Number of households with income > $200k:
Bryant:
15.8% (132)
State:
16.2% (499,799)
Aggregate household income in Bryant in 2022: $117,379,593
Median family income in Bryant in 2022:
Bryant:
$115,533
State:
$109,192
Number of families with income $10k - 20k:
Bryant:
5.1% (37)
State:
2.6% (50,138)
Number of families with income $50k - 60k:
Bryant:
5.5% (40)
State:
5.3% (101,674)
Number of families with income $60k - 75k:
Bryant:
8.6% (61)
State:
8.2% (158,348)
Number of families with income $75k - 100k:
Bryant:
9.8% (70)
State:
13.8% (267,812)
Number of families with income $100k - 125k:
Bryant:
31.7% (227)
Washington:
12.4% (240,213)
Number of families with income $125k - 150k:
Bryant:
13.5% (96)
State:
9.3% (180,011)
Number of families with income $150k - 200k:
Bryant:
9.2% (66)
State:
13.0% (250,874)
Number of families with income > $200k:
Bryant:
16.6% (118)
Washington:
20.4% (393,898)
Median per capita income in Bryant in 2022:
Bryant:
$47,507
State:
$50,764
Change in median per capita income between 2000 and 2022:
Bryant, Washington:
+102.9%
State:
+121.0%
Income statistics for White residents
Median household income in Bryant, WA in 2022:
Bryant:
$131,736
State:
$91,916
Change in median household income between 2000 and 2022:
Bryant, Washington:
+145.4%
Washington:
+95.4%
Number of households with income < $10k:
Bryant:
0.0% (0)
Washington:
4.3% (95,850)
Number of households with income $10k - 20k:
Bryant:
6.9% (39)
State:
4.8% (106,421)
Number of households with income $20k - 30k:
Bryant:
0.0% (0)
State:
5.5% (122,860)
Number of households with income $30k - 40k:
Bryant:
2.6% (15)
State:
5.4% (119,627)
Number of households with income $40k - 50k:
Bryant:
0.0% (0)
Washington:
5.9% (132,276)
Number of households with income $50k - 60k:
Bryant:
8.6% (49)
State:
6.1% (136,212)
Number of households with income $60k - 75k:
Bryant:
4.4% (25)
State:
8.8% (196,086)
Number of households with income $75k - 100k:
Bryant:
12.0% (68)
State:
13.4% (299,192)
Number of households with income $100k - 125k:
Bryant:
10.2% (58)
Washington:
11.3% (252,209)
Number of households with income $125k - 150k:
Bryant:
10.2% (58)
State:
7.9% (175,962)
Number of households with income $150k - 200k:
Bryant:
23.0% (131)
Washington:
10.7% (239,156)
Number of households with income > $200k:
Bryant:
22.1% (126)
State:
16.1% (359,917)
Aggregate household income in Bryant in 2022: $85,225,451
Median family income in Bryant in 2022:
Bryant:
$124,012
State:
$112,511
Number of families with income $10k - 20k:
Bryant:
7.8% (37)
State:
2.0% (28,228)
Number of families with income $50k - 60k:
Bryant:
7.6% (35)
State:
5.0% (69,270)
Number of families with income $60k - 75k:
Bryant:
4.7% (22)
State:
8.2% (112,369)
Number of families with income $75k - 100k:
Bryant:
10.3% (48)
State:
14.1% (194,214)
Number of families with income $100k - 125k:
Bryant:
19.9% (93)
State:
13.2% (182,184)
Number of families with income $125k - 150k:
Bryant:
11.4% (53)
Washington:
9.5% (130,928)
Number of families with income $150k - 200k:
Bryant:
13.7% (64)
State:
13.7% (188,621)
Number of families with income > $200k:
Bryant:
24.5% (115)
Washington:
20.8% (285,982)
Median non-family income in Bryant in 2022:
Bryant:
$174,441
State:
$56,103
Median per capita income in Bryant in 2022:
Bryant:
$55,674
Washington:
$55,212
Change in median per capita income between 2000 and 2022:
Bryant, Washington:
+127.1%
State:
+123.8%
Income statistics for Asian residents
Median per capita income in Bryant in 2022:
Bryant:
$57,520
State:
$67,666
Income statistics for Hispanic or Latino residents
Median household income in Bryant, WA in 2022:
Bryant:
$119,548
State:
$74,770
Number of households with income < $10k:
Bryant:
0.0% (0)
State:
4.9% (14,456)
Number of households with income $10k - 20k:
Bryant:
0.0% (0)
State:
5.3% (15,449)
Number of households with income $20k - 30k:
Bryant:
0.0% (0)
State:
6.8% (20,016)
Number of households with income $30k - 40k:
Bryant:
0.0% (0)
Washington:
7.7% (22,548)
Number of households with income $40k - 50k:
Bryant:
0.0% (0)
State:
7.3% (21,450)
Number of households with income $50k - 60k:
Bryant:
0.0% (0)
State:
7.7% (22,744)
Number of households with income $60k - 75k:
Bryant:
0.0% (0)
State:
10.5% (30,737)
Number of households with income $75k - 100k:
Bryant:
27.9% (19)
Washington:
14.9% (43,843)
Number of households with income $100k - 125k:
Bryant:
10.3% (7)
State:
11.1% (32,554)
Number of households with income $125k - 150k:
Bryant:
61.8% (42)
State:
7.4% (21,624)
Number of households with income $150k - 200k:
Bryant:
0.0% (0)
State:
7.3% (21,360)
Number of households with income > $200k:
Bryant:
0.0% (0)
State:
9.2% (27,055)
Aggregate household income in Bryant in 2022: $6,813,207
Median family income in Bryant in 2022:
Bryant:
$113,972
State:
$76,866
Number of families with income $75k - 100k:
Bryant:
30.5% (18)
State:
14.4% (30,698)
Number of families with income $100k - 125k:
Bryant:
12.1% (7)
Washington:
11.4% (24,331)
Number of families with income $125k - 150k:
Bryant:
57.4% (34)
Washington:
7.5% (16,099)
Median per capita income in Bryant in 2022:
Bryant:
$81,413
State:
$28,252
Income statistics for American Indian and Alaska Native residents
Number of households with income < $10k:
Bryant:
0.0% (0)
State:
5.9% (1,768)
Number of households with income $10k - 20k:
Bryant:
0.0% (0)
State:
8.9% (2,694)
Number of households with income $20k - 30k:
Bryant:
100.0% (16)
State:
8.0% (2,412)
Number of households with income $30k - 40k:
Bryant:
0.0% (0)
State:
7.7% (2,327)
Number of households with income $40k - 50k:
Bryant:
0.0% (0)
State:
5.8% (1,755)
Number of households with income $50k - 60k:
Bryant:
0.0% (0)
State:
7.5% (2,259)
Number of households with income $60k - 75k:
Bryant:
0.0% (0)
Washington:
8.8% (2,669)
Number of households with income $75k - 100k:
Bryant:
0.0% (0)
State:
12.8% (3,861)
Number of households with income $100k - 125k:
Bryant:
0.0% (0)
Washington:
12.0% (3,618)
Number of households with income $125k - 150k:
Bryant:
0.0% (0)
State:
8.6% (2,580)
Number of households with income $150k - 200k:
Bryant:
0.0% (0)
State:
5.9% (1,774)
Number of households with income > $200k:
Bryant:
0.0% (0)
State:
8.1% (2,447)
Aggregate household income in Bryant in 2022: $318,096,200
Median per capita income in Bryant in 2022:
Bryant:
$32,092
State:
$27,053
Change in median per capita income between 2000 and 2022:
Bryant, Washington:
+85.4%
Washington:
+98.6%
Income statistics for Multirace residents
Median household income in Bryant, WA in 2022:
Bryant:
$117,935
State:
$84,303
Change in median household income between 2000 and 2022:
Bryant, Washington:
+136.8%
State:
+125.7%
Number of households with income < $10k:
Bryant:
0.0% (0)
Washington:
4.3% (12,040)
Number of households with income $10k - 20k:
Bryant:
0.0% (0)
State:
6.6% (18,437)
Number of households with income $20k - 30k:
Bryant:
0.0% (0)
State:
5.2% (14,559)
Number of households with income $30k - 40k:
Bryant:
0.0% (0)
State:
6.7% (18,491)
Number of households with income $40k - 50k:
Bryant:
0.0% (0)
Washington:
6.3% (17,459)
Number of households with income $50k - 60k:
Bryant:
0.0% (0)
State:
6.9% (19,086)
Number of households with income $60k - 75k:
Bryant:
16.6% (58)
State:
9.1% (25,310)
Number of households with income $75k - 100k:
Bryant:
4.6% (16)
State:
13.5% (37,493)
Number of households with income $100k - 125k:
Bryant:
64.6% (226)
Washington:
10.7% (29,626)
Number of households with income $125k - 150k:
Bryant:
14.3% (50)
State:
8.6% (23,899)
Number of households with income $150k - 200k:
Bryant:
0.0% (0)
State:
10.2% (28,214)
Number of households with income > $200k:
Bryant:
0.0% (0)
State:
11.9% (32,947)
Aggregate household income in Bryant in 2022: $32,625,845
Median family income in Bryant in 2022:
Bryant:
$124,239
State:
$95,629
Number of families with income $60k - 75k:
Bryant:
22.1% (56)
State:
9.7% (17,113)
Number of families with income $75k - 100k:
Bryant:
5.0% (13)
Washington:
13.6% (23,984)
Number of families with income $100k - 125k:
Bryant:
51.3% (130)
Washington:
10.4% (18,288)
Number of families with income $125k - 150k:
Bryant:
21.6% (55)
Washington:
10.5% (18,481)
Median per capita income in Bryant in 2022:
Bryant:
$29,953
State:
$32,496
Change in median per capita income between 2000 and 2022:
Bryant, Washington:
+117.0%
Washington:
+156.8%
Discuss Bryant, Washington (WA) on our hugely popular Washington forum.