The median household income in Burbank, WA in 2022 was $84,958, which was 7.5% less than the median annual income of $91,306 across the entire state of Washington. Compared to the median income of $50,522 in 2000 this represents an increase of 40.5%. The per capita income in 2022 was $32,355, which means an increase of 47.1% compared to 2000 when it was $17,105.
Whole page based on the data from 2000 / 2022 when the population of Burbank, Washington was 3,303 / 3,426
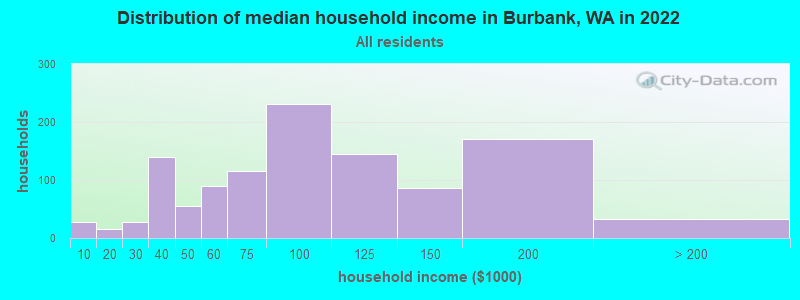
Income statistics for all residents
Median household income in Burbank, WA in 2022:
Burbank:
$84,959
State:
$91,306
Change in median household income between 2000 and 2022:
Burbank, Washington:
+68.2%
State:
+99.5%
Number of households with income < $10k:
Burbank:
2.5% (28)
State:
4.5% (139,331)
Number of households with income $10k - 20k:
Burbank:
1.3% (15)
State:
5.0% (154,508)
Number of households with income $20k - 30k:
Burbank:
2.4% (27)
State:
5.4% (166,555)
Number of households with income $30k - 40k:
Burbank:
12.2% (139)
Washington:
5.5% (170,324)
Number of households with income $40k - 50k:
Burbank:
4.8% (55)
Washington:
6.0% (183,941)
Number of households with income $50k - 60k:
Burbank:
7.9% (90)
Washington:
6.1% (187,395)
Number of households with income $60k - 75k:
Burbank:
10.2% (116)
State:
8.7% (266,771)
Number of households with income $75k - 100k:
Burbank:
20.4% (231)
Washington:
13.1% (404,672)
Number of households with income $100k - 125k:
Burbank:
12.8% (145)
State:
11.0% (337,911)
Number of households with income $125k - 150k:
Burbank:
7.6% (86)
Washington:
8.0% (244,934)
Number of households with income $150k - 200k:
Burbank:
15.1% (171)
State:
10.5% (323,812)
Number of households with income > $200k:
Burbank:
2.8% (32)
State:
16.2% (499,799)
Aggregate household income in Burbank in 2022: $110,167,618
Median family income in Burbank in 2022:
Burbank:
$93,059
State:
$109,192
Number of families with income < $10k:
Burbank:
2.5% (22)
Washington:
2.9% (55,953)
Number of families with income $10k - 20k:
Burbank:
1.8% (16)
State:
2.6% (50,138)
Number of families with income $20k - 30k:
Burbank:
2.0% (18)
State:
3.2% (61,974)
Number of families with income $30k - 40k:
Burbank:
10.9% (96)
State:
4.1% (80,240)
Number of families with income $40k - 50k:
Burbank:
3.2% (28)
State:
4.9% (94,310)
Number of families with income $50k - 60k:
Burbank:
4.7% (41)
State:
5.3% (101,674)
Number of families with income $60k - 75k:
Burbank:
10.1% (89)
State:
8.2% (158,348)
Number of families with income $75k - 100k:
Burbank:
20.8% (184)
Washington:
13.8% (267,812)
Number of families with income $100k - 125k:
Burbank:
17.0% (150)
State:
12.4% (240,213)
Number of families with income $125k - 150k:
Burbank:
9.7% (85)
State:
9.3% (180,011)
Number of families with income $150k - 200k:
Burbank:
13.8% (122)
Washington:
13.0% (250,874)
Number of families with income > $200k:
Burbank:
3.5% (31)
Washington:
20.4% (393,898)
Median non-family income in Burbank in 2022:
Burbank:
$59,329
State:
$57,299
Median per capita income in Burbank in 2022:
Burbank:
$32,355
Washington:
$50,764
Change in median per capita income between 2000 and 2022:
Burbank, Washington:
+89.2%
Washington:
+121.0%
Income statistics for White residents
Median household income in Burbank, WA in 2022:
Burbank:
$90,882
State:
$91,916
Change in median household income between 2000 and 2022:
Burbank, Washington:
+79.4%
State:
+95.4%
Number of households with income < $10k:
Burbank:
2.7% (27)
State:
4.3% (95,850)
Number of households with income $10k - 20k:
Burbank:
0.0% (0)
Washington:
4.8% (106,421)
Number of households with income $20k - 30k:
Burbank:
2.7% (27)
State:
5.5% (122,860)
Number of households with income $30k - 40k:
Burbank:
8.2% (82)
State:
5.4% (119,627)
Number of households with income $40k - 50k:
Burbank:
4.1% (41)
State:
5.9% (132,276)
Number of households with income $50k - 60k:
Burbank:
6.8% (68)
Washington:
6.1% (136,212)
Number of households with income $60k - 75k:
Burbank:
11.5% (114)
State:
8.8% (196,086)
Number of households with income $75k - 100k:
Burbank:
22.4% (223)
Washington:
13.4% (299,192)
Number of households with income $100k - 125k:
Burbank:
14.0% (139)
State:
11.3% (252,209)
Number of households with income $125k - 150k:
Burbank:
8.1% (81)
State:
7.9% (175,962)
Number of households with income $150k - 200k:
Burbank:
16.3% (162)
State:
10.7% (239,156)
Number of households with income > $200k:
Burbank:
3.0% (30)
State:
16.1% (359,917)
Aggregate household income in Burbank in 2022: $101,720,774
Median family income in Burbank in 2022:
Burbank:
$95,199
State:
$112,511
Number of families with income < $10k:
Burbank:
2.7% (20)
State:
2.4% (33,676)
Number of families with income $20k - 30k:
Burbank:
2.2% (16)
State:
2.9% (39,288)
Number of families with income $30k - 40k:
Burbank:
5.5% (41)
Washington:
3.6% (50,190)
Number of families with income $40k - 50k:
Burbank:
2.3% (17)
State:
4.6% (63,009)
Number of families with income $50k - 60k:
Burbank:
2.7% (21)
Washington:
5.0% (69,270)
Number of families with income $60k - 75k:
Burbank:
11.5% (86)
State:
8.2% (112,369)
Number of families with income $75k - 100k:
Burbank:
23.5% (176)
Washington:
14.1% (194,214)
Number of families with income $100k - 125k:
Burbank:
19.4% (145)
State:
13.2% (182,184)
Number of families with income $125k - 150k:
Burbank:
10.6% (79)
State:
9.5% (130,928)
Number of families with income $150k - 200k:
Burbank:
15.6% (116)
State:
13.7% (188,621)
Number of families with income > $200k:
Burbank:
4.0% (30)
State:
20.8% (285,982)
Median non-family income in Burbank in 2022:
Burbank:
$58,620
State:
$56,103
Median per capita income in Burbank in 2022:
Burbank:
$41,261
State:
$55,212
Change in median per capita income between 2000 and 2022:
Burbank, Washington:
+130.8%
Washington:
+123.8%
Income statistics for Hispanic or Latino residents
Median household income in Burbank, WA in 2022:
Burbank:
$50,744
State:
$74,770
Change in median household income between 2000 and 2022:: -11.7%
Burbank, Washington:
-11.7%
State:
+128.3%
Number of households with income < $10k:
Burbank:
0.0% (0)
State:
4.9% (14,456)
Number of households with income $10k - 20k:
Burbank:
0.0% (0)
Washington:
5.3% (15,449)
Number of households with income $20k - 30k:
Burbank:
0.0% (0)
State:
6.8% (20,016)
Number of households with income $30k - 40k:
Burbank:
48.9% (43)
State:
7.7% (22,548)
Number of households with income $40k - 50k:
Burbank:
10.2% (9)
State:
7.3% (21,450)
Number of households with income $50k - 60k:
Burbank:
29.5% (26)
State:
7.7% (22,744)
Number of households with income $60k - 75k:
Burbank:
0.0% (0)
State:
10.5% (30,737)
Number of households with income $75k - 100k:
Burbank:
0.0% (0)
State:
14.9% (43,843)
Number of households with income $100k - 125k:
Burbank:
0.0% (0)
Washington:
11.1% (32,554)
Number of households with income $125k - 150k:
Burbank:
0.0% (0)
Washington:
7.4% (21,624)
Number of households with income $150k - 200k:
Burbank:
11.4% (10)
State:
7.3% (21,360)
Number of households with income > $200k:
Burbank:
0.0% (0)
State:
9.2% (27,055)
Aggregate household income in Burbank in 2022: $5,381,364
Median family income in Burbank in 2022:
Burbank:
$42,571
State:
$76,866
Number of families with income $30k - 40k:
Burbank:
53.4% (45)
State:
8.3% (17,803)
Number of families with income $40k - 50k:
Burbank:
11.0% (9)
State:
7.7% (16,361)
Number of families with income $50k - 60k:
Burbank:
23.6% (20)
State:
7.9% (16,852)
Number of families with income $150k - 200k:
Burbank:
12.1% (10)
State:
8.2% (17,551)
Median per capita income in Burbank in 2022:
Burbank:
$9,454
Washington:
$28,252
Change in median per capita income between 2000 and 2022:
Burbank, Washington:
+3.3%
State:
+150.2%
Income statistics for American Indian and Alaska Native residents
Median per capita income in Burbank in 2022:
Burbank:
$40,365
Washington:
$27,053
Change in median per capita income between 2000 and 2022:
Burbank, Washington:
+97.1%
State:
+98.6%
Income statistics for Multirace residents
Median household income in Burbank, WA in 2022:
Burbank:
$32,088
State:
$84,303
Change in median household income between 2000 and 2022:
Burbank, Washington:
+20.2%
State:
+125.7%
Number of households with income < $10k:
Burbank:
0.0% (0)
State:
4.3% (12,040)
Number of households with income $10k - 20k:
Burbank:
29.4% (25)
Washington:
6.6% (18,437)
Number of households with income $20k - 30k:
Burbank:
0.0% (0)
State:
5.2% (14,559)
Number of households with income $30k - 40k:
Burbank:
69.4% (59)
State:
6.7% (18,491)
Number of households with income $40k - 50k:
Burbank:
1.2% (1)
Washington:
6.3% (17,459)
Number of households with income $50k - 60k:
Burbank:
0.0% (0)
State:
6.9% (19,086)
Number of households with income $60k - 75k:
Burbank:
0.0% (0)
State:
9.1% (25,310)
Number of households with income $75k - 100k:
Burbank:
0.0% (0)
State:
13.5% (37,493)
Number of households with income $100k - 125k:
Burbank:
0.0% (0)
Washington:
10.7% (29,626)
Number of households with income $125k - 150k:
Burbank:
0.0% (0)
State:
8.6% (23,899)
Number of households with income $150k - 200k:
Burbank:
0.0% (0)
State:
10.2% (28,214)
Number of households with income > $200k:
Burbank:
0.0% (0)
State:
11.9% (32,947)
Aggregate household income in Burbank in 2022: $2,214,301
Median family income in Burbank in 2022:
Burbank:
$31,712
Washington:
$95,629
Number of families with income $10k - 20k:
Burbank:
29.6% (25)
State:
4.3% (7,519)
Number of families with income $30k - 40k:
Burbank:
70.4% (60)
State:
5.8% (10,186)
Median per capita income in Burbank in 2022:
Burbank:
$9,028
State:
$32,496
Change in median per capita income between 2000 and 2022:: -38.5%
Burbank, Washington:
-38.5%
State:
+156.8%
Income statistics for other residents
Median household income in Burbank, WA in 2022:
Burbank:
$51,947
State:
$69,545
Number of households with income < $10k:
Burbank:
0.0% (0)
Washington:
5.3% (6,540)
Number of households with income $10k - 20k:
Burbank:
0.0% (0)
Washington:
6.0% (7,385)
Number of households with income $20k - 30k:
Burbank:
0.0% (0)
Washington:
7.5% (9,289)
Number of households with income $30k - 40k:
Burbank:
38.6% (17)
State:
8.9% (11,015)
Number of households with income $40k - 50k:
Burbank:
20.5% (9)
Washington:
7.6% (9,399)
Number of households with income $50k - 60k:
Burbank:
40.9% (18)
State:
7.2% (8,867)
Number of households with income $60k - 75k:
Burbank:
0.0% (0)
State:
10.5% (13,032)
Number of households with income $75k - 100k:
Burbank:
0.0% (0)
Washington:
14.6% (18,007)
Number of households with income $100k - 125k:
Burbank:
0.0% (0)
State:
12.2% (15,128)
Number of households with income $125k - 150k:
Burbank:
0.0% (0)
Washington:
5.6% (6,950)
Number of households with income $150k - 200k:
Burbank:
0.0% (0)
State:
7.1% (8,749)
Number of households with income > $200k:
Burbank:
0.0% (0)
State:
7.5% (9,208)
Aggregate household income in Burbank in 2022: $2,593,577
Median family income in Burbank in 2022:
Burbank:
$54,043
State:
$72,588
Number of families with income $30k - 40k:
Burbank:
38.9% (19)
State:
9.2% (8,827)
Number of families with income $40k - 50k:
Burbank:
21.2% (10)
State:
8.0% (7,634)
Number of families with income $50k - 60k:
Burbank:
40.0% (19)
State:
7.7% (7,357)
Median per capita income in Burbank in 2022:
Burbank:
$7,963
Washington:
$27,542
Change in median per capita income between 2000 and 2022:: -6.4%
Burbank, Washington:
-6.4%
State:
+167.8%
Discuss Burbank, Washington (WA) on our hugely popular Washington forum.