Charlemont, Massachusetts (MA) income map, earnings map, and wages data
The median household income in Charlemont, MA in 2022 was $80,273, which was 17.7% less than the median annual income of $94,488 across the entire state of Massachusetts. Compared to the median income of $46,548 in 2000 this represents an increase of 42.0%. The per capita income in 2022 was $35,667, which means an increase of 45.1% compared to 2000 when it was $19,577.
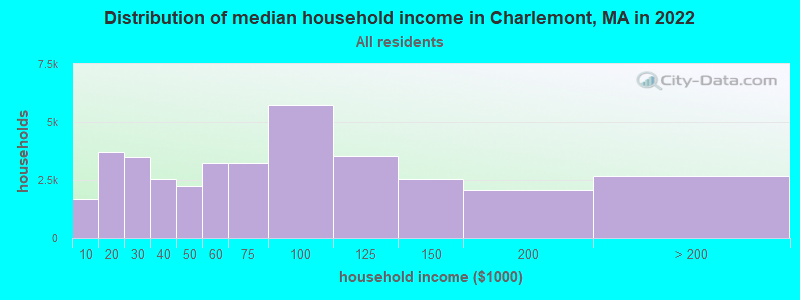
Income statistics for all residents
Median household income in Charlemont, MA in 2022:| Charlemont: | $80,274 |
| State: | $94,488 |
Change in median household income between 2000 and 2022:| Charlemont, Massachusetts: | +72.5% |
| State: | +87.1% |
Number of households with income < $10k:| Charlemont: | 4.6% (1,697) |
| Massachusetts: | 5.2% (146,170) |
Number of households with income $10k - 20k:| Charlemont: | 10.1% (3,720) |
| State: | 6.4% (180,001) |
Number of households with income $20k - 30k:| Charlemont: | 9.5% (3,482) |
| State: | 5.6% (156,667) |
Number of households with income $30k - 40k:| Charlemont: | 6.9% (2,542) |
| State: | 5.6% (157,168) |
Number of households with income $40k - 50k:| Charlemont: | 6.1% (2,226) |
| Massachusetts: | 5.4% (151,455) |
Number of households with income $50k - 60k:| Charlemont: | 8.9% (3,252) |
| State: | 5.1% (142,726) |
Number of households with income $60k - 75k:| Charlemont: | 8.8% (3,224) |
| State: | 7.6% (212,203) |
Number of households with income $75k - 100k:| Charlemont: | 15.6% (5,742) |
| State: | 11.3% (317,064) |
Number of households with income $100k - 125k:| Charlemont: | 9.6% (3,538) |
| State: | 9.7% (270,603) |
Number of households with income $125k - 150k:| Charlemont: | 7.0% (2,553) |
| State: | 8.0% (223,140) |
Number of households with income $150k - 200k:| Charlemont: | 5.6% (2,052) |
| State: | 11.0% (308,695) |
Number of households with income > $200k:| Charlemont: | 7.3% (2,672) |
| Massachusetts: | 19.0% (531,884) |
Aggregate household income in Charlemont in 2022: $48,449,302
Median family income in Charlemont in 2022:| Charlemont: | $87,749 |
| Massachusetts: | $120,263 |
Median non-family income in Charlemont in 2022:| Charlemont: | $38,033 |
| State: | $55,979 |
Change in median non-family income between 2000 and 2022:| Charlemont, Massachusetts: | +58.3% |
| State: | +88.0% |
Median per capita income in Charlemont in 2022:| Charlemont: | $35,668 |
| State: | $54,025 |
Change in median per capita income between 2000 and 2022:| Charlemont, Massachusetts: | +82.2% |
| State: | +108.2% |
Income statistics for White residents
Median household income in Charlemont, MA in 2022:| Charlemont: | $82,951 |
| State: | $101,391 |
Change in median household income between 2000 and 2022:| Charlemont, Massachusetts: | +76.5% |
| State: | +93.3% |
Number of households with income < $10k:| Charlemont: | 3.1% (1,085) |
| State: | 4.4% (91,120) |
Number of households with income $10k - 20k:| Charlemont: | 9.1% (3,151) |
| Massachusetts: | 5.9% (122,055) |
Number of households with income $20k - 30k:| Charlemont: | 9.1% (3,164) |
| State: | 5.1% (105,311) |
Number of households with income $30k - 40k:| Charlemont: | 7.2% (2,484) |
| Massachusetts: | 5.3% (110,239) |
Number of households with income $40k - 50k:| Charlemont: | 6.3% (2,190) |
| State: | 5.0% (104,636) |
Number of households with income $50k - 60k:| Charlemont: | 9.0% (3,105) |
| State: | 4.8% (99,486) |
Number of households with income $60k - 75k:| Charlemont: | 8.8% (3,044) |
| State: | 7.5% (155,124) |
Number of households with income $75k - 100k:| Charlemont: | 16.6% (5,741) |
| State: | 11.4% (236,252) |
Number of households with income $100k - 125k:| Charlemont: | 10.2% (3,525) |
| Massachusetts: | 9.9% (204,731) |
Number of households with income $125k - 150k:| Charlemont: | 7.3% (2,524) |
| State: | 8.5% (175,324) |
Number of households with income $150k - 200k:| Charlemont: | 5.7% (1,990) |
| State: | 11.7% (242,980) |
Number of households with income > $200k:| Charlemont: | 7.6% (2,646) |
| Massachusetts: | 20.5% (425,966) |
Aggregate household income in Charlemont in 2022: $46,023,800
Median family income in Charlemont in 2022:| Charlemont: | $92,300 |
| State: | $133,153 |
Number of families with income < $10k:| Charlemont: | 2.2% (7) |
| State: | 2.0% (25,038) |
Number of families with income $10k - 20k:| Charlemont: | 3.3% (11) |
| State: | 2.1% (26,403) |
Number of families with income $20k - 30k:| Charlemont: | 6.4% (21) |
| Massachusetts: | 2.6% (32,525) |
Number of families with income $30k - 40k:| Charlemont: | 5.5% (18) |
| State: | 3.9% (48,079) |
Number of families with income $40k - 50k:| Charlemont: | 6.9% (22) |
| State: | 3.8% (46,908) |
Number of families with income $50k - 60k:| Charlemont: | 10.2% (33) |
| State: | 3.8% (46,476) |
Number of families with income $60k - 75k:| Charlemont: | 9.9% (32) |
| Massachusetts: | 6.4% (79,040) |
Number of families with income $75k - 100k:| Charlemont: | 20.7% (67) |
| State: | 11.1% (137,395) |
Number of families with income $100k - 125k:| Charlemont: | 12.8% (42) |
| State: | 11.1% (136,771) |
Number of families with income $125k - 150k:| Charlemont: | 2.1% (7) |
| State: | 10.0% (123,709) |
Number of families with income $150k - 200k:| Charlemont: | 8.0% (26) |
| State: | 14.7% (181,602) |
Number of families with income > $200k:| Charlemont: | 12.1% (40) |
| State: | 28.5% (351,887) |
Median non-family income in Charlemont in 2022:| Charlemont: | $41,749 |
| Massachusetts: | $59,323 |
Change in median non-family income between 2000 and 2022:| Charlemont, Massachusetts: | +74.6% |
| Massachusetts: | +94.3% |
Median per capita income in Charlemont in 2022:| Charlemont: | $38,541 |
| Massachusetts: | $60,804 |
Change in median per capita income between 2000 and 2022:| Charlemont, Massachusetts: | +91.7% |
| State: | +118.7% |
Income statistics for Black or African American residents
Median household income in Charlemont, MA in 2022:| Charlemont: | $2,163 |
| Massachusetts: | $63,189 |
Number of households with income < $10k:| Charlemont: | 9.1% (16,979) |
| State: | 9.1% (15,797) |
Number of households with income $10k - 20k:| Charlemont: | 9.4% (17,484) |
| Massachusetts: | 9.4% (16,267) |
Number of households with income $20k - 30k:| Charlemont: | 7.8% (14,532) |
| State: | 7.8% (13,520) |
Number of households with income $30k - 40k:| Charlemont: | 8.3% (15,490) |
| Massachusetts: | 8.3% (14,412) |
Number of households with income $40k - 50k:| Charlemont: | 7.9% (14,822) |
| State: | 7.9% (13,790) |
Number of households with income $50k - 60k:| Charlemont: | 5.8% (10,792) |
| State: | 5.8% (10,041) |
Number of households with income $60k - 75k:| Charlemont: | 8.5% (15,931) |
| State: | 8.5% (14,822) |
Number of households with income $75k - 100k:| Charlemont: | 11.0% (20,552) |
| State: | 11.0% (19,122) |
Number of households with income $100k - 125k:| Charlemont: | 8.4% (15,665) |
| State: | 8.4% (14,575) |
Number of households with income $125k - 150k:| Charlemont: | 6.0% (11,209) |
| State: | 6.0% (10,429) |
Number of households with income $150k - 200k:| Charlemont: | 7.2% (13,477) |
| Massachusetts: | 7.2% (12,539) |
Number of households with income > $200k:| Charlemont: | 10.5% (19,545) |
| State: | 10.5% (18,185) |
Aggregate household income in Charlemont in 2022: $881,826
Median non-family income in Charlemont in 2022:| Charlemont: | $1,847 |
| State: | $38,934 |
Median per capita income in Charlemont in 2022:| Charlemont: | $22,835 |
| State: | $33,524 |
Income statistics for Asian residents
Median household income in Charlemont, MA in 2022:| Charlemont: | $9,192 |
| State: | $117,855 |
Number of households with income < $10k:| Charlemont: | 6.8% (7,887) |
| Massachusetts: | 6.8% (11,982) |
Number of households with income $10k - 20k:| Charlemont: | 4.8% (5,513) |
| State: | 4.8% (8,376) |
Number of households with income $20k - 30k:| Charlemont: | 3.7% (4,317) |
| Massachusetts: | 3.7% (6,558) |
Number of households with income $30k - 40k:| Charlemont: | 3.3% (3,783) |
| State: | 3.3% (5,748) |
Number of households with income $40k - 50k:| Charlemont: | 4.1% (4,734) |
| State: | 4.1% (7,192) |
Number of households with income $50k - 60k:| Charlemont: | 5.0% (5,749) |
| State: | 5.0% (8,734) |
Number of households with income $60k - 75k:| Charlemont: | 5.8% (6,716) |
| State: | 5.8% (10,203) |
Number of households with income $75k - 100k:| Charlemont: | 8.6% (9,975) |
| State: | 8.6% (15,154) |
Number of households with income $100k - 125k:| Charlemont: | 10.8% (12,468) |
| Massachusetts: | 10.8% (18,942) |
Number of households with income $125k - 150k:| Charlemont: | 8.0% (9,240) |
| State: | 8.0% (14,037) |
Number of households with income $150k - 200k:| Charlemont: | 12.5% (14,387) |
| State: | 12.5% (21,856) |
Number of households with income > $200k:| Charlemont: | 26.6% (30,736) |
| State: | 26.6% (46,694) |
Aggregate household income in Charlemont in 2022: $366,760
Median non-family income in Charlemont in 2022:| Charlemont: | $4,114 |
| State: | $71,440 |
Median per capita income in Charlemont in 2022:| Charlemont: | $6,889 |
| State: | $58,900 |
Income statistics for Hispanic or Latino residents
Median household income in Charlemont, MA in 2022:| Charlemont: | $41,345 |
| Massachusetts: | $61,523 |
Change in median household income between 2000 and 2022:| Charlemont, Massachusetts: | +120.5% |
| State: | +125.4% |
Number of households with income < $10k:| Charlemont: | 8.8% (17,381) |
| State: | 8.8% (25,307) |
Number of households with income $10k - 20k:| Charlemont: | 10.0% (19,680) |
| State: | 10.0% (28,653) |
Number of households with income $20k - 30k:| Charlemont: | 8.8% (17,300) |
| State: | 8.8% (25,189) |
Number of households with income $30k - 40k:| Charlemont: | 7.2% (14,301) |
| State: | 7.2% (20,822) |
Number of households with income $40k - 50k:| Charlemont: | 7.2% (14,297) |
| State: | 7.2% (20,817) |
Number of households with income $50k - 60k:| Charlemont: | 6.5% (12,876) |
| Massachusetts: | 6.5% (18,748) |
Number of households with income $60k - 75k:| Charlemont: | 8.8% (17,438) |
| State: | 8.8% (25,390) |
Number of households with income $75k - 100k:| Charlemont: | 12.0% (23,687) |
| State: | 12.0% (34,488) |
Number of households with income $100k - 125k:| Charlemont: | 8.6% (16,895) |
| State: | 8.6% (24,599) |
Number of households with income $125k - 150k:| Charlemont: | 6.2% (12,186) |
| State: | 6.2% (17,743) |
Number of households with income $150k - 200k:| Charlemont: | 7.3% (14,435) |
| State: | 7.3% (21,017) |
Number of households with income > $200k:| Charlemont: | 8.6% (16,900) |
| Massachusetts: | 8.6% (24,606) |
Aggregate household income in Charlemont in 2022: $678,307
Median family income in Charlemont in 2022:| Charlemont: | $62,494 |
| State: | $66,072 |
Number of families with income < $10k:| Charlemont: | 13.1% (7) |
| Massachusetts: | 6.2% (12,456) |
Number of families with income $10k - 20k:| Charlemont: | 5.3% (3) |
| Massachusetts: | 6.0% (12,071) |
Number of families with income $20k - 30k:| Charlemont: | 18.5% (9) |
| State: | 10.1% (20,376) |
Number of families with income $30k - 40k:| Charlemont: | 10.4% (5) |
| Massachusetts: | 8.2% (16,470) |
Number of families with income $40k - 50k:| Charlemont: | 8.3% (4) |
| State: | 7.4% (14,829) |
Number of families with income $50k - 60k:| Charlemont: | 10.4% (5) |
| State: | 7.3% (14,643) |
Number of families with income $60k - 75k:| Charlemont: | 11.9% (6) |
| State: | 10.6% (21,252) |
Number of families with income $75k - 100k:| Charlemont: | 11.4% (6) |
| State: | 12.0% (24,088) |
Number of families with income $100k - 125k:| Charlemont: | 4.3% (2) |
| State: | 8.9% (17,954) |
Number of families with income $125k - 150k:| Charlemont: | 0.8% (0) |
| State: | 6.9% (13,837) |
Number of families with income $150k - 200k:| Charlemont: | 3.3% (2) |
| State: | 7.3% (14,683) |
Number of families with income > $200k:| Charlemont: | 2.2% (1) |
| State: | 9.3% (18,741) |
Median non-family income in Charlemont in 2022:| Charlemont: | $95,023 |
| State: | $37,563 |
Median per capita income in Charlemont in 2022:| Charlemont: | $14,077 |
| Massachusetts: | $28,993 |
Change in median per capita income between 2000 and 2022:| Charlemont, Massachusetts: | +84.1% |
| State: | +142.4% |
Income statistics for American Indian and Alaska Native residents
Aggregate household income in Charlemont in 2022: $393,922
Median per capita income in Charlemont in 2022:| Charlemont: | $44,201 |
| State: | $39,434 |
Change in median per capita income between 2000 and 2022:| Charlemont, Massachusetts: | +140.2% |
| State: | +148.2% |
Income statistics for Multirace residents
Median household income in Charlemont, MA in 2022:| Charlemont: | $76,885 |
| State: | $71,552 |
Change in median household income between 2000 and 2022:| Charlemont, Massachusetts: | +66.2% |
| State: | +109.0% |
Number of households with income < $10k:| Charlemont: | 6.6% (10,285) |
| State: | 6.6% (15,127) |
Number of households with income $10k - 20k:| Charlemont: | 9.3% (14,456) |
| State: | 9.2% (21,158) |
Number of households with income $20k - 30k:| Charlemont: | 7.8% (12,185) |
| State: | 7.8% (18,016) |
Number of households with income $30k - 40k:| Charlemont: | 8.0% (12,430) |
| State: | 7.9% (18,260) |
Number of households with income $40k - 50k:| Charlemont: | 5.7% (8,820) |
| State: | 5.6% (13,027) |
Number of households with income $50k - 60k:| Charlemont: | 5.6% (8,732) |
| State: | 5.6% (12,909) |
Number of households with income $60k - 75k:| Charlemont: | 9.0% (14,045) |
| State: | 9.0% (20,800) |
Number of households with income $75k - 100k:| Charlemont: | 12.1% (18,950) |
| State: | 12.1% (27,875) |
Number of households with income $100k - 125k:| Charlemont: | 8.1% (12,661) |
| State: | 8.1% (18,754) |
Number of households with income $125k - 150k:| Charlemont: | 6.8% (10,551) |
| Massachusetts: | 6.8% (15,621) |
Number of households with income $150k - 200k:| Charlemont: | 9.2% (14,427) |
| State: | 9.4% (21,618) |
Number of households with income > $200k:| Charlemont: | 11.8% (18,476) |
| State: | 12.0% (27,592) |
Aggregate household income in Charlemont in 2022: $2,087,781
Median family income in Charlemont in 2022:| Charlemont: | $93,891 |
| State: | $78,380 |
Number of families with income $30k - 40k:| Charlemont: | 42.9% (10) |
| State: | 8.2% (12,705) |
Number of families with income $40k - 50k:| Charlemont: | 57.1% (13) |
| State: | 5.3% (8,255) |
Median non-family income in Charlemont in 2022:| Charlemont: | $182,566 |
| State: | $42,253 |
Median per capita income in Charlemont in 2022:| Charlemont: | $21,205 |
| State: | $34,029 |
Change in median per capita income between 2000 and 2022:| Charlemont, Massachusetts: | +12.0% |
| State: | +132.1% |
Income statistics for other residents
Aggregate household income in Charlemont in 2022: $184,855
Median per capita income in Charlemont in 2022:| Charlemont: | $7,882 |
| State: | $30,797 |
Change in median per capita income between 2000 and 2022:| Charlemont, Massachusetts: | +138.9% |
| Massachusetts: | +188.5% |