Cooks Point, Texas (TX) income map, earnings map, and wages data
The median household income in Cooks Point, TX in 2022 was $72,513, which was about the same as the median annual income of $72,284 across the entire state of Texas. Compared to the median income of $39,333 in 2000 this represents an increase of 45.8%. The per capita income in 2022 was $30,157, which means an increase of 48.5% compared to 2000 when it was $15,528.
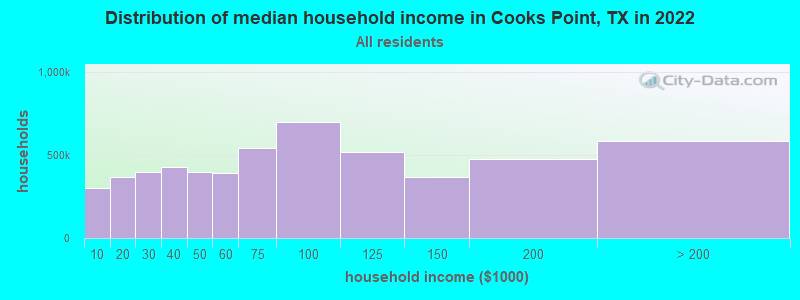
Income statistics for all residents
Median household income in Cooks Point, TX in 2022:| Cooks Point: | $72,514 |
| State: | $72,284 |
Change in median household income between 2000 and 2022:| Cooks Point, Texas: | +84.4% |
| Texas: | +81.0% |
Number of households with income < $10k:| Cooks Point: | 5.5% (300,796) |
| State: | 5.5% (611,011) |
Number of households with income $10k - 20k:| Cooks Point: | 6.7% (366,040) |
| State: | 6.7% (743,157) |
Number of households with income $20k - 30k:| Cooks Point: | 7.2% (395,715) |
| Texas: | 7.2% (803,381) |
Number of households with income $30k - 40k:| Cooks Point: | 7.8% (426,551) |
| State: | 7.8% (866,080) |
Number of households with income $40k - 50k:| Cooks Point: | 7.3% (399,163) |
| Texas: | 7.3% (810,440) |
Number of households with income $50k - 60k:| Cooks Point: | 7.2% (393,861) |
| State: | 7.2% (799,783) |
Number of households with income $60k - 75k:| Cooks Point: | 9.9% (539,461) |
| Texas: | 9.9% (1,095,384) |
Number of households with income $75k - 100k:| Cooks Point: | 12.8% (699,055) |
| Texas: | 12.8% (1,419,057) |
Number of households with income $100k - 125k:| Cooks Point: | 9.5% (519,558) |
| State: | 9.5% (1,054,577) |
Number of households with income $125k - 150k:| Cooks Point: | 6.7% (365,414) |
| State: | 6.7% (741,518) |
Number of households with income $150k - 200k:| Cooks Point: | 8.7% (473,691) |
| State: | 8.7% (961,776) |
Number of households with income > $200k:| Cooks Point: | 10.7% (581,691) |
| Texas: | 10.7% (1,181,544) |
Aggregate household income in Cooks Point in 2022: $5,679,238,509
Median family income in Cooks Point in 2022:| Cooks Point: | $91,519 |
| State: | $86,267 |
Median non-family income in Cooks Point in 2022:| Cooks Point: | $34,087 |
| State: | $45,999 |
Change in median non-family income between 2000 and 2022:| Cooks Point, Texas: | +85.2% |
| Texas: | +79.5% |
Median per capita income in Cooks Point in 2022:| Cooks Point: | $30,157 |
| State: | $38,123 |
Change in median per capita income between 2000 and 2022:| Cooks Point, Texas: | +94.2% |
| State: | +94.3% |
Income statistics for White residents
Median household income in Cooks Point, TX in 2022:| Cooks Point: | $95,384 |
| Texas: | $82,032 |
Change in median household income between 2000 and 2022:| Cooks Point, Texas: | +90.4% |
| Texas: | +91.0% |
Number of households with income < $10k:| Cooks Point: | 4.7% (159,180) |
| State: | 4.7% (273,716) |
Number of households with income $10k - 20k:| Cooks Point: | 5.5% (188,011) |
| State: | 5.5% (322,702) |
Number of households with income $20k - 30k:| Cooks Point: | 6.2% (212,158) |
| Texas: | 6.2% (363,947) |
Number of households with income $30k - 40k:| Cooks Point: | 6.8% (232,551) |
| Texas: | 6.8% (399,275) |
Number of households with income $40k - 50k:| Cooks Point: | 6.5% (223,236) |
| Texas: | 6.5% (383,417) |
Number of households with income $50k - 60k:| Cooks Point: | 6.6% (226,173) |
| Texas: | 6.6% (388,535) |
Number of households with income $60k - 75k:| Cooks Point: | 9.6% (329,216) |
| Texas: | 9.7% (566,295) |
Number of households with income $75k - 100k:| Cooks Point: | 13.0% (442,411) |
| State: | 13.0% (760,276) |
Number of households with income $100k - 125k:| Cooks Point: | 10.2% (347,752) |
| State: | 10.2% (597,596) |
Number of households with income $125k - 150k:| Cooks Point: | 7.4% (254,128) |
| State: | 7.4% (436,830) |
Number of households with income $150k - 200k:| Cooks Point: | 9.9% (338,933) |
| Texas: | 9.9% (583,067) |
Number of households with income > $200k:| Cooks Point: | 13.5% (459,558) |
| State: | 13.5% (792,647) |
Aggregate household income in Cooks Point in 2022: $3,004,134,178
Median family income in Cooks Point in 2022:| Cooks Point: | $101,894 |
| State: | $101,788 |
Number of families with income $10k - 20k:| Cooks Point: | 4.6% (11) |
| Texas: | 2.9% (113,421) |
Number of families with income $20k - 30k:| Cooks Point: | 4.1% (10) |
| Texas: | 4.1% (157,688) |
Number of families with income $30k - 40k:| Cooks Point: | 10.8% (26) |
| State: | 5.2% (198,847) |
Number of families with income $40k - 50k:| Cooks Point: | 5.8% (14) |
| Texas: | 5.6% (216,490) |
Number of families with income $50k - 60k:| Cooks Point: | 15.6% (37) |
| Texas: | 5.7% (220,689) |
Number of families with income $60k - 75k:| Cooks Point: | 13.4% (32) |
| State: | 9.0% (346,106) |
Number of families with income $75k - 100k:| Cooks Point: | 16.4% (39) |
| State: | 13.7% (527,363) |
Number of families with income $100k - 125k:| Cooks Point: | 13.6% (32) |
| State: | 11.6% (448,411) |
Number of families with income $125k - 150k:| Cooks Point: | 15.7% (37) |
| Texas: | 9.2% (355,798) |
Median non-family income in Cooks Point in 2022:| Cooks Point: | $45,425 |
| State: | $50,587 |
Change in median non-family income between 2000 and 2022:| Cooks Point, Texas: | +85.8% |
| State: | +87.7% |
Median per capita income in Cooks Point in 2022:| Cooks Point: | $35,376 |
| State: | $47,740 |
Change in median per capita income between 2000 and 2022:| Cooks Point, Texas: | +112.1% |
| State: | +114.3% |
Income statistics for Black or African American residents
Median household income in Cooks Point, TX in 2022:| Cooks Point: | $37,942 |
| State: | $55,759 |
Change in median household income between 2000 and 2022:| Cooks Point, Texas: | +113.5% |
| State: | +90.3% |
Number of households with income < $10k:| Cooks Point: | 8.9% (38,172) |
| Texas: | 8.9% (126,378) |
Number of households with income $10k - 20k:| Cooks Point: | 9.9% (42,676) |
| State: | 9.9% (140,369) |
Number of households with income $20k - 30k:| Cooks Point: | 8.5% (36,716) |
| Texas: | 8.5% (120,639) |
Number of households with income $30k - 40k:| Cooks Point: | 9.7% (41,512) |
| State: | 9.7% (137,517) |
Number of households with income $40k - 50k:| Cooks Point: | 7.9% (34,102) |
| State: | 8.0% (112,973) |
Number of households with income $50k - 60k:| Cooks Point: | 8.2% (35,337) |
| State: | 8.3% (117,156) |
Number of households with income $60k - 75k:| Cooks Point: | 10.4% (44,607) |
| State: | 10.4% (147,462) |
Number of households with income $75k - 100k:| Cooks Point: | 11.5% (49,254) |
| State: | 11.5% (162,718) |
Number of households with income $100k - 125k:| Cooks Point: | 8.1% (34,971) |
| Texas: | 8.2% (115,829) |
Number of households with income $125k - 150k:| Cooks Point: | 4.9% (21,192) |
| Texas: | 4.9% (69,556) |
Number of households with income $150k - 200k:| Cooks Point: | 6.4% (27,447) |
| State: | 6.4% (90,701) |
Number of households with income > $200k:| Cooks Point: | 5.5% (23,580) |
| Texas: | 5.5% (77,988) |
Aggregate household income in Cooks Point in 2022: $45,903,673
Median family income in Cooks Point in 2022:| Cooks Point: | $45,959 |
| Texas: | $69,134 |
Number of families with income < $10k:| Cooks Point: | 6.0% (3) |
| Texas: | 6.8% (55,625) |
Number of families with income $10k - 20k:| Cooks Point: | 13.0% (7) |
| State: | 6.8% (55,300) |
Number of families with income $20k - 30k:| Cooks Point: | 8.0% (4) |
| Texas: | 7.1% (57,877) |
Number of families with income $50k - 60k:| Cooks Point: | 19.6% (11) |
| State: | 7.3% (59,511) |
Number of families with income $100k - 125k:| Cooks Point: | 53.4% (29) |
| State: | 9.4% (76,609) |
Median non-family income in Cooks Point in 2022:| Cooks Point: | $14,080 |
| Texas: | $40,133 |
Change in median non-family income between 2000 and 2022:| Cooks Point, Texas: | +133.0% |
| Texas: | +102.2% |
Median per capita income in Cooks Point in 2022:| Cooks Point: | $30,883 |
| State: | $30,490 |
Change in median per capita income between 2000 and 2022:| Cooks Point, Texas: | +116.3% |
| Texas: | +113.9% |
Income statistics for Hispanic or Latino residents
Median household income in Cooks Point, TX in 2022:| Cooks Point: | $42,109 |
| State: | $60,504 |
Change in median household income between 2000 and 2022:| Cooks Point, Texas: | +112.9% |
| State: | +102.5% |
Number of households with income < $10k:| Cooks Point: | 5.8% (70,908) |
| State: | 5.8% (213,953) |
Number of households with income $10k - 20k:| Cooks Point: | 8.0% (98,617) |
| State: | 8.0% (297,456) |
Number of households with income $20k - 30k:| Cooks Point: | 9.2% (112,675) |
| State: | 9.2% (340,166) |
Number of households with income $30k - 40k:| Cooks Point: | 9.5% (117,476) |
| State: | 9.5% (354,336) |
Number of households with income $40k - 50k:| Cooks Point: | 8.8% (108,344) |
| Texas: | 8.8% (327,013) |
Number of households with income $50k - 60k:| Cooks Point: | 8.3% (102,255) |
| State: | 8.3% (308,818) |
Number of households with income $60k - 75k:| Cooks Point: | 10.9% (134,257) |
| Texas: | 10.9% (405,109) |
Number of households with income $75k - 100k:| Cooks Point: | 13.8% (169,637) |
| Texas: | 13.8% (511,639) |
Number of households with income $100k - 125k:| Cooks Point: | 8.6% (106,015) |
| Texas: | 8.6% (319,728) |
Number of households with income $125k - 150k:| Cooks Point: | 5.7% (70,001) |
| Texas: | 5.7% (210,932) |
Number of households with income $150k - 200k:| Cooks Point: | 6.4% (78,178) |
| Texas: | 6.4% (236,055) |
Number of households with income > $200k:| Cooks Point: | 5.1% (62,766) |
| Texas: | 5.1% (189,259) |
Aggregate household income in Cooks Point in 2022: $100,696,631
Median family income in Cooks Point in 2022:| Cooks Point: | $43,377 |
| State: | $65,080 |
Number of families with income $10k - 20k:| Cooks Point: | 7.3% (14) |
| Texas: | 6.3% (174,531) |
Number of families with income $20k - 30k:| Cooks Point: | 9.3% (18) |
| State: | 8.6% (238,528) |
Number of families with income $30k - 40k:| Cooks Point: | 15.0% (29) |
| State: | 9.1% (251,999) |
Number of families with income $40k - 50k:| Cooks Point: | 8.0% (16) |
| State: | 8.6% (240,188) |
Number of families with income $50k - 60k:| Cooks Point: | 18.4% (36) |
| Texas: | 8.0% (223,566) |
Number of families with income $60k - 75k:| Cooks Point: | 13.3% (26) |
| Texas: | 10.9% (302,688) |
Number of families with income $75k - 100k:| Cooks Point: | 13.2% (26) |
| State: | 14.3% (398,554) |
Number of families with income $100k - 125k:| Cooks Point: | 7.9% (15) |
| State: | 9.5% (264,007) |
Number of families with income $125k - 150k:| Cooks Point: | 7.6% (15) |
| Texas: | 6.2% (171,274) |
Median per capita income in Cooks Point in 2022:| Cooks Point: | $13,366 |
| Texas: | $24,862 |
Change in median per capita income between 2000 and 2022:| Cooks Point, Texas: | +128.5% |
| State: | +130.8% |
Income statistics for Multirace residents
Number of households with income < $10k:| Cooks Point: | 5.5% (265,093) |
| State: | 5.5% (122,324) |
Number of households with income $10k - 20k:| Cooks Point: | 8.2% (394,934) |
| State: | 8.2% (182,232) |
Number of households with income $20k - 30k:| Cooks Point: | 8.5% (409,977) |
| Texas: | 8.5% (189,456) |
Number of households with income $30k - 40k:| Cooks Point: | 8.9% (427,852) |
| State: | 8.9% (197,499) |
Number of households with income $40k - 50k:| Cooks Point: | 8.7% (415,680) |
| Texas: | 8.7% (191,735) |
Number of households with income $50k - 60k:| Cooks Point: | 8.0% (384,285) |
| State: | 8.0% (177,535) |
Number of households with income $60k - 75k:| Cooks Point: | 10.5% (503,891) |
| State: | 10.5% (232,479) |
Number of households with income $75k - 100k:| Cooks Point: | 13.1% (629,240) |
| State: | 13.1% (290,448) |
Number of households with income $100k - 125k:| Cooks Point: | 8.7% (415,343) |
| State: | 8.6% (191,595) |
Number of households with income $125k - 150k:| Cooks Point: | 6.0% (289,384) |
| State: | 6.0% (133,361) |
Number of households with income $150k - 200k:| Cooks Point: | 7.2% (344,338) |
| State: | 7.2% (159,195) |
Number of households with income > $200k:| Cooks Point: | 6.7% (320,746) |
| Texas: | 6.7% (148,064) |
Median per capita income in Cooks Point in 2022:| Cooks Point: | $114,628 |
| Texas: | $26,785 |
Change in median per capita income between 2000 and 2022:| Cooks Point, Texas: | +108.4% |
| State: | +110.9% |
Income statistics for other residents
Number of households with income < $10k:| Cooks Point: | 5.6% (10) |
| State: | 5.9% (54,162) |
Number of households with income $10k - 20k:| Cooks Point: | 6.7% (12) |
| State: | 6.8% (62,891) |
Number of households with income $20k - 30k:| Cooks Point: | 10.7% (19) |
| State: | 10.6% (97,294) |
Number of households with income $30k - 40k:| Cooks Point: | 10.7% (19) |
| Texas: | 10.8% (99,670) |
Number of households with income $40k - 50k:| Cooks Point: | 9.6% (17) |
| Texas: | 9.3% (85,548) |
Number of households with income $50k - 60k:| Cooks Point: | 9.0% (16) |
| Texas: | 9.0% (82,757) |
Number of households with income $60k - 75k:| Cooks Point: | 10.7% (19) |
| Texas: | 10.9% (100,326) |
Number of households with income $75k - 100k:| Cooks Point: | 14.0% (25) |
| Texas: | 14.0% (128,767) |
Number of households with income $100k - 125k:| Cooks Point: | 8.4% (15) |
| State: | 8.2% (75,218) |
Number of households with income $125k - 150k:| Cooks Point: | 5.1% (9) |
| State: | 4.8% (44,223) |
Number of households with income $150k - 200k:| Cooks Point: | 5.6% (10) |
| Texas: | 5.6% (51,376) |
Number of households with income > $200k:| Cooks Point: | 3.9% (7) |
| State: | 4.0% (36,393) |
Aggregate household income in Cooks Point in 2022: $13,005,563
Median family income in Cooks Point in 2022:| Cooks Point: | $49,394 |
| State: | $60,064 |
Number of families with income < $10k:| Cooks Point: | 26.6% (8) |
| Texas: | 6.8% (47,502) |
Number of families with income $10k - 20k:| Cooks Point: | 6.2% (2) |
| Texas: | 6.0% (41,763) |
Number of families with income $20k - 30k:| Cooks Point: | 11.0% (3) |
| State: | 9.9% (68,761) |
Number of families with income $30k - 40k:| Cooks Point: | 19.9% (6) |
| Texas: | 9.7% (67,685) |
Number of families with income $60k - 75k:| Cooks Point: | 36.3% (11) |
| Texas: | 11.2% (77,588) |
Median per capita income in Cooks Point in 2022:| Cooks Point: | $14,936 |
| Texas: | $23,899 |
Change in median per capita income between 2000 and 2022:| Cooks Point, Texas: | +141.8% |
| State: | +135.2% |