The median household income in Coquille, OR in 2022 was $47,397, which was 59.6% less than the median annual income of $75,657 across the entire state of Oregon. Compared to the median income of $29,931 in 2000 this represents an increase of 36.9%. The per capita income in 2022 was $26,598, which means an increase of 45.0% compared to 2000 when it was $14,619.
Whole page based on the data from 2000 / 2022 when the population of Coquille, Oregon was 4,184 / 4,019
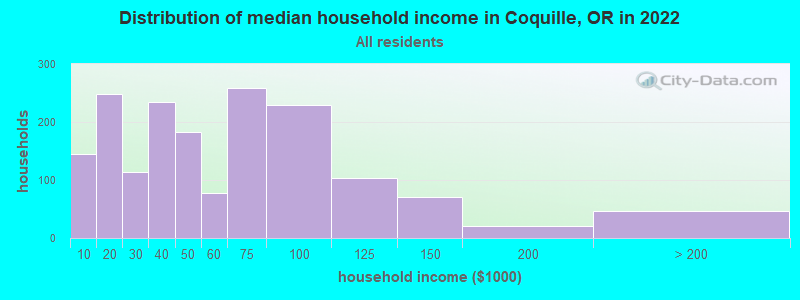
Income statistics for all residents
Median household income in Coquille, OR in 2022:
Coquille:
$47,397
State:
$75,657
Change in median household income between 2000 and 2022:
Coquille, Oregon:
+58.4%
State:
+84.9%
Number of households with income < $10k:
Coquille:
8.4% (145)
State:
5.1% (87,297)
Number of households with income $10k - 20k:
Coquille:
14.3% (248)
Oregon:
6.7% (115,299)
Number of households with income $20k - 30k:
Coquille:
6.6% (114)
State:
6.9% (119,114)
Number of households with income $30k - 40k:
Coquille:
13.5% (234)
Oregon:
7.1% (122,333)
Number of households with income $40k - 50k:
Coquille:
10.6% (183)
State:
7.2% (124,562)
Number of households with income $50k - 60k:
Coquille:
4.5% (78)
State:
6.9% (118,435)
Number of households with income $60k - 75k:
Coquille:
14.9% (258)
State:
9.8% (168,926)
Number of households with income $75k - 100k:
Coquille:
13.2% (229)
State:
13.3% (229,104)
Number of households with income $100k - 125k:
Coquille:
6.0% (104)
State:
10.5% (181,787)
Number of households with income $125k - 150k:
Coquille:
4.1% (71)
State:
7.4% (127,392)
Number of households with income $150k - 200k:
Coquille:
1.2% (21)
State:
8.6% (148,614)
Number of households with income > $200k:
Coquille:
2.7% (46)
Oregon:
10.6% (183,477)
Aggregate household income in Coquille in 2022: $102,880,041
Median family income in Coquille in 2022:
Coquille:
$63,369
State:
$93,384
Number of families with income < $10k:
Coquille:
0.9% (9)
Oregon:
3.1% (32,019)
Number of families with income $10k - 20k:
Coquille:
6.4% (63)
State:
3.0% (31,605)
Number of families with income $20k - 30k:
Coquille:
6.7% (66)
Oregon:
4.5% (47,306)
Number of families with income $30k - 40k:
Coquille:
13.5% (132)
State:
5.8% (60,772)
Number of families with income $40k - 50k:
Coquille:
13.3% (130)
State:
6.4% (66,435)
Number of families with income $50k - 60k:
Coquille:
2.6% (26)
State:
6.1% (63,915)
Number of families with income $60k - 75k:
Coquille:
18.5% (181)
State:
9.9% (102,697)
Number of families with income $75k - 100k:
Coquille:
15.2% (149)
State:
14.3% (148,745)
Number of families with income $100k - 125k:
Coquille:
10.3% (101)
State:
12.4% (129,023)
Number of families with income $125k - 150k:
Coquille:
7.0% (68)
Oregon:
8.8% (91,808)
Number of families with income $150k - 200k:
Coquille:
0.9% (9)
State:
11.3% (117,224)
Number of families with income > $200k:
Coquille:
4.6% (45)
State:
14.4% (149,534)
Median non-family income in Coquille in 2022:
Coquille:
$30,549
State:
$48,114
Change in median non-family income between 2000 and 2022:
Coquille, Oregon:
+90.7%
Oregon:
+86.8%
Median per capita income in Coquille in 2022:
Coquille:
$26,599
Oregon:
$42,474
Change in median per capita income between 2000 and 2022:
Coquille, Oregon:
+81.9%
State:
+102.8%
Income statistics for White residents
Median household income in Coquille, OR in 2022:
Coquille:
$48,530
State:
$76,846
Change in median household income between 2000 and 2022:
Coquille, Oregon:
+58.8%
State:
+84.8%
Number of households with income < $10k:
Coquille:
2.2% (32)
State:
4.9% (67,757)
Number of households with income $10k - 20k:
Coquille:
16.4% (238)
State:
6.6% (91,229)
Number of households with income $20k - 30k:
Coquille:
7.5% (109)
State:
6.8% (93,981)
Number of households with income $30k - 40k:
Coquille:
13.1% (190)
State:
6.9% (95,328)
Number of households with income $40k - 50k:
Coquille:
12.1% (176)
Oregon:
7.2% (100,221)
Number of households with income $50k - 60k:
Coquille:
5.2% (76)
State:
6.9% (95,294)
Number of households with income $60k - 75k:
Coquille:
17.0% (247)
Oregon:
9.5% (132,178)
Number of households with income $75k - 100k:
Coquille:
14.6% (212)
State:
13.5% (187,105)
Number of households with income $100k - 125k:
Coquille:
4.2% (61)
State:
10.5% (145,264)
Number of households with income $125k - 150k:
Coquille:
3.7% (54)
State:
7.3% (101,755)
Number of households with income $150k - 200k:
Coquille:
1.4% (21)
State:
8.7% (121,099)
Number of households with income > $200k:
Coquille:
2.3% (33)
Oregon:
11.1% (153,992)
Aggregate household income in Coquille in 2022: $86,505,785
Median family income in Coquille in 2022:
Coquille:
$62,905
State:
$95,912
Number of families with income < $10k:
Coquille:
1.1% (9)
State:
2.8% (23,325)
Number of families with income $10k - 20k:
Coquille:
7.1% (59)
Oregon:
2.8% (23,464)
Number of families with income $20k - 30k:
Coquille:
7.5% (62)
State:
4.1% (33,830)
Number of families with income $30k - 40k:
Coquille:
11.6% (96)
State:
5.6% (46,508)
Number of families with income $40k - 50k:
Coquille:
15.1% (125)
State:
6.4% (53,001)
Number of families with income $50k - 60k:
Coquille:
2.9% (24)
Oregon:
6.0% (49,589)
Number of families with income $60k - 75k:
Coquille:
20.5% (170)
State:
9.4% (77,838)
Number of families with income $75k - 100k:
Coquille:
16.1% (134)
State:
14.7% (121,106)
Number of families with income $100k - 125k:
Coquille:
7.1% (59)
State:
12.3% (101,829)
Number of families with income $125k - 150k:
Coquille:
6.1% (51)
Oregon:
8.9% (73,376)
Number of families with income $150k - 200k:
Coquille:
1.0% (9)
State:
11.7% (96,629)
Number of families with income > $200k:
Coquille:
3.9% (33)
State:
15.2% (125,084)
Median non-family income in Coquille in 2022:
Coquille:
$32,664
State:
$48,924
Change in median non-family income between 2000 and 2022:
Coquille, Oregon:
+94.9%
State:
+88.0%
Median per capita income in Coquille in 2022:
Coquille:
$26,534
State:
$45,669
Change in median per capita income between 2000 and 2022:
Coquille, Oregon:
+73.1%
Oregon:
+106.5%
Income statistics for Hispanic or Latino residents
Median household income in Coquille, OR in 2022:
Coquille:
$83,378
Oregon:
$65,081
Change in median household income between 2000 and 2022:
Coquille, Oregon:
+134.0%
Oregon:
+103.9%
Number of households with income < $10k:
Coquille:
0.0% (0)
State:
5.0% (8,626)
Number of households with income $10k - 20k:
Coquille:
17.0% (15)
Oregon:
5.4% (9,284)
Number of households with income $20k - 30k:
Coquille:
0.0% (0)
State:
8.2% (14,265)
Number of households with income $30k - 40k:
Coquille:
0.0% (0)
State:
9.9% (17,228)
Number of households with income $40k - 50k:
Coquille:
0.0% (0)
Oregon:
9.2% (16,040)
Number of households with income $50k - 60k:
Coquille:
0.0% (0)
State:
7.8% (13,499)
Number of households with income $60k - 75k:
Coquille:
0.0% (0)
Oregon:
12.6% (21,845)
Number of households with income $75k - 100k:
Coquille:
35.2% (31)
State:
13.6% (23,566)
Number of households with income $100k - 125k:
Coquille:
47.7% (42)
State:
10.2% (17,704)
Number of households with income $125k - 150k:
Coquille:
0.0% (0)
State:
5.9% (10,188)
Number of households with income $150k - 200k:
Coquille:
0.0% (0)
State:
7.1% (12,405)
Number of households with income > $200k:
Coquille:
0.0% (0)
State:
5.1% (8,851)
Aggregate household income in Coquille in 2022: $7,471,604
Median per capita income in Coquille in 2022:
Coquille:
$18,547
State:
$25,274
Change in median per capita income between 2000 and 2022:
Coquille, Oregon:
+143.4%
Oregon:
+149.8%
Income statistics for American Indian and Alaska Native residents
Median per capita income in Coquille in 2022:
Coquille:
$27,078
State:
$28,382
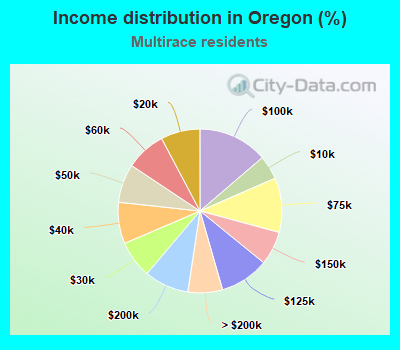
Income statistics for Multirace residents
Number of households with income < $10k:
Coquille:
50.6% (131)
State:
4.7% (7,092)
Number of households with income $10k - 20k:
Coquille:
0.0% (0)
State:
7.7% (11,619)
Number of households with income $20k - 30k:
Coquille:
0.0% (0)
State:
7.4% (11,055)
Number of households with income $30k - 40k:
Coquille:
17.8% (46)
State:
8.2% (12,256)
Number of households with income $40k - 50k:
Coquille:
0.0% (0)
State:
7.6% (11,440)
Number of households with income $50k - 60k:
Coquille:
0.0% (0)
Oregon:
7.9% (11,878)
Number of households with income $60k - 75k:
Coquille:
0.0% (0)
Oregon:
10.8% (16,149)
Number of households with income $75k - 100k:
Coquille:
6.2% (16)
State:
13.7% (20,620)
Number of households with income $100k - 125k:
Coquille:
18.5% (48)
Oregon:
9.7% (14,562)
Number of households with income $125k - 150k:
Coquille:
6.9% (18)
State:
6.6% (9,976)
Number of households with income $150k - 200k:
Coquille:
0.0% (0)
State:
8.8% (13,229)
Number of households with income > $200k:
Coquille:
0.0% (0)
State:
6.8% (10,234)
Aggregate household income in Coquille in 2022: $10,424,804
Median family income in Coquille in 2022:
Coquille:
$112,998
State:
$81,783
Number of families with income $30k - 40k:
Coquille:
29.0% (34)
State:
6.4% (5,825)
Number of families with income $75k - 100k:
Coquille:
13.1% (16)
Oregon:
15.1% (13,765)
Number of families with income $100k - 125k:
Coquille:
43.8% (52)
State:
12.1% (11,019)
Number of families with income $125k - 150k:
Coquille:
14.1% (17)
State:
8.1% (7,325)
Median per capita income in Coquille in 2022:
Coquille:
$21,688
State:
$29,750
Income statistics for other residents
Median per capita income in Coquille in 2022:
Coquille:
$24,213
State:
$25,226
Discuss Coquille, Oregon (OR) on our hugely popular Oregon forum.