Cumberland, Virginia (VA) income map, earnings map, and wages data

Data:
The per capita income in 2022 was $42,939, which means an increase of 64.8% compared to 2000 when it was $15,103.
Whole page based on the data from 2000 / 2022 when the population of Cumberland, Virginia was 393 / 336
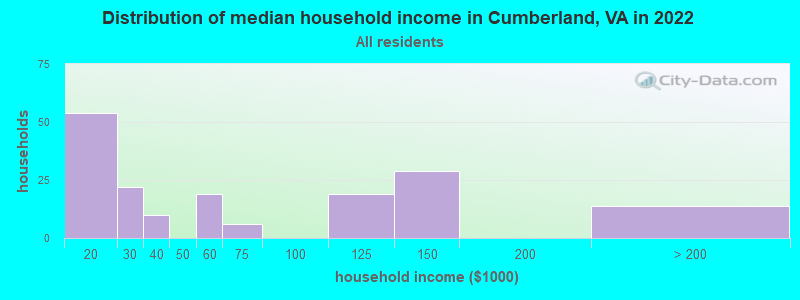
Income statistics for all residents
Number of households with income < $10k:| Cumberland: | 0.0% (0) |
| State: | 4.9% (165,315) |
Number of households with income $10k - 20k:| Cumberland: | 31.2% (54) |
| State: | 5.9% (199,380) |
Number of households with income $20k - 30k:| Cumberland: | 12.7% (22) |
| State: | 6.0% (202,243) |
Number of households with income $30k - 40k:| Cumberland: | 5.8% (10) |
| State: | 6.1% (205,967) |
Number of households with income $40k - 50k:| Cumberland: | 0.0% (0) |
| Virginia: | 6.4% (215,648) |
Number of households with income $50k - 60k:| Cumberland: | 11.0% (19) |
| State: | 6.2% (210,516) |
Number of households with income $60k - 75k:| Cumberland: | 3.5% (6) |
| Virginia: | 8.6% (292,112) |
Number of households with income $75k - 100k:| Cumberland: | 0.0% (0) |
| State: | 12.2% (412,198) |
Number of households with income $100k - 125k:| Cumberland: | 11.0% (19) |
| State: | 10.3% (348,998) |
Number of households with income $125k - 150k:| Cumberland: | 16.8% (29) |
| Virginia: | 7.7% (261,236) |
Number of households with income $150k - 200k:| Cumberland: | 0.0% (0) |
| State: | 10.3% (347,282) |
Number of households with income > $200k:| Cumberland: | 8.1% (14) |
| Virginia: | 15.4% (519,712) |
Aggregate household income in Cumberland in 2022: $12,139,314
Median family income in Cumberland in 2022:| Cumberland: | $104,052 |
| State: | $107,101 |
Number of families with income $10k - 20k:| Cumberland: | 31.7% (32) |
| Virginia: | 3.3% (71,807) |
Number of families with income $60k - 75k:| Cumberland: | 6.2% (6) |
| State: | 8.2% (180,564) |
Number of families with income $100k - 125k:| Cumberland: | 18.5% (18) |
| Virginia: | 11.3% (248,485) |
Number of families with income $125k - 150k:| Cumberland: | 29.3% (29) |
| State: | 9.0% (197,999) |
Number of families with income > $200k:| Cumberland: | 14.3% (14) |
| State: | 20.3% (445,515) |
Median non-family income in Cumberland in 2022:| Cumberland: | $23,578 |
| State: | $51,436 |
Change in median non-family income between 2000 and 2022:| Cumberland, Virginia: | +16.3% |
| State: | +73.5% |
Median per capita income in Cumberland in 2022:| Cumberland: | $42,940 |
| Virginia: | $47,199 |
Income statistics for White residents
Number of households with income < $10k:| Cumberland: | 0.0% (0) |
| State: | 4.1% (90,549) |
Number of households with income $10k - 20k:| Cumberland: | 28.9% (28) |
| Virginia: | 5.2% (114,324) |
Number of households with income $20k - 30k:| Cumberland: | 21.6% (21) |
| State: | 5.7% (125,676) |
Number of households with income $30k - 40k:| Cumberland: | 10.3% (10) |
| Virginia: | 5.5% (121,220) |
Number of households with income $40k - 50k:| Cumberland: | 0.0% (0) |
| State: | 6.0% (133,011) |
Number of households with income $50k - 60k:| Cumberland: | 19.6% (19) |
| State: | 6.2% (136,856) |
Number of households with income $60k - 75k:| Cumberland: | 6.2% (6) |
| State: | 8.4% (186,094) |
Number of households with income $75k - 100k:| Cumberland: | 0.0% (0) |
| State: | 12.5% (277,077) |
Number of households with income $100k - 125k:| Cumberland: | 0.0% (0) |
| State: | 10.8% (237,562) |
Number of households with income $125k - 150k:| Cumberland: | 0.0% (0) |
| State: | 8.0% (177,532) |
Number of households with income $150k - 200k:| Cumberland: | 0.0% (0) |
| State: | 11.0% (242,106) |
Number of households with income > $200k:| Cumberland: | 13.4% (13) |
| Virginia: | 16.6% (366,064) |
Aggregate household income in Cumberland in 2022: $5,692,195
Median per capita income in Cumberland in 2022:| Cumberland: | $43,283 |
| State: | $53,456 |
Change in median per capita income between 2000 and 2022:| Cumberland, Virginia: | +147.5% |
| State: | +99.2% |
Income statistics for Black or African American residents
Number of households with income < $10k:| Cumberland: | 0.0% (0) |
| State: | 8.3% (52,649) |
Number of households with income $10k - 20k:| Cumberland: | 33.3% (24) |
| State: | 9.6% (60,583) |
Number of households with income $20k - 30k:| Cumberland: | 0.0% (0) |
| State: | 8.1% (51,220) |
Number of households with income $30k - 40k:| Cumberland: | 0.0% (0) |
| Virginia: | 8.6% (54,185) |
Number of households with income $40k - 50k:| Cumberland: | 0.0% (0) |
| State: | 8.1% (51,156) |
Number of households with income $50k - 60k:| Cumberland: | 0.0% (0) |
| State: | 7.0% (44,637) |
Number of households with income $60k - 75k:| Cumberland: | 0.0% (0) |
| State: | 9.8% (62,332) |
Number of households with income $75k - 100k:| Cumberland: | 0.0% (0) |
| Virginia: | 11.4% (72,479) |
Number of households with income $100k - 125k:| Cumberland: | 25.0% (18) |
| Virginia: | 8.5% (53,997) |
Number of households with income $125k - 150k:| Cumberland: | 41.7% (30) |
| State: | 6.3% (40,032) |
Number of households with income $150k - 200k:| Cumberland: | 0.0% (0) |
| State: | 6.9% (43,513) |
Number of households with income > $200k:| Cumberland: | 0.0% (0) |
| Virginia: | 7.4% (46,851) |
Aggregate household income in Cumberland in 2022: $6,321,096
Median family income in Cumberland in 2022:| Cumberland: | $130,933 |
| Virginia: | $74,125 |
Number of families with income $100k - 125k:| Cumberland: | 38.0% (18) |
| Virginia: | 9.9% (37,339) |
Number of families with income $125k - 150k:| Cumberland: | 62.0% (29) |
| State: | 7.8% (29,249) |
Median per capita income in Cumberland in 2022:| Cumberland: | $44,227 |
| Virginia: | $34,599 |