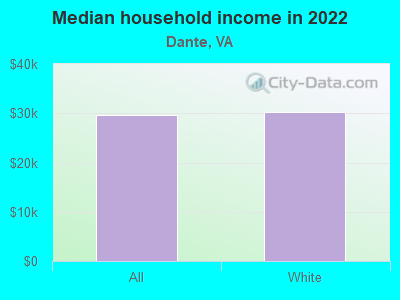
The median household income in Dante, VA in 2022 was $29,731, which was 188.8% less than the median annual income of $85,873 across the entire state of Virginia. Compared to the median income of $26,834 in 2000 this represents an increase of 9.7%. The per capita income in 2022 was $14,337, which means a decrease of 3.7% compared to 2000 when it was $14,863.
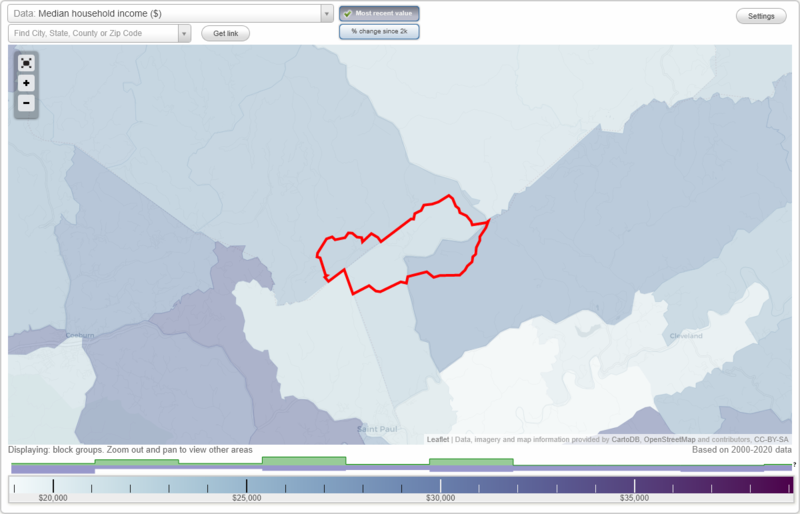
Whole page based on the data from 2000 / 2022 when the population of Dante, Virginia was 649 / 522
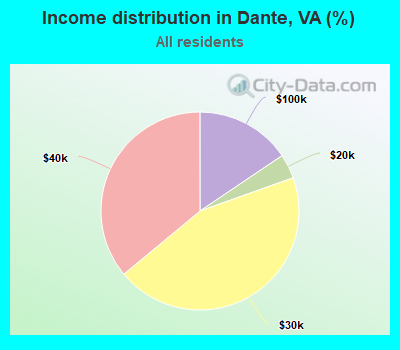
Income statistics for all residents
Median household income in Dante, VA in 2022:
Dante:
$29,732
Virginia:
$85,873
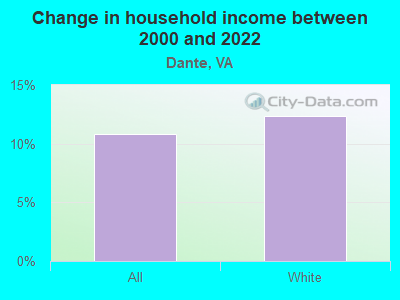
Change in median household income between 2000 and 2022:
Dante, Virginia:
+10.8%
State:
+84.0%
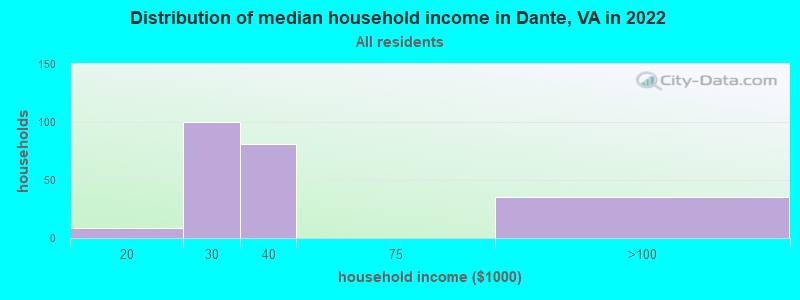
Number of households with income < $10k:
Dante:
0.0% (0)
Virginia:
4.9% (165,315)
Number of households with income $10k - 20k:
Dante:
4.0% (9)
State:
5.9% (199,380)
Number of households with income $20k - 30k:
Dante:
44.4% (100)
State:
6.0% (202,243)
Number of households with income $30k - 40k:
Dante:
36.0% (81)
State:
6.1% (205,967)
Number of households with income $40k - 50k:
Dante:
0.0% (0)
State:
6.4% (215,648)
Number of households with income $50k - 60k:
Dante:
0.0% (0)
State:
6.2% (210,516)
Number of households with income $60k - 75k:
Dante:
0.0% (0)
State:
8.6% (292,112)
Number of households with income $75k - 100k:
Dante:
15.6% (35)
Virginia:
12.2% (412,198)
Number of households with income $100k - 125k:
Dante:
0.0% (0)
State:
10.3% (348,998)
Number of households with income $125k - 150k:
Dante:
0.0% (0)
State:
7.7% (261,236)
Number of households with income $150k - 200k:
Dante:
0.0% (0)
State:
10.3% (347,282)
Number of households with income > $200k:
Dante:
0.0% (0)
State:
15.4% (519,712)
Aggregate household income in Dante in 2022: $7,462,103
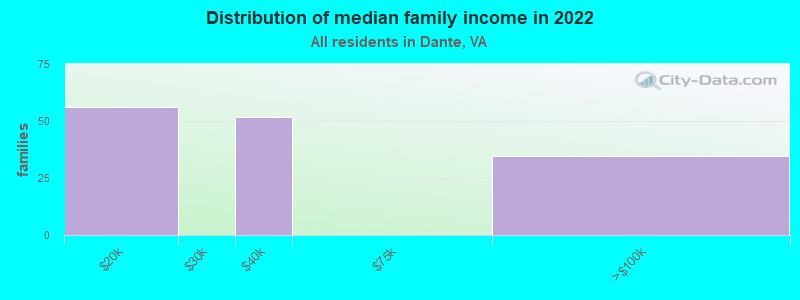
Median family income in Dante in 2022:
Dante:
$32,316
State:
$107,101
Number of families with income $10k - 20k:
Dante:
39.4% (56)
State:
3.3% (71,807)
Number of families with income $30k - 40k:
Dante:
36.4% (52)
Virginia:
4.7% (103,002)
Number of families with income $75k - 100k:
Dante:
24.2% (35)
Virginia:
12.6% (277,221)
Median income for 2 person families:
Dante:
$32,183
State:
$91,707
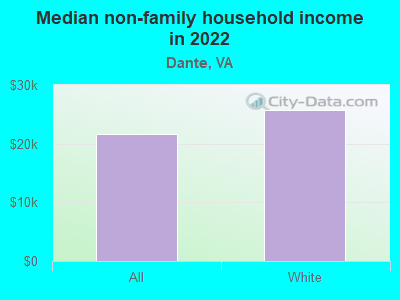
Median non-family income in Dante in 2022:
Dante:
$21,576
Virginia:
$51,436
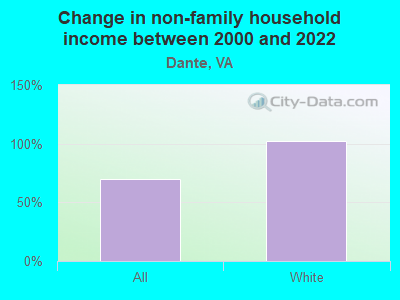
Change in median non-family income between 2000 and 2022:
Dante, Virginia:
+70.3%
State:
+73.5%
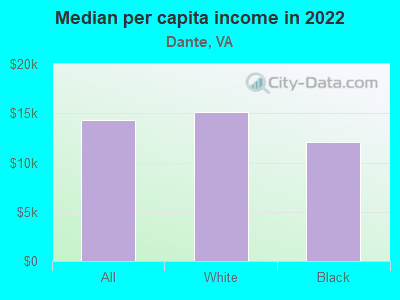
Median per capita income in Dante in 2022:
Dante:
$14,338
State:
$47,199
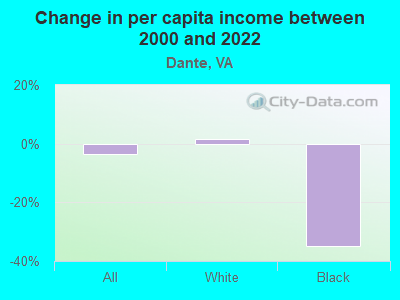
Change in median per capita income between 2000 and 2022:: -3.5%
Dante, Virginia:
-3.5%
State:
+96.9%
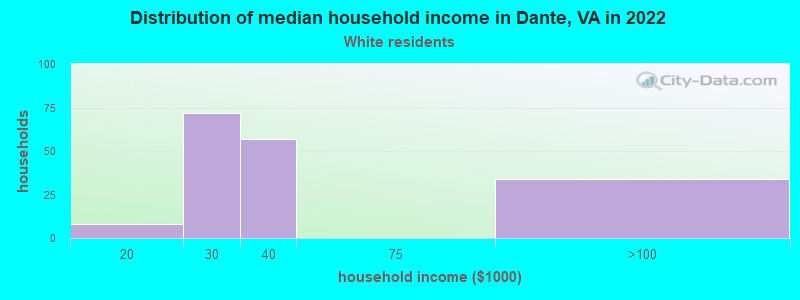
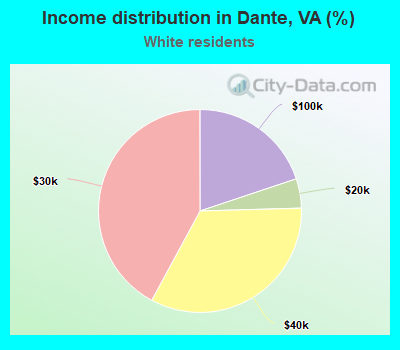
Income statistics for White residents
Median household income in Dante, VA in 2022:
Dante:
$30,159
State:
$91,924
Change in median household income between 2000 and 2022:
Dante, Virginia:
+12.3%
State:
+81.9%
Number of households with income < $10k:
Dante:
0.0% (0)
Virginia:
4.1% (90,549)
Number of households with income $10k - 20k:
Dante:
4.7% (8)
State:
5.2% (114,324)
Number of households with income $20k - 30k:
Dante:
42.1% (72)
State:
5.7% (125,676)
Number of households with income $30k - 40k:
Dante:
33.3% (57)
State:
5.5% (121,220)
Number of households with income $40k - 50k:
Dante:
0.0% (0)
State:
6.0% (133,011)
Number of households with income $50k - 60k:
Dante:
0.0% (0)
State:
6.2% (136,856)
Number of households with income $60k - 75k:
Dante:
0.0% (0)
State:
8.4% (186,094)
Number of households with income $75k - 100k:
Dante:
19.9% (34)
State:
12.5% (277,077)
Number of households with income $100k - 125k:
Dante:
0.0% (0)
Virginia:
10.8% (237,562)
Number of households with income $125k - 150k:
Dante:
0.0% (0)
State:
8.0% (177,532)
Number of households with income $150k - 200k:
Dante:
0.0% (0)
State:
11.0% (242,106)
Number of households with income > $200k:
Dante:
0.0% (0)
State:
16.6% (366,064)
Aggregate household income in Dante in 2022: $6,038,402
Median non-family income in Dante in 2022:
Dante:
$25,766
State:
$53,785
Change in median non-family income between 2000 and 2022:
Dante, Virginia:
+102.5%
State:
+70.5%
Median per capita income in Dante in 2022:
Dante:
$15,109
State:
$53,456
Change in median per capita income between 2000 and 2022:
Dante, Virginia:
+1.7%
Virginia:
+99.2%
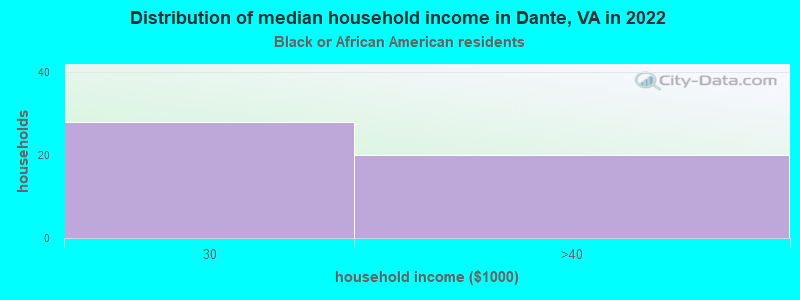
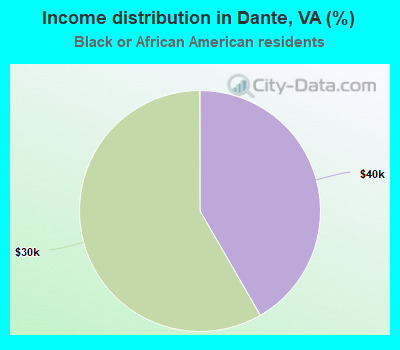
Income statistics for Black or African American residents
Number of households with income < $10k:
Dante:
0.0% (0)
State:
8.3% (52,649)
Number of households with income $10k - 20k:
Dante:
0.0% (0)
State:
9.6% (60,583)
Number of households with income $20k - 30k:
Dante:
58.3% (28)
State:
8.1% (51,220)
Number of households with income $30k - 40k:
Dante:
41.7% (20)
State:
8.6% (54,185)
Number of households with income $40k - 50k:
Dante:
0.0% (0)
State:
8.1% (51,156)
Number of households with income $50k - 60k:
Dante:
0.0% (0)
Virginia:
7.0% (44,637)
Number of households with income $60k - 75k:
Dante:
0.0% (0)
State:
9.8% (62,332)
Number of households with income $75k - 100k:
Dante:
0.0% (0)
Virginia:
11.4% (72,479)
Number of households with income $100k - 125k:
Dante:
0.0% (0)
Virginia:
8.5% (53,997)
Number of households with income $125k - 150k:
Dante:
0.0% (0)
State:
6.3% (40,032)
Number of households with income $150k - 200k:
Dante:
0.0% (0)
Virginia:
6.9% (43,513)
Number of households with income > $200k:
Dante:
0.0% (0)
State:
7.4% (46,851)
Aggregate household income in Dante in 2022: $40,657,840
Median per capita income in Dante in 2022:
Dante:
$12,081
State:
$34,599
Change in median per capita income between 2000 and 2022:: -35.0%
Dante, Virginia:
-35.0%
State:
+119.8%
Discuss Dante, Virginia (VA) on our hugely popular Virginia forum.