The median household income in Del Mar, CA in 2022 was $189,069, which was 51.6% greater than the median annual income of $91,551 across the entire state of California. Compared to the median income of $81,001 in 2000 this represents an increase of 57.2%. The per capita income in 2022 was $139,591, which means an increase of 55.3% compared to 2000 when it was $62,425.
Whole page based on the data from 2000 / 2022 when the population of Del Mar, California was 4,389 / 3,940
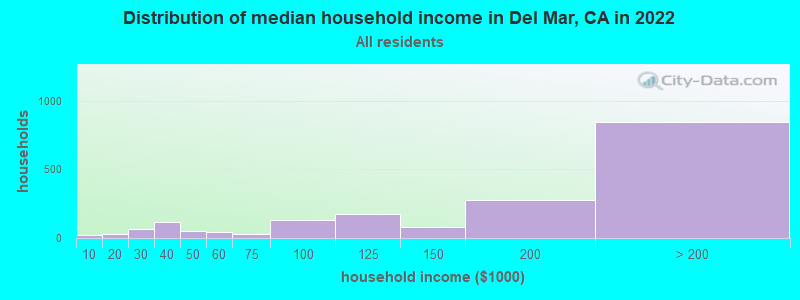
Income statistics for all residents
Median household income in Del Mar, CA in 2022:
Del Mar:
$189,069
State:
$91,551
Change in median household income between 2000 and 2022:
Del Mar, California:
+133.4%
California:
+92.8%
Number of households with income < $10k:
Del Mar:
1.2% (22)
State:
4.8% (654,370)
Number of households with income $10k - 20k:
Del Mar:
1.5% (28)
State:
5.8% (789,493)
Number of households with income $20k - 30k:
Del Mar:
3.5% (66)
State:
5.7% (778,318)
Number of households with income $30k - 40k:
Del Mar:
6.4% (119)
State:
5.8% (783,170)
Number of households with income $40k - 50k:
Del Mar:
2.7% (50)
California:
5.8% (781,352)
Number of households with income $50k - 60k:
Del Mar:
2.2% (41)
State:
5.6% (760,175)
Number of households with income $60k - 75k:
Del Mar:
1.7% (32)
State:
8.2% (1,104,699)
Number of households with income $75k - 100k:
Del Mar:
7.2% (134)
State:
12.0% (1,627,633)
Number of households with income $100k - 125k:
Del Mar:
9.2% (173)
State:
10.0% (1,358,619)
Number of households with income $125k - 150k:
Del Mar:
4.4% (83)
California:
7.6% (1,027,455)
Number of households with income $150k - 200k:
Del Mar:
14.9% (278)
State:
10.6% (1,439,811)
Number of households with income > $200k:
Del Mar:
45.2% (846)
State:
18.0% (2,445,491)
Aggregate household income in Del Mar in 2022: $542,829,047
Median family income in Del Mar in 2022:
Del Mar:
$245,863
State:
$104,823
Number of families with income < $10k:
Del Mar:
0.5% (6)
State:
3.1% (280,184)
Number of families with income $10k - 20k:
Del Mar:
1.1% (13)
California:
3.5% (322,064)
Number of families with income $30k - 40k:
Del Mar:
1.4% (16)
California:
5.2% (478,213)
Number of families with income $40k - 50k:
Del Mar:
3.6% (43)
State:
5.6% (511,647)
Number of families with income $50k - 60k:
Del Mar:
2.5% (29)
California:
5.5% (498,926)
Number of families with income $60k - 75k:
Del Mar:
1.1% (13)
California:
8.0% (731,094)
Number of families with income $75k - 100k:
Del Mar:
4.1% (49)
State:
12.2% (1,115,621)
Number of families with income $100k - 125k:
Del Mar:
7.8% (92)
California:
10.5% (959,600)
Number of families with income $125k - 150k:
Del Mar:
5.4% (64)
California:
8.4% (768,725)
Number of families with income $150k - 200k:
Del Mar:
15.3% (182)
State:
11.9% (1,087,239)
Number of families with income > $200k:
Del Mar:
57.2% (679)
State:
21.5% (1,963,769)
Median non-family income in Del Mar in 2022:
Del Mar:
$105,692
State:
$59,348
Change in median non-family income between 2000 and 2022:
Del Mar, California:
+73.8%
California:
+85.3%
Median per capita income in Del Mar in 2022:
Del Mar:
$139,591
State:
$46,661
Change in median per capita income between 2000 and 2022:
Del Mar, California:
+123.6%
State:
+105.5%
Income statistics for White residents
Median household income in Del Mar, CA in 2022:
Del Mar:
$184,052
State:
$100,917
Change in median household income between 2000 and 2022:
Del Mar, California:
+131.4%
State:
+96.8%
Number of households with income < $10k:
Del Mar:
1.4% (21)
State:
4.4% (284,109)
Number of households with income $10k - 20k:
Del Mar:
1.5% (23)
California:
5.3% (340,330)
Number of households with income $20k - 30k:
Del Mar:
3.6% (55)
State:
5.3% (343,145)
Number of households with income $30k - 40k:
Del Mar:
6.2% (95)
State:
5.1% (330,146)
Number of households with income $40k - 50k:
Del Mar:
2.8% (43)
State:
5.2% (335,310)
Number of households with income $50k - 60k:
Del Mar:
1.0% (16)
California:
5.1% (326,299)
Number of households with income $60k - 75k:
Del Mar:
1.7% (26)
California:
7.6% (487,640)
Number of households with income $75k - 100k:
Del Mar:
6.8% (104)
California:
11.5% (736,578)
Number of households with income $100k - 125k:
Del Mar:
9.6% (148)
State:
10.1% (648,782)
Number of households with income $125k - 150k:
Del Mar:
4.7% (72)
California:
7.8% (499,671)
Number of households with income $150k - 200k:
Del Mar:
16.7% (257)
State:
11.4% (729,603)
Number of households with income > $200k:
Del Mar:
44.0% (676)
State:
21.2% (1,364,246)
Aggregate household income in Del Mar in 2022: $445,758,082
Median family income in Del Mar in 2022:
Del Mar:
$256,434
State:
$125,379
Number of families with income < $10k:
Del Mar:
0.5% (5)
State:
2.2% (87,079)
Number of families with income $10k - 20k:
Del Mar:
1.1% (11)
California:
2.5% (97,716)
Number of families with income $30k - 40k:
Del Mar:
1.2% (11)
California:
3.9% (152,947)
Number of families with income $40k - 50k:
Del Mar:
3.9% (36)
State:
4.3% (169,197)
Number of families with income $50k - 60k:
Del Mar:
0.6% (6)
State:
4.5% (176,192)
Number of families with income $60k - 75k:
Del Mar:
1.1% (10)
State:
7.0% (274,752)
Number of families with income $75k - 100k:
Del Mar:
4.3% (40)
California:
11.3% (445,632)
Number of families with income $100k - 125k:
Del Mar:
8.4% (80)
State:
10.7% (423,630)
Number of families with income $125k - 150k:
Del Mar:
5.9% (55)
State:
9.1% (357,408)
Number of families with income $150k - 200k:
Del Mar:
17.3% (163)
State:
13.5% (532,693)
Number of families with income > $200k:
Del Mar:
55.8% (526)
California:
27.6% (1,086,948)
Median non-family income in Del Mar in 2022:
Del Mar:
$111,988
California:
$62,819
Change in median non-family income between 2000 and 2022:
Del Mar, California:
+86.3%
State:
+84.4%
Median per capita income in Del Mar in 2022:
Del Mar:
$162,363
State:
$61,706
Income statistics for Black or African American residents
Number of households with income < $10k:
Del Mar:
0.0% (0)
State:
9.0% (73,219)
Number of households with income $10k - 20k:
Del Mar:
0.0% (0)
State:
10.6% (86,666)
Number of households with income $20k - 30k:
Del Mar:
0.0% (0)
California:
7.1% (57,719)
Number of households with income $30k - 40k:
Del Mar:
0.0% (0)
California:
7.2% (58,714)
Number of households with income $40k - 50k:
Del Mar:
0.0% (0)
State:
7.1% (58,075)
Number of households with income $50k - 60k:
Del Mar:
100.0% (22)
California:
6.8% (55,229)
Number of households with income $60k - 75k:
Del Mar:
0.0% (0)
State:
8.8% (71,895)
Number of households with income $75k - 100k:
Del Mar:
0.0% (0)
California:
11.9% (96,893)
Number of households with income $100k - 125k:
Del Mar:
0.0% (0)
State:
8.7% (70,729)
Number of households with income $125k - 150k:
Del Mar:
0.0% (0)
California:
6.3% (51,211)
Number of households with income $150k - 200k:
Del Mar:
0.0% (0)
California:
7.2% (58,687)
Number of households with income > $200k:
Del Mar:
0.0% (0)
California:
9.3% (75,487)
Aggregate household income in Del Mar in 2022: $3,390,209
Median per capita income in Del Mar in 2022:
Del Mar:
$13,879
State:
$36,708
Change in median per capita income between 2000 and 2022:: -79.9%
Del Mar, California:
-79.9%
State:
+110.4%
Income statistics for Asian residents
Median per capita income in Del Mar in 2022:
Del Mar:
$105,695
State:
$58,824
Change in median per capita income between 2000 and 2022:
Del Mar, California:
+137.1%
California:
+166.8%
Income statistics for Hispanic or Latino residents
Number of households with income < $10k:
Del Mar:
0.0% (0)
State:
4.3% (183,294)
Number of households with income $10k - 20k:
Del Mar:
0.0% (0)
State:
6.0% (253,903)
Number of households with income $20k - 30k:
Del Mar:
0.0% (0)
California:
6.8% (286,386)
Number of households with income $30k - 40k:
Del Mar:
0.0% (0)
California:
7.4% (313,728)
Number of households with income $40k - 50k:
Del Mar:
35.9% (37)
State:
7.4% (313,199)
Number of households with income $50k - 60k:
Del Mar:
0.0% (0)
California:
7.2% (305,366)
Number of households with income $60k - 75k:
Del Mar:
0.0% (0)
State:
10.3% (434,937)
Number of households with income $75k - 100k:
Del Mar:
0.0% (0)
State:
14.4% (607,302)
Number of households with income $100k - 125k:
Del Mar:
0.0% (0)
California:
10.6% (447,424)
Number of households with income $125k - 150k:
Del Mar:
0.0% (0)
State:
7.5% (316,022)
Number of households with income $150k - 200k:
Del Mar:
0.0% (0)
State:
9.2% (386,269)
Number of households with income > $200k:
Del Mar:
64.1% (66)
State:
8.8% (372,651)
Aggregate household income in Del Mar in 2022: $26,775,816
Median per capita income in Del Mar in 2022:
Del Mar:
$65,282
California:
$27,240
Change in median per capita income between 2000 and 2022:
Del Mar, California:
+144.7%
California:
+133.3%
Income statistics for Multirace residents
Median household income in Del Mar, CA in 2022:
Del Mar:
$244,044
California:
$83,153
Number of households with income < $10k:
Del Mar:
0.0% (0)
California:
4.2% (85,299)
Number of households with income $10k - 20k:
Del Mar:
0.0% (0)
State:
6.1% (122,966)
Number of households with income $20k - 30k:
Del Mar:
0.0% (0)
State:
6.4% (129,328)
Number of households with income $30k - 40k:
Del Mar:
0.0% (0)
California:
6.4% (130,070)
Number of households with income $40k - 50k:
Del Mar:
0.0% (0)
California:
6.5% (131,254)
Number of households with income $50k - 60k:
Del Mar:
0.0% (0)
State:
6.5% (132,382)
Number of households with income $60k - 75k:
Del Mar:
0.0% (0)
State:
9.4% (191,472)
Number of households with income $75k - 100k:
Del Mar:
9.8% (15)
State:
13.3% (269,691)
Number of households with income $100k - 125k:
Del Mar:
0.0% (0)
State:
10.2% (207,286)
Number of households with income $125k - 150k:
Del Mar:
0.0% (0)
State:
7.8% (158,259)
Number of households with income $150k - 200k:
Del Mar:
5.2% (8)
California:
10.3% (209,227)
Number of households with income > $200k:
Del Mar:
85.0% (130)
California:
13.0% (263,210)
Aggregate household income in Del Mar in 2022: $56,898,071
Median family income in Del Mar in 2022:
Del Mar:
$240,148
California:
$87,642
Number of families with income $150k - 200k:
Del Mar:
6.5% (9)
State:
10.9% (161,643)
Number of families with income > $200k:
Del Mar:
93.5% (124)
State:
14.0% (207,317)
Median per capita income in Del Mar in 2022:
Del Mar:
$85,238
State:
$32,124
Income statistics for other residents
Median per capita income in Del Mar in 2022:
Del Mar:
$122,184
State:
$25,164
Discuss Del Mar, California (CA) on our hugely popular California forum.