The median household income in Dell City, TX in 2022 was $37,333, which was 93.6% less than the median annual income of $72,284 across the entire state of Texas. Compared to the median income of $19,602 in 2000 this represents an increase of 47.5%. The per capita income in 2022 was $22,491, which means an increase of 57.4% compared to 2000 when it was $9,580.
Whole page based on the data from 2000 / 2022 when the population of Dell City, Texas was 413 / 84
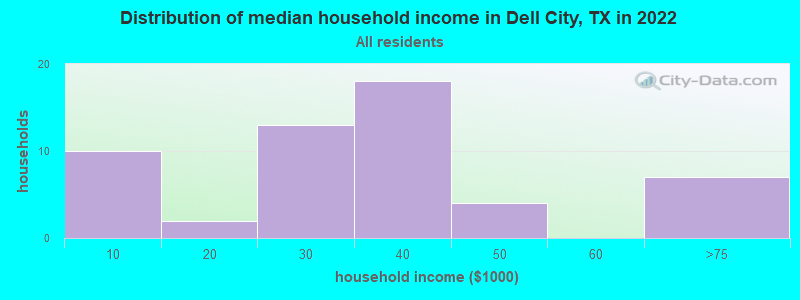
Income statistics for all residents
Median household income in Dell City, TX in 2022:
Dell City:
$37,333
Texas:
$72,284
Change in median household income between 2000 and 2022:
Dell City, Texas:
+90.5%
Texas:
+81.0%
Number of households with income < $10k:
Dell City:
18.5% (10)
State:
5.5% (611,011)
Number of households with income $10k - 20k:
Dell City:
3.7% (2)
State:
6.7% (743,157)
Number of households with income $20k - 30k:
Dell City:
24.1% (13)
State:
7.2% (803,381)
Number of households with income $30k - 40k:
Dell City:
33.3% (18)
State:
7.8% (866,080)
Number of households with income $40k - 50k:
Dell City:
7.4% (4)
State:
7.3% (810,440)
Number of households with income $50k - 60k:
Dell City:
0.0% (0)
State:
7.2% (799,783)
Number of households with income $60k - 75k:
Dell City:
13.0% (7)
State:
9.9% (1,095,384)
Number of households with income $75k - 100k:
Dell City:
0.0% (0)
State:
12.8% (1,419,057)
Number of households with income $100k - 125k:
Dell City:
0.0% (0)
State:
9.5% (1,054,577)
Number of households with income $125k - 150k:
Dell City:
0.0% (0)
State:
6.7% (741,518)
Number of households with income $150k - 200k:
Dell City:
0.0% (0)
State:
8.7% (961,776)
Number of households with income > $200k:
Dell City:
0.0% (0)
Texas:
10.7% (1,181,544)
Aggregate household income in Dell City in 2022: $1,713,673
Median family income in Dell City in 2022:
Dell City:
$38,236
Texas:
$86,267
Number of families with income $20k - 30k:
Dell City:
17.3% (5)
Texas:
5.8% (430,949)
Number of families with income $30k - 40k:
Dell City:
60.2% (17)
State:
6.6% (493,535)
Number of families with income $60k - 75k:
Dell City:
22.5% (6)
Texas:
9.5% (710,229)
Median income for 2 person families:
Dell City:
$37,870
State:
$76,712
Median income for families with 0 earners:
Dell City:
$0
State:
$41,529
Median income for families with 1 earner:
Dell City:
$38,568
State:
$59,030
Median income for families with 2 earners:
Dell City:
$0
State:
$111,348
Median income for families with 3+ earners:
Dell City:
$0
Texas:
$132,976
Median per capita income in Dell City in 2022:
Dell City:
$22,491
State:
$38,123
Change in median per capita income between 2000 and 2022:
Dell City, Texas:
+134.8%
State:
+94.3%
Income statistics for White residents
Median household income in Dell City, TX in 2022:
Dell City:
$40,160
State:
$82,032
Change in median household income between 2000 and 2022:
Dell City, Texas:
+67.1%
State:
+91.0%
Number of households with income < $10k:
Dell City:
0.0% (0)
State:
4.7% (273,716)
Number of households with income $10k - 20k:
Dell City:
10.5% (2)
Texas:
5.5% (322,702)
Number of households with income $20k - 30k:
Dell City:
0.0% (0)
Texas:
6.2% (363,947)
Number of households with income $30k - 40k:
Dell City:
57.9% (11)
State:
6.8% (399,275)
Number of households with income $40k - 50k:
Dell City:
15.8% (3)
Texas:
6.5% (383,417)
Number of households with income $50k - 60k:
Dell City:
0.0% (0)
State:
6.6% (388,535)
Number of households with income $60k - 75k:
Dell City:
15.8% (3)
State:
9.7% (566,295)
Number of households with income $75k - 100k:
Dell City:
0.0% (0)
Texas:
13.0% (760,276)
Number of households with income $100k - 125k:
Dell City:
0.0% (0)
State:
10.2% (597,596)
Number of households with income $125k - 150k:
Dell City:
0.0% (0)
State:
7.4% (436,830)
Number of households with income $150k - 200k:
Dell City:
0.0% (0)
State:
9.9% (583,067)
Number of households with income > $200k:
Dell City:
0.0% (0)
State:
13.5% (792,647)
Aggregate household income in Dell City in 2022: $842,490
Median per capita income in Dell City in 2022:
Dell City:
$29,662
State:
$47,740
Income statistics for Hispanic or Latino residents
Number of households with income < $10k:
Dell City:
22.7% (10)
State:
5.8% (213,953)
Number of households with income $10k - 20k:
Dell City:
0.0% (0)
State:
8.0% (297,456)
Number of households with income $20k - 30k:
Dell City:
29.5% (13)
State:
9.2% (340,166)
Number of households with income $30k - 40k:
Dell City:
40.9% (18)
State:
9.5% (354,336)
Number of households with income $40k - 50k:
Dell City:
0.0% (0)
State:
8.8% (327,013)
Number of households with income $50k - 60k:
Dell City:
0.0% (0)
State:
8.3% (308,818)
Number of households with income $60k - 75k:
Dell City:
6.8% (3)
Texas:
10.9% (405,109)
Number of households with income $75k - 100k:
Dell City:
0.0% (0)
State:
13.8% (511,639)
Number of households with income $100k - 125k:
Dell City:
0.0% (0)
State:
8.6% (319,728)
Number of households with income $125k - 150k:
Dell City:
0.0% (0)
State:
5.7% (210,932)
Number of households with income $150k - 200k:
Dell City:
0.0% (0)
State:
6.4% (236,055)
Number of households with income > $200k:
Dell City:
0.0% (0)
State:
5.1% (189,259)
Aggregate household income in Dell City in 2022: $1,331,719
Median family income in Dell City in 2022:
Dell City:
$38,708
Texas:
$65,080
Number of families with income $20k - 30k:
Dell City:
19.8% (5)
Texas:
8.6% (238,528)
Number of families with income $30k - 40k:
Dell City:
67.4% (17)
Texas:
9.1% (251,999)
Number of families with income $60k - 75k:
Dell City:
12.8% (3)
Texas:
10.9% (302,688)
Median per capita income in Dell City in 2022:
Dell City:
$20,836
State:
$24,862
Income statistics for Multirace residents
Number of households with income < $10k:
Dell City:
36.6% (15)
Texas:
5.5% (122,324)
Number of households with income $10k - 20k:
Dell City:
0.0% (0)
State:
8.2% (182,232)
Number of households with income $20k - 30k:
Dell City:
34.1% (14)
Texas:
8.5% (189,456)
Number of households with income $30k - 40k:
Dell City:
17.1% (7)
Texas:
8.9% (197,499)
Number of households with income $40k - 50k:
Dell City:
0.0% (0)
State:
8.7% (191,735)
Number of households with income $50k - 60k:
Dell City:
0.0% (0)
State:
8.0% (177,535)
Number of households with income $60k - 75k:
Dell City:
12.2% (5)
State:
10.5% (232,479)
Number of households with income $75k - 100k:
Dell City:
0.0% (0)
State:
13.1% (290,448)
Number of households with income $100k - 125k:
Dell City:
0.0% (0)
State:
8.6% (191,595)
Number of households with income $125k - 150k:
Dell City:
0.0% (0)
State:
6.0% (133,361)
Number of households with income $150k - 200k:
Dell City:
0.0% (0)
State:
7.2% (159,195)
Number of households with income > $200k:
Dell City:
0.0% (0)
State:
6.7% (148,064)
Aggregate household income in Dell City in 2022: $1,015,602
Median per capita income in Dell City in 2022:
Dell City:
$19,337
State:
$26,785
Discuss Dell City, Texas (TX) on our hugely popular Texas forum.