East Chester, Tennessee (TN) income map, earnings map, and wages data
The median household income in East Chester, TN in 2022 was $59,560, which was 9.6% less than the median annual income of $65,254 across the entire state of Tennessee. Compared to the median income of $33,250 in 2000 this represents an increase of 44.2%. The per capita income in 2022 was $28,382, which means an increase of 47.0% compared to 2000 when it was $15,048.
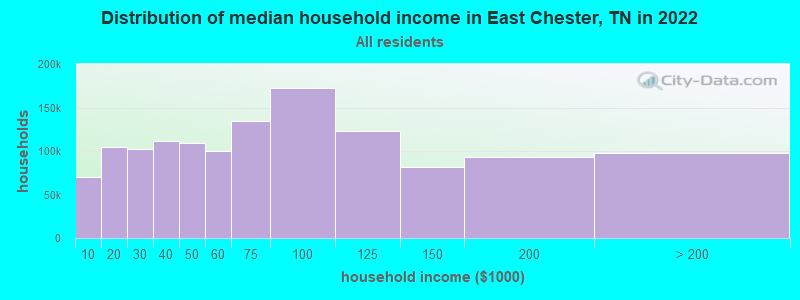
Income statistics for all residents
Median household income in East Chester, TN in 2022:| East Chester: | $59,560 |
| Tennessee: | $65,254 |
Change in median household income between 2000 and 2022:| East Chester, Tennessee: | +79.1% |
| State: | +79.5% |
Number of households with income < $10k:| East Chester: | 5.4% (70,676) |
| State: | 5.4% (154,793) |
Number of households with income $10k - 20k:| East Chester: | 8.0% (104,527) |
| Tennessee: | 8.0% (228,599) |
Number of households with income $20k - 30k:| East Chester: | 7.9% (102,794) |
| Tennessee: | 7.9% (224,908) |
Number of households with income $30k - 40k:| East Chester: | 8.6% (111,579) |
| Tennessee: | 8.6% (244,297) |
Number of households with income $40k - 50k:| East Chester: | 8.4% (109,122) |
| State: | 8.4% (238,949) |
Number of households with income $50k - 60k:| East Chester: | 7.7% (99,769) |
| State: | 7.7% (218,438) |
Number of households with income $60k - 75k:| East Chester: | 10.3% (134,378) |
| Tennessee: | 10.3% (294,172) |
Number of households with income $75k - 100k:| East Chester: | 13.3% (172,343) |
| State: | 13.3% (377,310) |
Number of households with income $100k - 125k:| East Chester: | 9.5% (122,994) |
| Tennessee: | 9.5% (269,124) |
Number of households with income $125k - 150k:| East Chester: | 6.3% (81,403) |
| State: | 6.3% (178,328) |
Number of households with income $150k - 200k:| East Chester: | 7.2% (93,095) |
| Tennessee: | 7.2% (204,030) |
Number of households with income > $200k:| East Chester: | 7.5% (97,335) |
| State: | 7.5% (213,736) |
Aggregate household income in East Chester in 2022: $4,451,663,124
Median family income in East Chester in 2022:| East Chester: | $68,886 |
| State: | $80,910 |
Median non-family income in East Chester in 2022:| East Chester: | $24,815 |
| State: | $40,285 |
Change in median non-family income between 2000 and 2022:| East Chester, Tennessee: | +91.6% |
| State: | +91.5% |
Median per capita income in East Chester in 2022:| East Chester: | $28,382 |
| State: | $36,704 |
Change in median per capita income between 2000 and 2022:| East Chester, Tennessee: | +88.6% |
| State: | +89.3% |
Income statistics for White residents
Median household income in East Chester, TN in 2022:| East Chester: | $62,623 |
| State: | $69,826 |
Change in median household income between 2000 and 2022:| East Chester, Tennessee: | +80.8% |
| Tennessee: | +82.9% |
Number of households with income < $10k:| East Chester: | 4.7% (45,559) |
| State: | 4.6% (100,279) |
Number of households with income $10k - 20k:| East Chester: | 7.7% (75,098) |
| State: | 7.6% (165,031) |
Number of households with income $20k - 30k:| East Chester: | 7.5% (72,886) |
| State: | 7.4% (160,229) |
Number of households with income $30k - 40k:| East Chester: | 8.1% (79,083) |
| State: | 8.1% (174,784) |
Number of households with income $40k - 50k:| East Chester: | 7.9% (76,847) |
| State: | 7.8% (169,622) |
Number of households with income $50k - 60k:| East Chester: | 7.7% (74,801) |
| State: | 7.6% (165,508) |
Number of households with income $60k - 75k:| East Chester: | 10.4% (101,348) |
| State: | 10.3% (223,937) |
Number of households with income $75k - 100k:| East Chester: | 13.5% (132,145) |
| State: | 13.5% (292,688) |
Number of households with income $100k - 125k:| East Chester: | 10.1% (98,988) |
| State: | 10.1% (219,251) |
Number of households with income $125k - 150k:| East Chester: | 6.6% (64,143) |
| State: | 6.6% (142,574) |
Number of households with income $150k - 200k:| East Chester: | 7.6% (74,526) |
| State: | 7.7% (166,039) |
Number of households with income > $200k:| East Chester: | 8.4% (82,127) |
| State: | 8.5% (184,546) |
Aggregate household income in East Chester in 2022: $3,367,155,937
Median family income in East Chester in 2022:| East Chester: | $71,386 |
| Tennessee: | $86,015 |
Number of families with income < $10k:| East Chester: | 5.6% (64) |
| Tennessee: | 3.1% (43,751) |
Number of families with income $10k - 20k:| East Chester: | 5.6% (63) |
| State: | 3.5% (49,925) |
Number of families with income $20k - 30k:| East Chester: | 7.2% (81) |
| Tennessee: | 5.0% (70,431) |
Number of families with income $30k - 40k:| East Chester: | 12.3% (138) |
| State: | 6.6% (93,498) |
Number of families with income $40k - 50k:| East Chester: | 10.1% (114) |
| Tennessee: | 6.8% (96,726) |
Number of families with income $50k - 60k:| East Chester: | 7.9% (89) |
| State: | 7.2% (101,879) |
Number of families with income $60k - 75k:| East Chester: | 13.0% (146) |
| State: | 10.7% (151,997) |
Number of families with income $75k - 100k:| East Chester: | 23.2% (262) |
| State: | 15.4% (218,373) |
Number of families with income $100k - 125k:| East Chester: | 14.7% (166) |
| State: | 12.6% (178,761) |
Number of families with income $125k - 150k:| East Chester: | 0.4% (4) |
| State: | 8.2% (116,575) |
Median non-family income in East Chester in 2022:| East Chester: | $25,704 |
| State: | $41,178 |
Change in median non-family income between 2000 and 2022:| East Chester, Tennessee: | +91.1% |
| State: | +91.1% |
Median per capita income in East Chester in 2022:| East Chester: | $30,100 |
| Tennessee: | $40,126 |
Change in median per capita income between 2000 and 2022:| East Chester, Tennessee: | +91.8% |
| State: | +92.6% |
Income statistics for Black or African American residents
Median household income in East Chester, TN in 2022:| East Chester: | $51,008 |
| State: | $49,531 |
Change in median household income between 2000 and 2022:| East Chester, Tennessee: | +98.7% |
| State: | +82.3% |
Number of households with income < $10k:| East Chester: | 9.1% (18,917) |
| State: | 9.1% (39,909) |
Number of households with income $10k - 20k:| East Chester: | 10.5% (21,882) |
| State: | 10.5% (46,276) |
Number of households with income $20k - 30k:| East Chester: | 10.2% (21,344) |
| State: | 10.2% (45,072) |
Number of households with income $30k - 40k:| East Chester: | 10.0% (20,750) |
| Tennessee: | 10.0% (43,885) |
Number of households with income $40k - 50k:| East Chester: | 10.7% (22,392) |
| Tennessee: | 10.7% (47,267) |
Number of households with income $50k - 60k:| East Chester: | 7.7% (16,026) |
| State: | 7.7% (33,868) |
Number of households with income $60k - 75k:| East Chester: | 10.5% (21,886) |
| State: | 10.5% (46,247) |
Number of households with income $75k - 100k:| East Chester: | 12.6% (26,224) |
| State: | 12.6% (55,465) |
Number of households with income $100k - 125k:| East Chester: | 6.7% (13,935) |
| State: | 6.7% (29,515) |
Number of households with income $125k - 150k:| East Chester: | 4.8% (10,070) |
| State: | 4.8% (21,306) |
Number of households with income $150k - 200k:| East Chester: | 4.6% (9,622) |
| Tennessee: | 4.6% (20,425) |
Number of households with income > $200k:| East Chester: | 2.5% (5,270) |
| State: | 2.5% (11,183) |
Aggregate household income in East Chester in 2022: $28,764,573
Median family income in East Chester in 2022:| East Chester: | $54,313 |
| State: | $61,153 |
Number of families with income < $10k:| East Chester: | 13.6% (9) |
| State: | 7.9% (20,476) |
Number of families with income $10k - 20k:| East Chester: | 13.9% (9) |
| State: | 6.0% (15,530) |
Number of families with income $20k - 30k:| East Chester: | 10.9% (7) |
| State: | 8.6% (22,263) |
Number of families with income $30k - 40k:| East Chester: | 10.5% (7) |
| Tennessee: | 9.3% (24,089) |
Number of families with income $40k - 50k:| East Chester: | 10.5% (7) |
| Tennessee: | 10.2% (26,463) |
Number of families with income $50k - 60k:| East Chester: | 26.3% (17) |
| Tennessee: | 6.9% (17,798) |
Number of families with income $75k - 100k:| East Chester: | 14.3% (9) |
| Tennessee: | 14.7% (38,065) |
Median non-family income in East Chester in 2022:| East Chester: | $24,668 |
| State: | $35,793 |
Change in median non-family income between 2000 and 2022:| East Chester, Tennessee: | +121.7% |
| Tennessee: | +104.3% |
Median per capita income in East Chester in 2022:| East Chester: | $19,871 |
| State: | $27,306 |
Change in median per capita income between 2000 and 2022:| East Chester, Tennessee: | +112.3% |
| Tennessee: | +105.3% |
Income statistics for Multirace residents
Median household income in East Chester, TN in 2022:| East Chester: | $13,530 |
| State: | $57,741 |
Change in median household income between 2000 and 2022:| East Chester, Tennessee: | +86.6% |
| State: | +87.1% |
Number of households with income < $10k:| East Chester: | 6.7% (1,159) |
| Tennessee: | 6.7% (9,867) |
Number of households with income $10k - 20k:| East Chester: | 8.6% (1,482) |
| State: | 8.6% (12,639) |
Number of households with income $20k - 30k:| East Chester: | 9.2% (1,586) |
| State: | 9.2% (13,555) |
Number of households with income $30k - 40k:| East Chester: | 10.3% (1,777) |
| State: | 10.3% (15,117) |
Number of households with income $40k - 50k:| East Chester: | 9.4% (1,622) |
| Tennessee: | 9.4% (13,829) |
Number of households with income $50k - 60k:| East Chester: | 7.5% (1,287) |
| State: | 7.5% (10,969) |
Number of households with income $60k - 75k:| East Chester: | 9.2% (1,587) |
| Tennessee: | 9.2% (13,568) |
Number of households with income $75k - 100k:| East Chester: | 12.6% (2,177) |
| Tennessee: | 12.6% (18,516) |
Number of households with income $100k - 125k:| East Chester: | 8.6% (1,489) |
| Tennessee: | 8.6% (12,656) |
Number of households with income $125k - 150k:| East Chester: | 5.9% (1,018) |
| State: | 5.9% (8,674) |
Number of households with income $150k - 200k:| East Chester: | 7.2% (1,239) |
| Tennessee: | 7.2% (10,611) |
Number of households with income > $200k:| East Chester: | 4.7% (815) |
| Tennessee: | 4.8% (6,986) |
Aggregate household income in East Chester in 2022: $5,985,535
Median family income in East Chester in 2022:| East Chester: | $16,855 |
| State: | $70,058 |
Median non-family income in East Chester in 2022:| East Chester: | $13,762 |
| Tennessee: | $39,395 |
Change in median non-family income between 2000 and 2022:| East Chester, Tennessee: | +111.7% |
| State: | +99.1% |
Median per capita income in East Chester in 2022:| East Chester: | $14,541 |
| State: | $24,436 |
Change in median per capita income between 2000 and 2022:| East Chester, Tennessee: | +82.5% |
| State: | +84.3% |