Foster, Kentucky (KY) income map, earnings map, and wages data
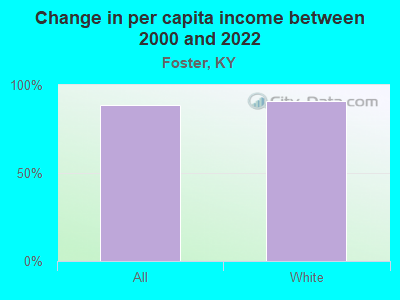
The median household income in Foster, KY in 2022 was $59,554, which was about the same as the median annual income of $59,341 across the entire state of Kentucky. Compared to the median income of $33,750 in 2000 this represents an increase of 43.3%. The per capita income in 2022 was $31,679, which means an increase of 47.0% compared to 2000 when it was $16,798.
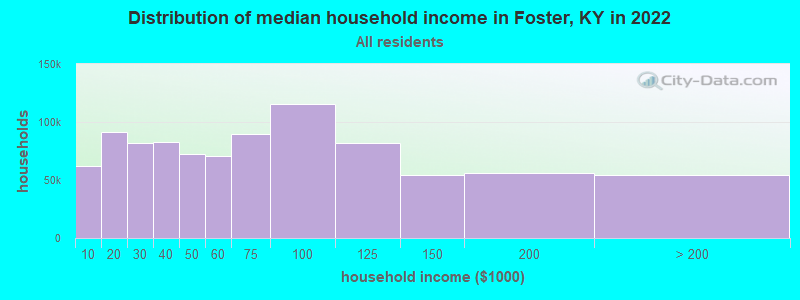
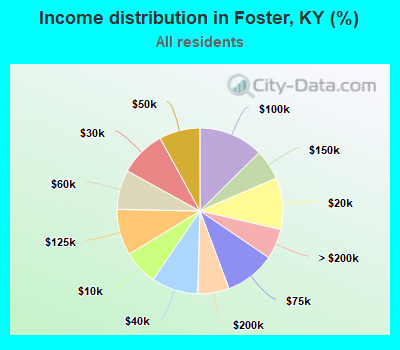
Income statistics for all residents
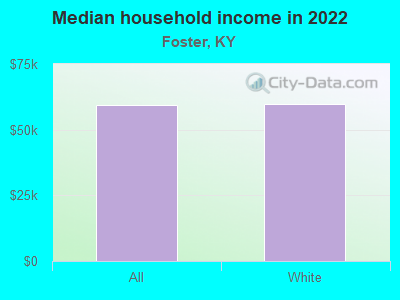
Median household income in Foster, KY in 2022:| Foster: | $59,554 |
| State: | $59,341 |
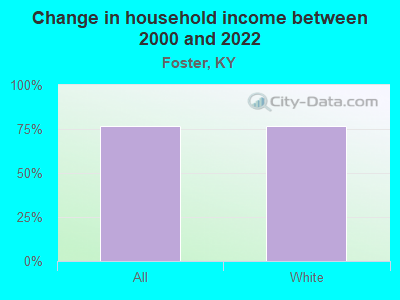
Change in median household income between 2000 and 2022:| Foster, Kentucky: | +76.5% |
| State: | +76.2% |
Number of households with income < $10k:| Foster: | 6.8% (61,713) |
| Kentucky: | 6.8% (123,697) |
Number of households with income $10k - 20k:| Foster: | 10.0% (91,667) |
| State: | 10.0% (182,645) |
Number of households with income $20k - 30k:| Foster: | 9.0% (82,017) |
| State: | 9.0% (164,092) |
Number of households with income $30k - 40k:| Foster: | 9.1% (83,031) |
| Kentucky: | 9.1% (165,607) |
Number of households with income $40k - 50k:| Foster: | 8.0% (72,712) |
| State: | 8.0% (146,315) |
Number of households with income $50k - 60k:| Foster: | 7.7% (70,476) |
| Kentucky: | 7.7% (140,671) |
Number of households with income $60k - 75k:| Foster: | 9.8% (89,578) |
| State: | 9.8% (180,002) |
Number of households with income $75k - 100k:| Foster: | 12.6% (115,136) |
| State: | 12.6% (230,239) |
Number of households with income $100k - 125k:| Foster: | 9.0% (82,215) |
| Kentucky: | 9.0% (164,398) |
Number of households with income $125k - 150k:| Foster: | 5.9% (54,069) |
| Kentucky: | 5.9% (108,602) |
Number of households with income $150k - 200k:| Foster: | 6.1% (56,014) |
| State: | 6.2% (112,813) |
Number of households with income > $200k:| Foster: | 5.9% (54,067) |
| State: | 6.0% (109,599) |
Aggregate household income in Foster in 2022: $1,099,181,412
Median family income in Foster in 2022:| Foster: | $80,045 |
| State: | $76,119 |
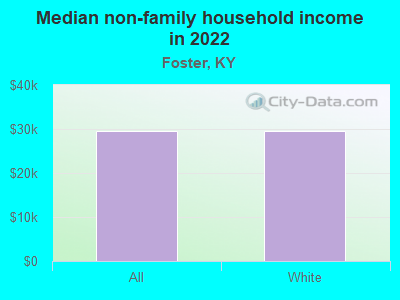
Median non-family income in Foster in 2022:| Foster: | $29,655 |
| Kentucky: | $33,993 |
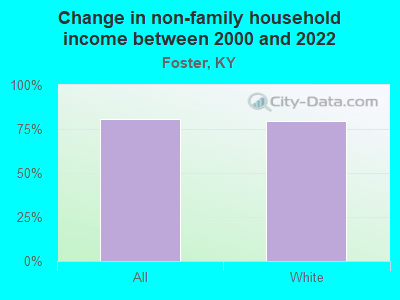
Change in median non-family income between 2000 and 2022:| Foster, Kentucky: | +80.5% |
| State: | +79.2% |
Median per capita income in Foster in 2022:| Foster: | $31,679 |
| State: | $33,980 |
Change in median per capita income between 2000 and 2022:| Foster, Kentucky: | +88.6% |
| State: | +87.8% |
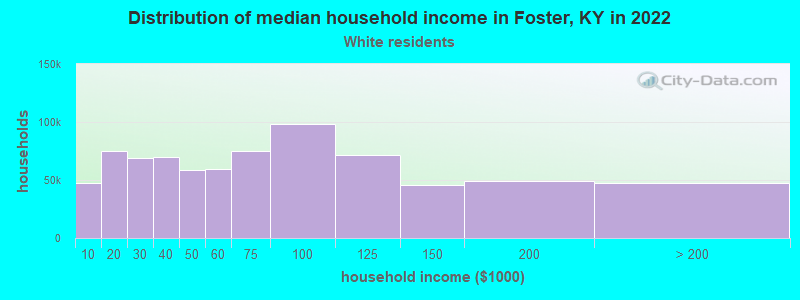
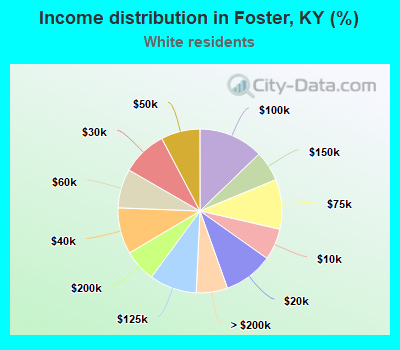
Income statistics for White residents
Median household income in Foster, KY in 2022:| Foster: | $59,618 |
| Kentucky: | $60,987 |
Change in median household income between 2000 and 2022:| Foster, Kentucky: | +76.6% |
| State: | +76.2% |
Number of households with income < $10k:| Foster: | 6.2% (47,613) |
| State: | 6.2% (96,690) |
Number of households with income $10k - 20k:| Foster: | 9.8% (74,775) |
| Kentucky: | 9.7% (151,125) |
Number of households with income $20k - 30k:| Foster: | 9.0% (68,630) |
| State: | 8.9% (139,532) |
Number of households with income $30k - 40k:| Foster: | 9.1% (70,068) |
| State: | 9.1% (142,284) |
Number of households with income $40k - 50k:| Foster: | 7.7% (59,044) |
| State: | 7.7% (121,151) |
Number of households with income $50k - 60k:| Foster: | 7.7% (59,058) |
| State: | 7.7% (119,790) |
Number of households with income $60k - 75k:| Foster: | 9.8% (75,193) |
| Kentucky: | 9.9% (154,174) |
Number of households with income $75k - 100k:| Foster: | 12.8% (97,977) |
| State: | 12.8% (199,740) |
Number of households with income $100k - 125k:| Foster: | 9.4% (71,633) |
| Kentucky: | 9.4% (146,284) |
Number of households with income $125k - 150k:| Foster: | 6.0% (45,902) |
| State: | 6.0% (94,180) |
Number of households with income $150k - 200k:| Foster: | 6.4% (48,865) |
| State: | 6.4% (100,702) |
Number of households with income > $200k:| Foster: | 6.2% (47,292) |
| Kentucky: | 6.3% (98,502) |
Aggregate household income in Foster in 2022: $957,325,575
Median family income in Foster in 2022:| Foster: | $81,171 |
| State: | $78,353 |
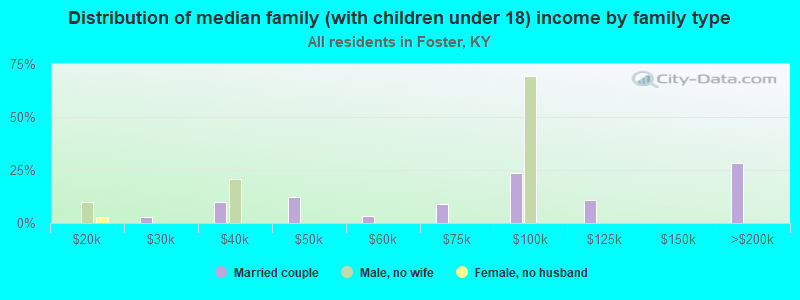
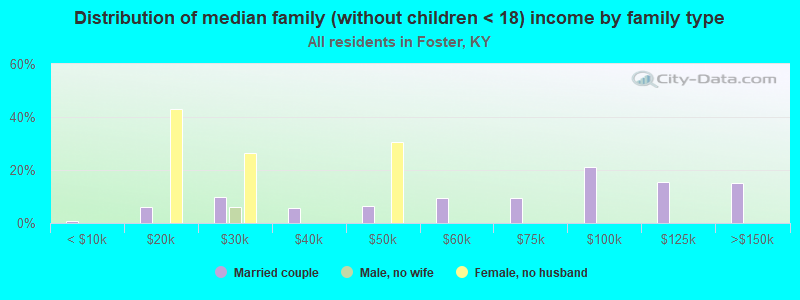
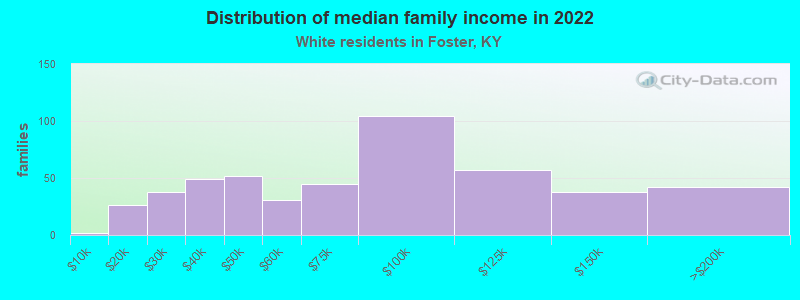
Number of families with income < $10k:| Foster: | 0.4% (2) |
| Kentucky: | 3.7% (37,075) |
Number of families with income $10k - 20k:| Foster: | 5.4% (26) |
| State: | 4.9% (49,864) |
Number of families with income $20k - 30k:| Foster: | 7.9% (38) |
| Kentucky: | 6.4% (64,043) |
Number of families with income $30k - 40k:| Foster: | 10.0% (49) |
| State: | 8.0% (81,080) |
Number of families with income $40k - 50k:| Foster: | 10.8% (52) |
| Kentucky: | 6.9% (69,099) |
Number of families with income $50k - 60k:| Foster: | 6.4% (31) |
| State: | 7.2% (72,955) |
Number of families with income $60k - 75k:| Foster: | 9.3% (45) |
| State: | 10.4% (104,587) |
Number of families with income $75k - 100k:| Foster: | 21.4% (104) |
| State: | 15.0% (151,545) |
Number of families with income $100k - 125k:| Foster: | 11.8% (57) |
| State: | 11.9% (120,340) |
Number of families with income $125k - 150k:| Foster: | 7.9% (38) |
| Kentucky: | 8.1% (81,620) |
Number of families with income $150k - 200k:| Foster: | 8.8% (42) |
| State: | 8.8% (89,097) |
Median non-family income in Foster in 2022:| Foster: | $29,517 |
| Kentucky: | $34,415 |
Change in median non-family income between 2000 and 2022:| Foster, Kentucky: | +79.7% |
| State: | +78.3% |
Median per capita income in Foster in 2022:| Foster: | $32,065 |
| Kentucky: | $35,352 |
Change in median per capita income between 2000 and 2022:| Foster, Kentucky: | +90.9% |
| State: | +90.2% |