The median household income in Genoa, IL in 2022 was $80,376, which was 4.6% greater than the median annual income of $76,708 across the entire state of Illinois. Compared to the median income of $48,125 in 2000 this represents an increase of 40.1%. The per capita income in 2022 was $35,783, which means an increase of 46.2% compared to 2000 when it was $19,239.
Whole page based on the data from 2000 / 2022 when the population of Genoa, Illinois was 4,169 / 5,021
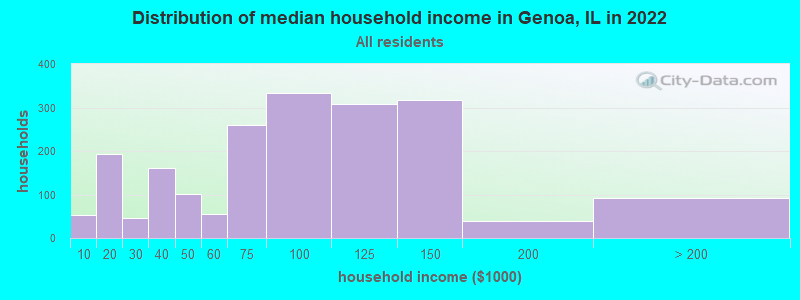
Income statistics for all residents
Median household income in Genoa, IL in 2022:
Genoa:
$80,376
State:
$76,708
Change in median household income between 2000 and 2022:
Genoa, Illinois:
+67.0%
Illinois:
+64.6%
Number of households with income < $10k:
Genoa:
2.7% (53)
State:
5.9% (296,090)
Number of households with income $10k - 20k:
Genoa:
9.9% (193)
State:
6.6% (333,259)
Number of households with income $20k - 30k:
Genoa:
2.3% (45)
State:
6.8% (342,921)
Number of households with income $30k - 40k:
Genoa:
8.2% (161)
State:
7.0% (355,254)
Number of households with income $40k - 50k:
Genoa:
5.2% (102)
State:
6.7% (340,678)
Number of households with income $50k - 60k:
Genoa:
2.8% (55)
State:
6.7% (339,405)
Number of households with income $60k - 75k:
Genoa:
13.3% (260)
State:
9.2% (465,709)
Number of households with income $75k - 100k:
Genoa:
17.0% (333)
State:
12.9% (651,353)
Number of households with income $100k - 125k:
Genoa:
15.7% (308)
State:
10.3% (522,359)
Number of households with income $125k - 150k:
Genoa:
16.2% (318)
State:
7.3% (367,136)
Number of households with income $150k - 200k:
Genoa:
2.0% (40)
State:
9.0% (455,249)
Number of households with income > $200k:
Genoa:
4.6% (91)
State:
11.6% (586,947)
Aggregate household income in Genoa in 2022: $170,627,891
Median family income in Genoa in 2022:
Genoa:
$92,288
Illinois:
$96,948
Number of families with income < $10k:
Genoa:
2.1% (31)
State:
3.4% (105,875)
Number of families with income $20k - 30k:
Genoa:
7.7% (114)
Illinois:
4.7% (146,403)
Number of families with income $30k - 40k:
Genoa:
4.8% (71)
State:
5.3% (167,069)
Number of families with income $40k - 50k:
Genoa:
2.6% (39)
State:
5.8% (181,164)
Number of families with income $50k - 60k:
Genoa:
4.3% (64)
State:
6.1% (191,561)
Number of families with income $60k - 75k:
Genoa:
12.1% (180)
Illinois:
9.0% (282,985)
Number of families with income $75k - 100k:
Genoa:
17.3% (258)
Illinois:
13.8% (432,725)
Number of families with income $100k - 125k:
Genoa:
17.2% (256)
State:
11.9% (373,296)
Number of families with income $125k - 150k:
Genoa:
22.9% (341)
State:
8.9% (279,791)
Number of families with income $150k - 200k:
Genoa:
2.7% (40)
Illinois:
11.9% (372,004)
Number of families with income > $200k:
Genoa:
6.5% (96)
State:
15.9% (500,033)
Median non-family income in Genoa in 2022:
Genoa:
$37,079
State:
$46,533
Change in median non-family income between 2000 and 2022:
Genoa, Illinois:
+54.3%
State:
+64.0%
Median per capita income in Genoa in 2022:
Genoa:
$35,783
Illinois:
$43,317
Change in median per capita income between 2000 and 2022:
Genoa, Illinois:
+86.0%
State:
+87.5%
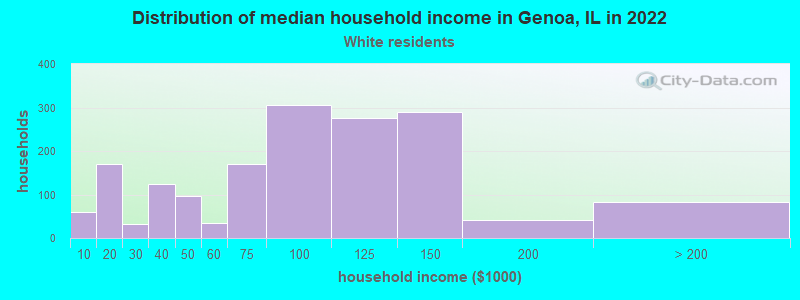
Income statistics for White residents
Median household income in Genoa, IL in 2022:
Genoa:
$81,746
State:
$83,346
Change in median household income between 2000 and 2022:
Genoa, Illinois:
+71.4%
State:
+67.5%
Number of households with income < $10k:
Genoa:
3.5% (59)
State:
4.5% (149,895)
Number of households with income $10k - 20k:
Genoa:
10.1% (171)
Illinois:
5.5% (184,529)
Number of households with income $20k - 30k:
Genoa:
2.0% (33)
Illinois:
6.1% (205,767)
Number of households with income $30k - 40k:
Genoa:
7.4% (125)
Illinois:
6.7% (225,572)
Number of households with income $40k - 50k:
Genoa:
5.7% (96)
State:
6.5% (216,965)
Number of households with income $50k - 60k:
Genoa:
2.1% (35)
Illinois:
6.6% (222,841)
Number of households with income $60k - 75k:
Genoa:
10.1% (171)
Illinois:
9.3% (312,758)
Number of households with income $75k - 100k:
Genoa:
18.2% (306)
State:
12.9% (433,180)
Number of households with income $100k - 125k:
Genoa:
16.3% (275)
State:
10.7% (360,753)
Number of households with income $125k - 150k:
Genoa:
17.2% (290)
State:
7.9% (266,532)
Number of households with income $150k - 200k:
Genoa:
2.5% (42)
State:
10.0% (337,357)
Number of households with income > $200k:
Genoa:
4.9% (82)
Illinois:
13.3% (446,069)
Aggregate household income in Genoa in 2022: $149,158,242
Median family income in Genoa in 2022:
Genoa:
$112,776
State:
$107,938
Number of families with income < $10k:
Genoa:
2.8% (34)
Illinois:
2.2% (45,983)
Number of families with income $20k - 30k:
Genoa:
7.6% (92)
State:
3.5% (70,927)
Number of families with income $30k - 40k:
Genoa:
2.6% (32)
Illinois:
4.4% (90,563)
Number of families with income $40k - 50k:
Genoa:
2.6% (31)
Illinois:
5.0% (102,597)
Number of families with income $50k - 60k:
Genoa:
4.5% (54)
Illinois:
5.8% (119,129)
Number of families with income $60k - 75k:
Genoa:
8.1% (99)
State:
8.8% (179,665)
Number of families with income $75k - 100k:
Genoa:
18.1% (220)
State:
13.5% (276,887)
Number of families with income $100k - 125k:
Genoa:
17.6% (213)
State:
12.5% (256,099)
Number of families with income $125k - 150k:
Genoa:
25.7% (311)
State:
9.8% (199,855)
Number of families with income $150k - 200k:
Genoa:
3.3% (40)
State:
13.4% (274,569)
Number of families with income > $200k:
Genoa:
7.2% (88)
State:
18.6% (381,354)
Median non-family income in Genoa in 2022:
Genoa:
$36,151
State:
$50,934
Change in median non-family income between 2000 and 2022:
Genoa, Illinois:
+53.5%
State:
+70.7%
Median per capita income in Genoa in 2022:
Genoa:
$37,207
State:
$50,738
Change in median per capita income between 2000 and 2022:
Genoa, Illinois:
+92.7%
Illinois:
+95.5%
Income statistics for Black or African American residents
Median per capita income in Genoa in 2022:
Genoa:
$73,270
Illinois:
$28,045
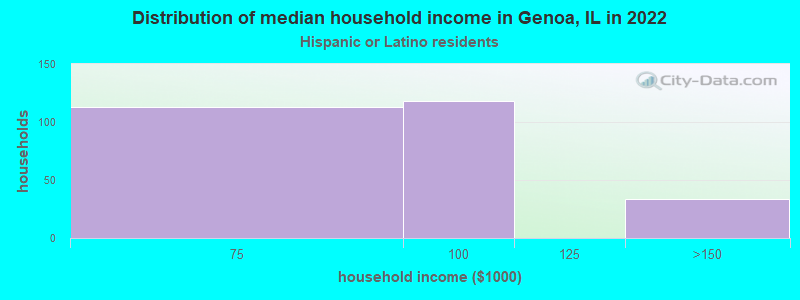
Income statistics for Hispanic or Latino residents
Median household income in Genoa, IL in 2022:
Genoa:
$49,895
State:
$72,139
Change in median household income between 2000 and 2022:
Genoa, Illinois:
+29.6%
Illinois:
+75.7%
Number of households with income < $10k:
Genoa:
0.0% (0)
State:
4.9% (33,145)
Number of households with income $10k - 20k:
Genoa:
0.0% (0)
Illinois:
5.4% (36,345)
Number of households with income $20k - 30k:
Genoa:
0.0% (0)
Illinois:
7.5% (50,677)
Number of households with income $30k - 40k:
Genoa:
0.0% (0)
State:
7.7% (52,008)
Number of households with income $40k - 50k:
Genoa:
0.0% (0)
State:
8.1% (54,702)
Number of households with income $50k - 60k:
Genoa:
0.0% (0)
State:
7.5% (51,062)
Number of households with income $60k - 75k:
Genoa:
42.6% (113)
Illinois:
11.3% (76,576)
Number of households with income $75k - 100k:
Genoa:
44.5% (118)
Illinois:
15.5% (105,152)
Number of households with income $100k - 125k:
Genoa:
0.0% (0)
State:
11.5% (77,760)
Number of households with income $125k - 150k:
Genoa:
12.8% (34)
State:
7.3% (49,310)
Number of households with income $150k - 200k:
Genoa:
0.0% (0)
Illinois:
7.6% (51,233)
Number of households with income > $200k:
Genoa:
0.0% (0)
State:
5.9% (40,028)
Aggregate household income in Genoa in 2022: $18,454,949
Median family income in Genoa in 2022:
Genoa:
$45,837
Illinois:
$76,467
Number of families with income $60k - 75k:
Genoa:
50.5% (113)
Illinois:
11.5% (58,164)
Number of families with income $75k - 100k:
Genoa:
34.7% (77)
State:
16.0% (81,055)
Number of families with income $125k - 150k:
Genoa:
14.9% (33)
State:
8.0% (40,271)
Median per capita income in Genoa in 2022:
Genoa:
$24,769
State:
$26,551
Change in median per capita income between 2000 and 2022:
Genoa, Illinois:
+135.2%
State:
+111.0%
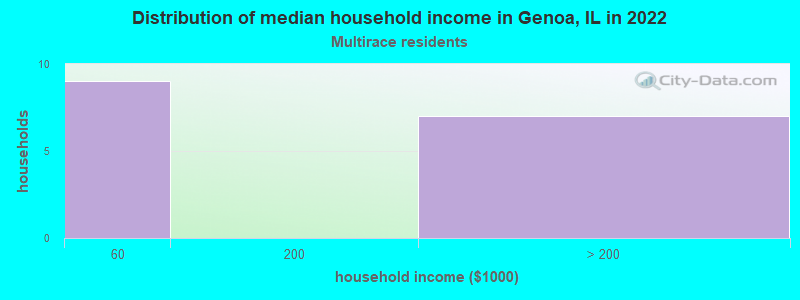
Income statistics for Multirace residents
Number of households with income < $10k:
Genoa:
0.0% (0)
State:
5.3% (21,595)
Number of households with income $10k - 20k:
Genoa:
0.0% (0)
State:
6.5% (26,720)
Number of households with income $20k - 30k:
Genoa:
0.0% (0)
State:
8.0% (32,573)
Number of households with income $30k - 40k:
Genoa:
0.0% (0)
State:
8.4% (34,383)
Number of households with income $40k - 50k:
Genoa:
0.0% (0)
State:
7.4% (30,234)
Number of households with income $50k - 60k:
Genoa:
56.2% (9)
Illinois:
6.9% (28,432)
Number of households with income $60k - 75k:
Genoa:
0.0% (0)
Illinois:
10.2% (41,780)
Number of households with income $75k - 100k:
Genoa:
0.0% (0)
State:
13.0% (53,426)
Number of households with income $100k - 125k:
Genoa:
0.0% (0)
State:
10.5% (43,126)
Number of households with income $125k - 150k:
Genoa:
0.0% (0)
State:
7.6% (31,153)
Number of households with income $150k - 200k:
Genoa:
0.0% (0)
Illinois:
7.6% (30,946)
Number of households with income > $200k:
Genoa:
43.8% (7)
State:
8.6% (35,208)
Aggregate household income in Genoa in 2022: $38,275,291
Median per capita income in Genoa in 2022:
Genoa:
$14,515
State:
$29,285
Change in median per capita income between 2000 and 2022:: -60.7%
Genoa, Illinois:
-60.7%
State:
+112.9%
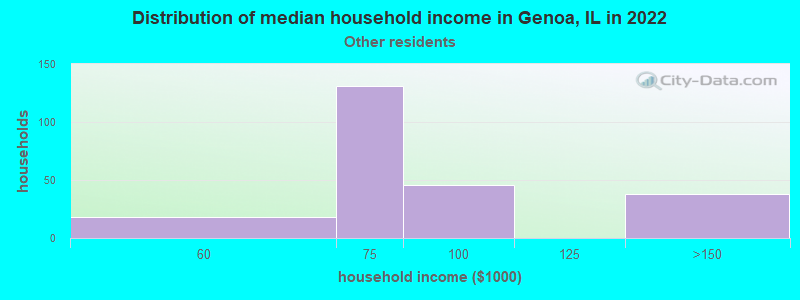
Income statistics for other residents
Median household income in Genoa, IL in 2022:
Genoa:
$77,554
State:
$71,711
Number of households with income < $10k:
Genoa:
0.0% (0)
State:
5.7% (16,383)
Number of households with income $10k - 20k:
Genoa:
0.0% (0)
State:
4.8% (13,886)
Number of households with income $20k - 30k:
Genoa:
0.0% (0)
State:
7.0% (20,054)
Number of households with income $30k - 40k:
Genoa:
0.0% (0)
State:
7.0% (20,038)
Number of households with income $40k - 50k:
Genoa:
0.0% (0)
State:
8.3% (23,759)
Number of households with income $50k - 60k:
Genoa:
7.7% (18)
State:
7.8% (22,410)
Number of households with income $60k - 75k:
Genoa:
56.2% (131)
State:
12.0% (34,448)
Number of households with income $75k - 100k:
Genoa:
19.7% (46)
Illinois:
16.2% (46,508)
Number of households with income $100k - 125k:
Genoa:
0.0% (0)
State:
12.5% (35,952)
Number of households with income $125k - 150k:
Genoa:
16.3% (38)
State:
6.9% (19,732)
Number of households with income $150k - 200k:
Genoa:
0.0% (0)
State:
7.5% (21,422)
Number of households with income > $200k:
Genoa:
0.0% (0)
State:
4.3% (12,194)
Aggregate household income in Genoa in 2022: $10,858,766
Median family income in Genoa in 2022:
Genoa:
$77,310
Illinois:
$74,069
Number of families with income $60k - 75k:
Genoa:
62.2% (143)
State:
13.4% (30,011)
Number of families with income $75k - 100k:
Genoa:
20.8% (48)
State:
17.2% (38,560)
Number of families with income $125k - 150k:
Genoa:
17.0% (39)
State:
7.3% (16,287)
Median per capita income in Genoa in 2022:
Genoa:
$27,083
State:
$25,392
Discuss Genoa, Illinois (IL) on our hugely popular Illinois forum.