The median household income in Gilmore, AR in 2022 was $28,610, which was 93.7% less than the median annual income of $55,432 across the entire state of Arkansas. Compared to the median income of $20,625 in 2000 this represents an increase of 27.9%. The per capita income in 2022 was $19,496, which means an increase of 54.5% compared to 2000 when it was $8,867.
Whole page based on the data from 2000 / 2022 when the population of Gilmore, Arkansas was 292 / 204
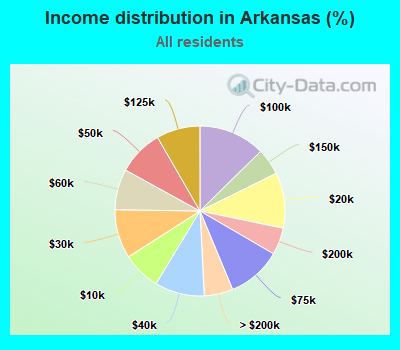
Income statistics for all residents
Median household income in Gilmore, AR in 2022:
Gilmore:
$28,611
Arkansas:
$55,432
Change in median household income between 2000 and 2022:
Gilmore, Arkansas:
+38.7%
State:
+72.2%
Number of households with income < $10k:
Gilmore:
1.2% (1)
State:
7.3% (88,467)
Number of households with income $10k - 20k:
Gilmore:
9.6% (8)
Arkansas:
10.6% (128,341)
Number of households with income $20k - 30k:
Gilmore:
55.4% (46)
State:
9.3% (113,436)
Number of households with income $30k - 40k:
Gilmore:
3.6% (3)
State:
9.5% (114,963)
Number of households with income $40k - 50k:
Gilmore:
2.4% (2)
State:
8.7% (105,305)
Number of households with income $50k - 60k:
Gilmore:
3.6% (3)
Arkansas:
7.8% (94,354)
Number of households with income $60k - 75k:
Gilmore:
8.4% (7)
State:
10.3% (125,593)
Number of households with income $75k - 100k:
Gilmore:
9.6% (8)
Arkansas:
12.6% (153,830)
Number of households with income $100k - 125k:
Gilmore:
6.0% (5)
Arkansas:
8.3% (101,209)
Number of households with income $125k - 150k:
Gilmore:
0.0% (0)
Arkansas:
5.1% (61,560)
Number of households with income $150k - 200k:
Gilmore:
0.0% (0)
State:
5.1% (62,566)
Number of households with income > $200k:
Gilmore:
0.0% (0)
Arkansas:
5.5% (66,583)
Aggregate household income in Gilmore in 2022: $3,583,814
Median family income in Gilmore in 2022:
Gilmore:
$28,869
Arkansas:
$70,708
Number of families with income < $10k:
Gilmore:
1.8% (1)
State:
4.5% (35,013)
Number of families with income $10k - 20k:
Gilmore:
1.5% (1)
Arkansas:
5.2% (40,127)
Number of families with income $20k - 30k:
Gilmore:
63.3% (44)
State:
7.1% (55,246)
Number of families with income $30k - 40k:
Gilmore:
4.6% (3)
State:
8.3% (64,733)
Number of families with income $50k - 60k:
Gilmore:
2.9% (2)
State:
7.8% (60,533)
Number of families with income $60k - 75k:
Gilmore:
6.4% (4)
State:
11.3% (87,716)
Number of families with income $75k - 100k:
Gilmore:
12.3% (8)
Arkansas:
15.4% (119,552)
Number of families with income $100k - 125k:
Gilmore:
7.3% (5)
Arkansas:
10.7% (83,139)
Median income for 2 person families:
Gilmore:
$29,212
State:
$64,523
Median income for families with 0 earners:
Gilmore:
$0
State:
$37,613
Median income for families with 1 earner:
Gilmore:
$29,339
Arkansas:
$52,497
Median income for families with 2 earners:
Gilmore:
$0
Arkansas:
$95,083
Median income for families with 3+ earners:
Gilmore:
$0
State:
$124,486
Median per capita income in Gilmore in 2022:
Gilmore:
$19,497
State:
$31,380
Change in median per capita income between 2000 and 2022:
Gilmore, Arkansas:
+119.9%
State:
+85.6%
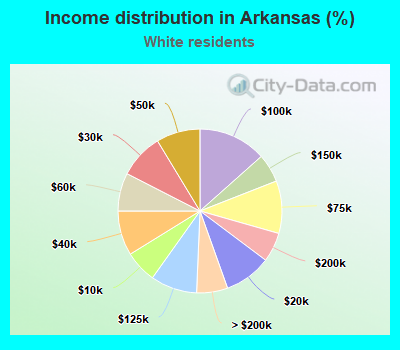
Income statistics for White residents
Number of households with income < $10k:
Gilmore:
0.0% (0)
State:
6.3% (55,696)
Number of households with income $10k - 20k:
Gilmore:
0.0% (0)
Arkansas:
9.3% (81,739)
Number of households with income $20k - 30k:
Gilmore:
28.6% (4)
State:
8.8% (77,378)
Number of households with income $30k - 40k:
Gilmore:
0.0% (0)
State:
8.8% (77,496)
Number of households with income $40k - 50k:
Gilmore:
0.0% (0)
Arkansas:
8.7% (76,115)
Number of households with income $50k - 60k:
Gilmore:
0.0% (0)
State:
7.5% (66,259)
Number of households with income $60k - 75k:
Gilmore:
7.1% (1)
State:
10.4% (91,072)
Number of households with income $75k - 100k:
Gilmore:
50.0% (7)
Arkansas:
13.4% (118,116)
Number of households with income $100k - 125k:
Gilmore:
14.3% (2)
State:
9.2% (80,719)
Number of households with income $125k - 150k:
Gilmore:
0.0% (0)
State:
5.6% (49,507)
Number of households with income $150k - 200k:
Gilmore:
0.0% (0)
State:
5.8% (51,161)
Number of households with income > $200k:
Gilmore:
0.0% (0)
State:
6.1% (53,810)
Aggregate household income in Gilmore in 2022: $1,057,605
Median per capita income in Gilmore in 2022:
Gilmore:
$24,851
State:
$34,985
Change in median per capita income between 2000 and 2022:
Gilmore, Arkansas:
+96.0%
Arkansas:
+89.9%
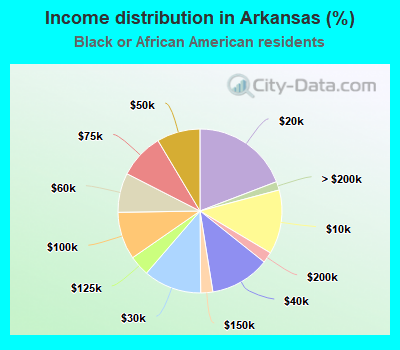
Income statistics for Black or African American residents
Median household income in Gilmore, AR in 2022:
Gilmore:
$27,534
State:
$35,703
Change in median household income between 2000 and 2022:
Gilmore, Arkansas:
+43.0%
State:
+72.5%
Number of households with income < $10k:
Gilmore:
1.5% (1)
State:
12.7% (23,314)
Number of households with income $10k - 20k:
Gilmore:
10.3% (7)
State:
19.2% (35,357)
Number of households with income $20k - 30k:
Gilmore:
67.6% (46)
Arkansas:
11.4% (21,073)
Number of households with income $30k - 40k:
Gilmore:
5.9% (4)
State:
11.8% (21,694)
Number of households with income $40k - 50k:
Gilmore:
2.9% (2)
State:
8.5% (15,750)
Number of households with income $50k - 60k:
Gilmore:
1.5% (1)
Arkansas:
7.8% (14,317)
Number of households with income $60k - 75k:
Gilmore:
8.8% (6)
State:
8.9% (16,442)
Number of households with income $75k - 100k:
Gilmore:
1.5% (1)
Arkansas:
9.4% (17,292)
Number of households with income $100k - 125k:
Gilmore:
0.0% (0)
State:
4.0% (7,458)
Number of households with income $125k - 150k:
Gilmore:
0.0% (0)
State:
2.4% (4,410)
Number of households with income $150k - 200k:
Gilmore:
0.0% (0)
Arkansas:
2.2% (4,004)
Number of households with income > $200k:
Gilmore:
0.0% (0)
Arkansas:
1.7% (3,121)
Aggregate household income in Gilmore in 2022: $2,019,629
Median family income in Gilmore in 2022:
Gilmore:
$30,603
State:
$49,020
Number of families with income < $10k:
Gilmore:
2.2% (1)
State:
9.0% (8,750)
Number of families with income $10k - 20k:
Gilmore:
1.5% (1)
State:
10.8% (10,530)
Number of families with income $20k - 30k:
Gilmore:
79.9% (37)
Arkansas:
10.5% (10,186)
Number of families with income $30k - 40k:
Gilmore:
6.3% (3)
State:
10.1% (9,824)
Number of families with income $60k - 75k:
Gilmore:
8.0% (4)
State:
12.5% (12,151)
Number of families with income $75k - 100k:
Gilmore:
2.2% (1)
State:
13.0% (12,700)
Median per capita income in Gilmore in 2022:
Gilmore:
$16,614
Arkansas:
$22,000
Change in median per capita income between 2000 and 2022:
Gilmore, Arkansas:
+108.6%
State:
+107.9%
Income statistics for Multirace residents
Aggregate household income in Gilmore in 2022: $744,279
Median per capita income in Gilmore in 2022:
Gilmore:
$24,496
State:
$23,635
Change in median per capita income between 2000 and 2022:
Gilmore, Arkansas:
+16.6%
Arkansas:
+103.6%
Discuss Gilmore, Arkansas (AR) on our hugely popular Arkansas forum.