Glenville, New York (NY) income map, earnings map, and wages data
The median household income in Glenville, NY in 2022 was $93,813, which was 15.2% greater than the median annual income of $79,557 across the entire state of New York. Compared to the median income of $52,373 in 2000 this represents an increase of 44.2%. The per capita income in 2022 was $49,664, which means an increase of 50.1% compared to 2000 when it was $24,795.
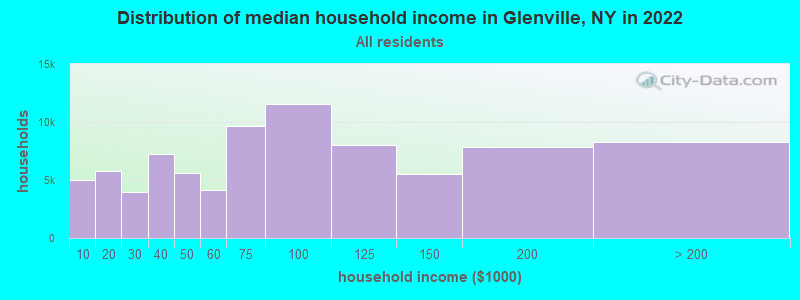
Income statistics for all residents
Median household income in Glenville, NY in 2022:| Glenville: | $93,813 |
| State: | $79,557 |
Change in median household income between 2000 and 2022:| Glenville, New York: | +79.1% |
| State: | +83.3% |
Number of households with income < $10k:| Glenville: | 6.1% (5,019) |
| New York: | 6.8% (527,598) |
Number of households with income $10k - 20k:| Glenville: | 7.0% (5,747) |
| State: | 7.4% (574,940) |
Number of households with income $20k - 30k:| Glenville: | 4.8% (3,969) |
| New York: | 6.7% (517,718) |
Number of households with income $30k - 40k:| Glenville: | 8.8% (7,231) |
| State: | 6.5% (506,674) |
Number of households with income $40k - 50k:| Glenville: | 6.8% (5,590) |
| New York: | 6.1% (470,439) |
Number of households with income $50k - 60k:| Glenville: | 5.0% (4,146) |
| State: | 5.8% (454,042) |
Number of households with income $60k - 75k:| Glenville: | 11.7% (9,668) |
| New York: | 8.5% (657,508) |
Number of households with income $75k - 100k:| Glenville: | 14.0% (11,578) |
| State: | 11.6% (899,824) |
Number of households with income $100k - 125k:| Glenville: | 9.7% (8,039) |
| New York: | 9.3% (723,825) |
Number of households with income $125k - 150k:| Glenville: | 6.6% (5,477) |
| New York: | 7.1% (552,420) |
Number of households with income $150k - 200k:| Glenville: | 9.5% (7,811) |
| New York: | 9.4% (727,051) |
Number of households with income > $200k:| Glenville: | 10.0% (8,236) |
| New York: | 15.0% (1,162,269) |
Aggregate household income in Glenville in 2022: $2,191,343,839
Median family income in Glenville in 2022:| Glenville: | $115,052 |
| New York: | $99,066 |
Median non-family income in Glenville in 2022:| Glenville: | $57,799 |
| State: | $50,181 |
Change in median non-family income between 2000 and 2022:| Glenville, New York: | +92.5% |
| New York: | +85.4% |
Median per capita income in Glenville in 2022:| Glenville: | $49,664 |
| New York: | $47,421 |
Change in median per capita income between 2000 and 2022:| Glenville, New York: | +100.3% |
| New York: | +102.7% |
Income statistics for White residents
Median household income in Glenville, NY in 2022:| Glenville: | $99,420 |
| New York: | $89,408 |
Change in median household income between 2000 and 2022:| Glenville, New York: | +90.2% |
| State: | +85.5% |
Number of households with income < $10k:| Glenville: | 3.2% (1,953) |
| State: | 4.8% (225,550) |
Number of households with income $10k - 20k:| Glenville: | 6.2% (3,791) |
| State: | 6.1% (289,425) |
Number of households with income $20k - 30k:| Glenville: | 5.1% (3,093) |
| New York: | 5.9% (280,254) |
Number of households with income $30k - 40k:| Glenville: | 7.1% (4,295) |
| New York: | 6.1% (288,263) |
Number of households with income $40k - 50k:| Glenville: | 7.0% (4,234) |
| New York: | 5.9% (278,079) |
Number of households with income $50k - 60k:| Glenville: | 5.1% (3,094) |
| State: | 5.7% (267,554) |
Number of households with income $60k - 75k:| Glenville: | 10.5% (6,368) |
| New York: | 8.4% (398,344) |
Number of households with income $75k - 100k:| Glenville: | 15.4% (9,326) |
| State: | 11.8% (554,841) |
Number of households with income $100k - 125k:| Glenville: | 10.9% (6,642) |
| New York: | 10.0% (469,794) |
Number of households with income $125k - 150k:| Glenville: | 7.2% (4,385) |
| State: | 7.6% (360,467) |
Number of households with income $150k - 200k:| Glenville: | 11.1% (6,739) |
| State: | 10.1% (477,078) |
Number of households with income > $200k:| Glenville: | 11.2% (6,798) |
| State: | 17.6% (829,233) |
Aggregate household income in Glenville in 2022: $1,802,684,595
Median family income in Glenville in 2022:| Glenville: | $125,113 |
| State: | $115,170 |
Number of families with income < $10k:| Glenville: | 0.6% (37) |
| State: | 2.5% (68,851) |
Number of families with income $10k - 20k:| Glenville: | 1.7% (111) |
| State: | 3.0% (83,127) |
Number of families with income $20k - 30k:| Glenville: | 0.9% (63) |
| New York: | 3.5% (97,578) |
Number of families with income $30k - 40k:| Glenville: | 2.4% (163) |
| New York: | 4.1% (114,108) |
Number of families with income $40k - 50k:| Glenville: | 3.3% (218) |
| New York: | 4.7% (130,902) |
Number of families with income $50k - 60k:| Glenville: | 5.7% (378) |
| New York: | 4.9% (135,118) |
Number of families with income $60k - 75k:| Glenville: | 11.6% (775) |
| State: | 7.8% (216,254) |
Number of families with income $75k - 100k:| Glenville: | 16.5% (1,098) |
| State: | 12.4% (342,382) |
Number of families with income $100k - 125k:| Glenville: | 18.0% (1,199) |
| State: | 11.4% (314,917) |
Number of families with income $125k - 150k:| Glenville: | 13.7% (912) |
| New York: | 9.4% (260,489) |
Number of families with income $150k - 200k:| Glenville: | 11.5% (768) |
| New York: | 13.2% (365,586) |
Number of families with income > $200k:| Glenville: | 14.2% (946) |
| New York: | 23.2% (642,319) |
Median non-family income in Glenville in 2022:| Glenville: | $59,002 |
| State: | $54,783 |
Change in median non-family income between 2000 and 2022:| Glenville, New York: | +95.9% |
| State: | +87.9% |
Median per capita income in Glenville in 2022:| Glenville: | $56,648 |
| New York: | $57,640 |
Change in median per capita income between 2000 and 2022:| Glenville, New York: | +126.5% |
| State: | +111.6% |
Income statistics for Black or African American residents
Median household income in Glenville, NY in 2022:| Glenville: | $220,151 |
| New York: | $57,898 |
Change in median household income between 2000 and 2022:| Glenville, New York: | +74.4% |
| State: | +84.6% |
Number of households with income < $10k:| Glenville: | 12.0% (258,782) |
| New York: | 12.0% (128,500) |
Number of households with income $10k - 20k:| Glenville: | 10.0% (216,358) |
| State: | 10.0% (107,541) |
Number of households with income $20k - 30k:| Glenville: | 8.4% (181,582) |
| State: | 8.4% (90,192) |
Number of households with income $30k - 40k:| Glenville: | 7.4% (160,037) |
| New York: | 7.4% (79,579) |
Number of households with income $40k - 50k:| Glenville: | 6.8% (145,924) |
| State: | 6.8% (72,491) |
Number of households with income $50k - 60k:| Glenville: | 6.6% (143,118) |
| New York: | 6.7% (71,309) |
Number of households with income $60k - 75k:| Glenville: | 8.9% (191,335) |
| New York: | 8.9% (95,050) |
Number of households with income $75k - 100k:| Glenville: | 11.5% (248,254) |
| State: | 11.5% (123,569) |
Number of households with income $100k - 125k:| Glenville: | 8.1% (173,793) |
| New York: | 8.1% (86,632) |
Number of households with income $125k - 150k:| Glenville: | 6.1% (130,388) |
| New York: | 6.0% (64,788) |
Number of households with income $150k - 200k:| Glenville: | 7.1% (153,854) |
| State: | 7.2% (76,644) |
Number of households with income > $200k:| Glenville: | 7.0% (150,247) |
| State: | 7.0% (75,062) |
Aggregate household income in Glenville in 2022: $15,974,366
Median family income in Glenville in 2022:| Glenville: | $205,913 |
| State: | $72,528 |
Number of families with income $50k - 60k:| Glenville: | 8.7% (7) |
| State: | 6.3% (39,748) |
Number of families with income $60k - 75k:| Glenville: | 8.1% (6) |
| State: | 9.2% (57,626) |
Number of families with income $125k - 150k:| Glenville: | 83.3% (65) |
| State: | 7.5% (47,050) |
Median per capita income in Glenville in 2022:| Glenville: | $46,554 |
| State: | $31,947 |
Change in median per capita income between 2000 and 2022:| Glenville, New York: | +99.6% |
| State: | +106.1% |
Income statistics for Asian residents
Median household income in Glenville, NY in 2022:| Glenville: | $29,850 |
| State: | $89,947 |
Change in median household income between 2000 and 2022:| Glenville, New York: | +9.3% |
| State: | +98.1% |
Number of households with income < $10k:| Glenville: | 6.9% (12,797) |
| State: | 6.9% (42,537) |
Number of households with income $10k - 20k:| Glenville: | 7.3% (13,465) |
| New York: | 7.3% (44,745) |
Number of households with income $20k - 30k:| Glenville: | 6.2% (11,530) |
| State: | 6.2% (38,249) |
Number of households with income $30k - 40k:| Glenville: | 5.5% (10,227) |
| State: | 5.5% (33,993) |
Number of households with income $40k - 50k:| Glenville: | 4.9% (8,977) |
| New York: | 4.8% (29,795) |
Number of households with income $50k - 60k:| Glenville: | 5.2% (9,601) |
| State: | 5.2% (32,100) |
Number of households with income $60k - 75k:| Glenville: | 7.3% (13,415) |
| State: | 7.3% (44,615) |
Number of households with income $75k - 100k:| Glenville: | 10.9% (20,059) |
| State: | 10.8% (66,687) |
Number of households with income $100k - 125k:| Glenville: | 8.2% (15,071) |
| New York: | 8.2% (50,233) |
Number of households with income $125k - 150k:| Glenville: | 7.2% (13,317) |
| State: | 7.2% (44,299) |
Number of households with income $150k - 200k:| Glenville: | 10.4% (19,159) |
| State: | 10.4% (63,837) |
Number of households with income > $200k:| Glenville: | 20.1% (37,182) |
| State: | 20.1% (123,891) |
Aggregate household income in Glenville in 2022: $22,051,652
Median family income in Glenville in 2022:| Glenville: | $64,698 |
| New York: | $98,136 |
Number of families with income < $10k:| Glenville: | 13.8% (22) |
| New York: | 4.1% (18,020) |
Number of families with income $60k - 75k:| Glenville: | 9.9% (16) |
| State: | 7.6% (33,120) |
Number of families with income $100k - 125k:| Glenville: | 18.4% (29) |
| New York: | 8.6% (37,796) |
Number of families with income $150k - 200k:| Glenville: | 22.0% (35) |
| State: | 11.0% (48,177) |
Number of families with income > $200k:| Glenville: | 35.8% (57) |
| State: | 22.2% (97,322) |
Median non-family income in Glenville in 2022:| Glenville: | $40,859 |
| New York: | $63,573 |
Change in median non-family income between 2000 and 2022:| Glenville, New York: | +104.3% |
| New York: | +101.1% |
Median per capita income in Glenville in 2022:| Glenville: | $30,311 |
| New York: | $46,726 |
Change in median per capita income between 2000 and 2022:| Glenville, New York: | +44.2% |
| State: | +126.6% |
Income statistics for Hispanic or Latino residents
Median household income in Glenville, NY in 2022:| Glenville: | $156,168 |
| State: | $60,468 |
Number of households with income < $10k:| Glenville: | 10.0% (119,440) |
| State: | 9.9% (127,185) |
Number of households with income $10k - 20k:| Glenville: | 10.7% (128,573) |
| State: | 10.7% (136,699) |
Number of households with income $20k - 30k:| Glenville: | 8.1% (96,816) |
| New York: | 8.1% (102,991) |
Number of households with income $30k - 40k:| Glenville: | 7.8% (93,777) |
| State: | 7.8% (100,149) |
Number of households with income $40k - 50k:| Glenville: | 6.8% (82,048) |
| State: | 6.9% (87,760) |
Number of households with income $50k - 60k:| Glenville: | 6.3% (75,977) |
| New York: | 6.3% (80,968) |
Number of households with income $60k - 75k:| Glenville: | 8.6% (103,558) |
| New York: | 8.7% (110,631) |
Number of households with income $75k - 100k:| Glenville: | 11.2% (133,671) |
| State: | 11.2% (142,787) |
Number of households with income $100k - 125k:| Glenville: | 8.2% (97,952) |
| State: | 8.2% (104,850) |
Number of households with income $125k - 150k:| Glenville: | 6.3% (75,155) |
| New York: | 6.3% (80,274) |
Number of households with income $150k - 200k:| Glenville: | 7.4% (88,846) |
| State: | 7.4% (95,117) |
Number of households with income > $200k:| Glenville: | 8.6% (102,464) |
| State: | 8.6% (109,514) |
Aggregate household income in Glenville in 2022: $27,582,550
Median family income in Glenville in 2022:| Glenville: | $121,556 |
| State: | $68,770 |
Number of families with income < $10k:| Glenville: | 2.1% (28) |
| State: | 6.9% (58,565) |
Number of families with income $10k - 20k:| Glenville: | 5.2% (70) |
| State: | 7.0% (59,058) |
Number of families with income $20k - 30k:| Glenville: | 8.0% (106) |
| New York: | 8.0% (68,048) |
Number of families with income $30k - 40k:| Glenville: | 9.9% (131) |
| State: | 8.4% (70,668) |
Number of families with income $40k - 50k:| Glenville: | 8.6% (115) |
| New York: | 7.4% (62,941) |
Number of families with income $50k - 60k:| Glenville: | 9.1% (121) |
| State: | 6.6% (55,592) |
Number of families with income $60k - 75k:| Glenville: | 14.2% (189) |
| New York: | 9.3% (78,564) |
Number of families with income $75k - 100k:| Glenville: | 17.0% (225) |
| State: | 12.6% (106,685) |
Number of families with income $100k - 125k:| Glenville: | 12.4% (165) |
| State: | 9.4% (79,139) |
Number of families with income $125k - 150k:| Glenville: | 6.0% (79) |
| State: | 6.9% (58,255) |
Number of families with income $150k - 200k:| Glenville: | 4.1% (55) |
| State: | 8.3% (69,877) |
Number of families with income > $200k:| Glenville: | 3.3% (44) |
| State: | 9.3% (78,555) |
Median per capita income in Glenville in 2022:| Glenville: | $30,961 |
| New York: | $29,761 |
Change in median per capita income between 2000 and 2022:| Glenville, New York: | +114.3% |
| State: | +132.7% |
Income statistics for American Indian and Alaska Native residents
Number of households with income < $10k:| Glenville: | 8.6% (1,602) |
| State: | 8.6% (3,559) |
Number of households with income $10k - 20k:| Glenville: | 6.0% (1,109) |
| New York: | 5.9% (2,455) |
Number of households with income $20k - 30k:| Glenville: | 8.2% (1,524) |
| State: | 8.2% (3,393) |
Number of households with income $30k - 40k:| Glenville: | 11.9% (2,214) |
| New York: | 11.9% (4,918) |
Number of households with income $40k - 50k:| Glenville: | 6.4% (1,197) |
| State: | 6.5% (2,682) |
Number of households with income $50k - 60k:| Glenville: | 6.0% (1,125) |
| State: | 6.1% (2,516) |
Number of households with income $60k - 75k:| Glenville: | 9.9% (1,848) |
| State: | 10.0% (4,125) |
Number of households with income $75k - 100k:| Glenville: | 13.4% (2,486) |
| State: | 13.3% (5,517) |
Number of households with income $100k - 125k:| Glenville: | 8.4% (1,556) |
| New York: | 8.4% (3,463) |
Number of households with income $125k - 150k:| Glenville: | 7.0% (1,303) |
| State: | 7.0% (2,887) |
Number of households with income $150k - 200k:| Glenville: | 10.0% (1,856) |
| State: | 9.9% (4,106) |
Number of households with income > $200k:| Glenville: | 4.2% (786) |
| State: | 4.2% (1,744) |
Median per capita income in Glenville in 2022:| Glenville: | $20,279 |
| State: | $25,837 |
Change in median per capita income between 2000 and 2022:| Glenville, New York: | +75.0% |
| New York: | +99.6% |
Income statistics for Multirace residents
Median household income in Glenville, NY in 2022:| Glenville: | $115,244 |
| New York: | $73,557 |
Number of households with income < $10k:| Glenville: | 8.9% (26,358) |
| New York: | 8.9% (57,924) |
Number of households with income $10k - 20k:| Glenville: | 8.7% (25,706) |
| New York: | 8.7% (56,590) |
Number of households with income $20k - 30k:| Glenville: | 7.1% (21,012) |
| New York: | 7.1% (46,287) |
Number of households with income $30k - 40k:| Glenville: | 6.9% (20,466) |
| New York: | 6.9% (45,132) |
Number of households with income $40k - 50k:| Glenville: | 5.8% (17,175) |
| State: | 5.8% (37,946) |
Number of households with income $50k - 60k:| Glenville: | 5.6% (16,501) |
| State: | 5.6% (36,410) |
Number of households with income $60k - 75k:| Glenville: | 7.8% (23,018) |
| State: | 7.8% (50,819) |
Number of households with income $75k - 100k:| Glenville: | 11.7% (34,492) |
| State: | 11.7% (76,024) |
Number of households with income $100k - 125k:| Glenville: | 9.3% (27,447) |
| State: | 9.3% (60,635) |
Number of households with income $125k - 150k:| Glenville: | 6.2% (18,391) |
| New York: | 6.2% (40,533) |
Number of households with income $150k - 200k:| Glenville: | 8.6% (25,583) |
| State: | 8.6% (56,409) |
Number of households with income > $200k:| Glenville: | 13.4% (39,717) |
| State: | 13.4% (87,442) |
Aggregate household income in Glenville in 2022: $28,030,644
Median family income in Glenville in 2022:| Glenville: | $110,040 |
| State: | $85,788 |
Number of families with income $10k - 20k:| Glenville: | 6.4% (24) |
| State: | 5.6% (22,512) |
Number of families with income $20k - 30k:| Glenville: | 10.1% (39) |
| State: | 6.6% (26,534) |
Number of families with income $60k - 75k:| Glenville: | 5.2% (20) |
| State: | 7.6% (30,653) |
Number of families with income $75k - 100k:| Glenville: | 11.5% (44) |
| State: | 12.9% (51,995) |
Number of families with income $100k - 125k:| Glenville: | 66.8% (255) |
| State: | 10.7% (43,036) |
Median non-family income in Glenville in 2022:| Glenville: | $123,812 |
| New York: | $46,403 |
Change in median non-family income between 2000 and 2022:| Glenville, New York: | +114.5% |
| State: | +113.6% |
Median per capita income in Glenville in 2022:| Glenville: | $28,628 |
| State: | $36,931 |
Change in median per capita income between 2000 and 2022:| Glenville, New York: | +106.8% |
| New York: | +158.8% |
Income statistics for other residents
Number of households with income < $10k:| Glenville: | 10.3% (1,342) |
| State: | 10.3% (69,252) |
Number of households with income $10k - 20k:| Glenville: | 11.0% (1,433) |
| State: | 11.0% (73,890) |
Number of households with income $20k - 30k:| Glenville: | 8.8% (1,147) |
| State: | 8.8% (59,096) |
Number of households with income $30k - 40k:| Glenville: | 8.1% (1,056) |
| New York: | 8.1% (54,418) |
Number of households with income $40k - 50k:| Glenville: | 7.3% (951) |
| State: | 7.3% (49,042) |
Number of households with income $50k - 60k:| Glenville: | 6.5% (853) |
| State: | 6.5% (43,945) |
Number of households with income $60k - 75k:| Glenville: | 9.5% (1,243) |
| State: | 9.5% (64,087) |
Number of households with income $75k - 100k:| Glenville: | 10.9% (1,416) |
| New York: | 10.9% (73,094) |
Number of households with income $100k - 125k:| Glenville: | 7.9% (1,026) |
| State: | 7.9% (53,055) |
Number of households with income $125k - 150k:| Glenville: | 5.9% (765) |
| New York: | 5.9% (39,446) |
Number of households with income $150k - 200k:| Glenville: | 7.2% (940) |
| State: | 7.2% (48,653) |
Number of households with income > $200k:| Glenville: | 6.6% (865) |
| New York: | 6.6% (44,703) |
Median per capita income in Glenville in 2022:| Glenville: | $1,080 |
| New York: | $26,975 |