Grafton, Massachusetts (MA) income map, earnings map, and wages data
The median household income in Grafton, MA in 2022 was $100,935, which was 6.4% greater than the median annual income of $94,488 across the entire state of Massachusetts. Compared to the median income of $56,020 in 2000 this represents an increase of 44.5%. The per capita income in 2022 was $52,550, which means an increase of 48.7% compared to 2000 when it was $26,952.
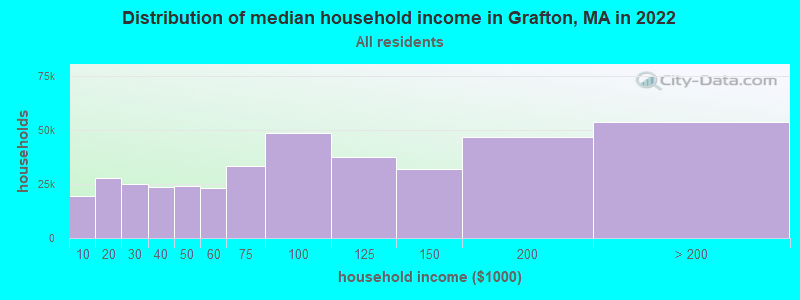
Income statistics for all residents
Median household income in Grafton, MA in 2022:| Grafton: | $100,935 |
| State: | $94,488 |
Change in median household income between 2000 and 2022:| Grafton, Massachusetts: | +80.2% |
| Massachusetts: | +87.1% |
Number of households with income < $10k:| Grafton: | 4.9% (19,416) |
| State: | 5.2% (146,170) |
Number of households with income $10k - 20k:| Grafton: | 7.0% (27,702) |
| Massachusetts: | 6.4% (180,001) |
Number of households with income $20k - 30k:| Grafton: | 6.4% (25,230) |
| State: | 5.6% (156,667) |
Number of households with income $30k - 40k:| Grafton: | 5.9% (23,483) |
| State: | 5.6% (157,168) |
Number of households with income $40k - 50k:| Grafton: | 6.1% (24,047) |
| State: | 5.4% (151,455) |
Number of households with income $50k - 60k:| Grafton: | 5.8% (23,024) |
| State: | 5.1% (142,726) |
Number of households with income $60k - 75k:| Grafton: | 8.4% (33,411) |
| Massachusetts: | 7.6% (212,203) |
Number of households with income $75k - 100k:| Grafton: | 12.3% (48,595) |
| State: | 11.3% (317,064) |
Number of households with income $100k - 125k:| Grafton: | 9.5% (37,720) |
| Massachusetts: | 9.7% (270,603) |
Number of households with income $125k - 150k:| Grafton: | 8.1% (32,232) |
| State: | 8.0% (223,140) |
Number of households with income $150k - 200k:| Grafton: | 11.9% (46,944) |
| Massachusetts: | 11.0% (308,695) |
Number of households with income > $200k:| Grafton: | 13.6% (53,810) |
| State: | 19.0% (531,884) |
Aggregate household income in Grafton in 2022: $7,075,948,503
Median family income in Grafton in 2022:| Grafton: | $122,170 |
| State: | $120,263 |
Median non-family income in Grafton in 2022:| Grafton: | $58,440 |
| State: | $55,979 |
Change in median non-family income between 2000 and 2022:| Grafton, Massachusetts: | +85.7% |
| State: | +88.0% |
Median per capita income in Grafton in 2022:| Grafton: | $52,551 |
| State: | $54,025 |
Change in median per capita income between 2000 and 2022:| Grafton, Massachusetts: | +95.0% |
| State: | +108.2% |
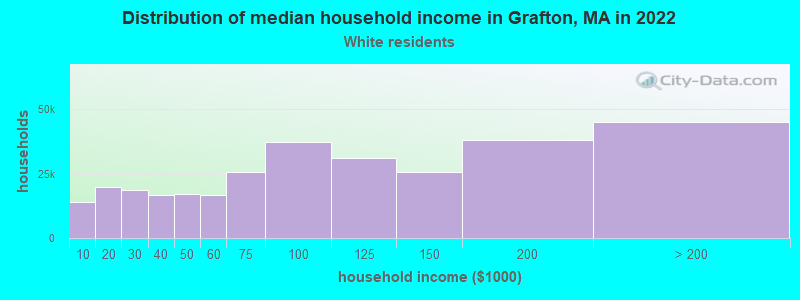
Income statistics for White residents
Median household income in Grafton, MA in 2022:| Grafton: | $104,356 |
| State: | $101,391 |
Change in median household income between 2000 and 2022:| Grafton, Massachusetts: | +85.1% |
| Massachusetts: | +93.3% |
Number of households with income < $10k:| Grafton: | 4.6% (13,938) |
| State: | 4.4% (91,120) |
Number of households with income $10k - 20k:| Grafton: | 6.5% (19,931) |
| State: | 5.9% (122,055) |
Number of households with income $20k - 30k:| Grafton: | 6.1% (18,481) |
| State: | 5.1% (105,311) |
Number of households with income $30k - 40k:| Grafton: | 5.5% (16,676) |
| State: | 5.3% (110,239) |
Number of households with income $40k - 50k:| Grafton: | 5.6% (17,074) |
| State: | 5.0% (104,636) |
Number of households with income $50k - 60k:| Grafton: | 5.4% (16,557) |
| Massachusetts: | 4.8% (99,486) |
Number of households with income $60k - 75k:| Grafton: | 8.4% (25,640) |
| State: | 7.5% (155,124) |
Number of households with income $75k - 100k:| Grafton: | 12.2% (37,262) |
| State: | 11.4% (236,252) |
Number of households with income $100k - 125k:| Grafton: | 10.1% (30,965) |
| State: | 9.9% (204,731) |
Number of households with income $125k - 150k:| Grafton: | 8.4% (25,536) |
| Massachusetts: | 8.5% (175,324) |
Number of households with income $150k - 200k:| Grafton: | 12.5% (38,044) |
| Massachusetts: | 11.7% (242,980) |
Number of households with income > $200k:| Grafton: | 14.7% (44,998) |
| State: | 20.5% (425,966) |
Aggregate household income in Grafton in 2022: $5,744,149,354
Median family income in Grafton in 2022:| Grafton: | $128,850 |
| State: | $133,153 |
Number of families with income < $10k:| Grafton: | 0.4% (17) |
| Massachusetts: | 2.0% (25,038) |
Number of families with income $10k - 20k:| Grafton: | 1.7% (70) |
| Massachusetts: | 2.1% (26,403) |
Number of families with income $20k - 30k:| Grafton: | 2.6% (109) |
| Massachusetts: | 2.6% (32,525) |
Number of families with income $30k - 40k:| Grafton: | 3.7% (153) |
| State: | 3.9% (48,079) |
Number of families with income $40k - 50k:| Grafton: | 3.1% (127) |
| Massachusetts: | 3.8% (46,908) |
Number of families with income $50k - 60k:| Grafton: | 3.7% (154) |
| State: | 3.8% (46,476) |
Number of families with income $60k - 75k:| Grafton: | 7.2% (299) |
| State: | 6.4% (79,040) |
Number of families with income $75k - 100k:| Grafton: | 13.3% (552) |
| State: | 11.1% (137,395) |
Number of families with income $100k - 125k:| Grafton: | 13.3% (551) |
| State: | 11.1% (136,771) |
Number of families with income $125k - 150k:| Grafton: | 9.0% (371) |
| Massachusetts: | 10.0% (123,709) |
Number of families with income $150k - 200k:| Grafton: | 21.7% (898) |
| State: | 14.7% (181,602) |
Number of families with income > $200k:| Grafton: | 20.2% (838) |
| State: | 28.5% (351,887) |
Median non-family income in Grafton in 2022:| Grafton: | $60,982 |
| Massachusetts: | $59,323 |
Change in median non-family income between 2000 and 2022:| Grafton, Massachusetts: | +92.0% |
| State: | +94.3% |
Median per capita income in Grafton in 2022:| Grafton: | $56,656 |
| Massachusetts: | $60,804 |
Change in median per capita income between 2000 and 2022:| Grafton, Massachusetts: | +105.3% |
| State: | +118.7% |
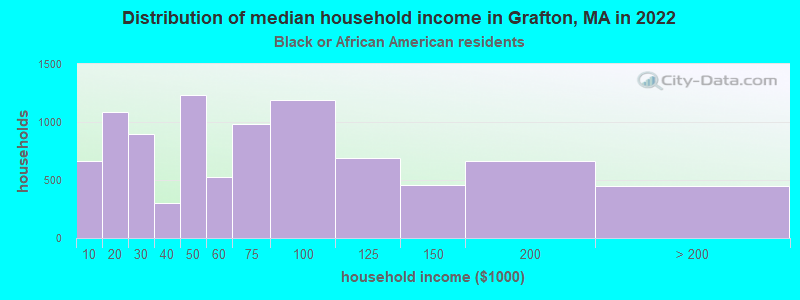
Income statistics for Black or African American residents
Median household income in Grafton, MA in 2022:| Grafton: | $35,172 |
| Massachusetts: | $63,189 |
Change in median household income between 2000 and 2022:| Grafton, Massachusetts: | +69.8% |
| Massachusetts: | +87.4% |
Number of households with income < $10k:| Grafton: | 7.3% (667) |
| State: | 9.1% (15,797) |
Number of households with income $10k - 20k:| Grafton: | 11.9% (1,090) |
| Massachusetts: | 9.4% (16,267) |
Number of households with income $20k - 30k:| Grafton: | 9.8% (898) |
| State: | 7.8% (13,520) |
Number of households with income $30k - 40k:| Grafton: | 3.3% (298) |
| State: | 8.3% (14,412) |
Number of households with income $40k - 50k:| Grafton: | 13.5% (1,235) |
| State: | 7.9% (13,790) |
Number of households with income $50k - 60k:| Grafton: | 5.8% (528) |
| Massachusetts: | 5.8% (10,041) |
Number of households with income $60k - 75k:| Grafton: | 10.7% (982) |
| State: | 8.5% (14,822) |
Number of households with income $75k - 100k:| Grafton: | 13.0% (1,193) |
| State: | 11.0% (19,122) |
Number of households with income $100k - 125k:| Grafton: | 7.5% (689) |
| Massachusetts: | 8.4% (14,575) |
Number of households with income $125k - 150k:| Grafton: | 5.0% (455) |
| State: | 6.0% (10,429) |
Number of households with income $150k - 200k:| Grafton: | 7.3% (664) |
| Massachusetts: | 7.2% (12,539) |
Number of households with income > $200k:| Grafton: | 4.9% (452) |
| State: | 10.5% (18,185) |
Aggregate household income in Grafton in 2022: $5,819,067
Median family income in Grafton in 2022:| Grafton: | $33,499 |
| State: | $79,815 |
Number of families with income < $10k:| Grafton: | 15.0% (15) |
| State: | 6.3% (6,915) |
Number of families with income $20k - 30k:| Grafton: | 7.5% (8) |
| State: | 6.6% (7,274) |
Number of families with income $150k - 200k:| Grafton: | 77.5% (79) |
| State: | 9.3% (10,230) |
Median non-family income in Grafton in 2022:| Grafton: | $28,976 |
| Massachusetts: | $38,934 |
Change in median non-family income between 2000 and 2022:| Grafton, Massachusetts: | +36.4% |
| Massachusetts: | +69.2% |
Median per capita income in Grafton in 2022:| Grafton: | $12,735 |
| State: | $33,524 |
Change in median per capita income between 2000 and 2022:| Grafton, Massachusetts: | +95.7% |
| Massachusetts: | +109.4% |
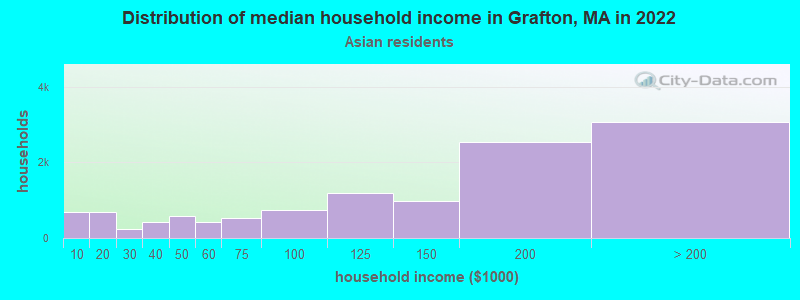
Income statistics for Asian residents
Median household income in Grafton, MA in 2022:| Grafton: | $109,196 |
| Massachusetts: | $117,855 |
Change in median household income between 2000 and 2022:| Grafton, Massachusetts: | +149.6% |
| State: | +129.9% |
Number of households with income < $10k:| Grafton: | 5.7% (693) |
| State: | 6.8% (11,982) |
Number of households with income $10k - 20k:| Grafton: | 5.8% (696) |
| State: | 4.8% (8,376) |
Number of households with income $20k - 30k:| Grafton: | 1.9% (230) |
| State: | 3.7% (6,558) |
Number of households with income $30k - 40k:| Grafton: | 3.5% (428) |
| Massachusetts: | 3.3% (5,748) |
Number of households with income $40k - 50k:| Grafton: | 4.9% (594) |
| Massachusetts: | 4.1% (7,192) |
Number of households with income $50k - 60k:| Grafton: | 3.5% (423) |
| State: | 5.0% (8,734) |
Number of households with income $60k - 75k:| Grafton: | 4.3% (524) |
| State: | 5.8% (10,203) |
Number of households with income $75k - 100k:| Grafton: | 6.1% (736) |
| Massachusetts: | 8.6% (15,154) |
Number of households with income $100k - 125k:| Grafton: | 9.7% (1,177) |
| Massachusetts: | 10.8% (18,942) |
Number of households with income $125k - 150k:| Grafton: | 8.1% (975) |
| State: | 8.0% (14,037) |
Number of households with income $150k - 200k:| Grafton: | 21.1% (2,547) |
| State: | 12.5% (21,856) |
Number of households with income > $200k:| Grafton: | 25.4% (3,066) |
| State: | 26.6% (46,694) |
Aggregate household income in Grafton in 2022: $22,025,610
Median family income in Grafton in 2022:| Grafton: | $79,245 |
| Massachusetts: | $140,113 |
Number of families with income $20k - 30k:| Grafton: | 16.9% (7) |
| State: | 2.3% (2,708) |
Number of families with income $75k - 100k:| Grafton: | 16.4% (7) |
| State: | 8.5% (10,022) |
Number of families with income $100k - 125k:| Grafton: | 33.9% (15) |
| State: | 10.0% (11,697) |
Number of families with income $125k - 150k:| Grafton: | 32.9% (14) |
| Massachusetts: | 8.6% (10,071) |
Median non-family income in Grafton in 2022:| Grafton: | $84,646 |
| Massachusetts: | $71,440 |
Median per capita income in Grafton in 2022:| Grafton: | $48,244 |
| State: | $58,900 |
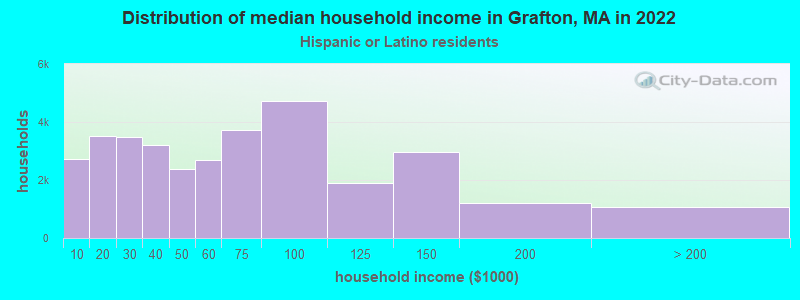
Income statistics for Hispanic or Latino residents
Median household income in Grafton, MA in 2022:| Grafton: | $53,334 |
| Massachusetts: | $61,523 |
Change in median household income between 2000 and 2022:| Grafton, Massachusetts: | +116.0% |
| State: | +125.4% |
Number of households with income < $10k:| Grafton: | 8.1% (2,730) |
| Massachusetts: | 8.8% (25,307) |
Number of households with income $10k - 20k:| Grafton: | 10.5% (3,511) |
| State: | 10.0% (28,653) |
Number of households with income $20k - 30k:| Grafton: | 10.3% (3,472) |
| State: | 8.8% (25,189) |
Number of households with income $30k - 40k:| Grafton: | 9.5% (3,193) |
| Massachusetts: | 7.2% (20,822) |
Number of households with income $40k - 50k:| Grafton: | 7.1% (2,388) |
| State: | 7.2% (20,817) |
Number of households with income $50k - 60k:| Grafton: | 8.0% (2,682) |
| Massachusetts: | 6.5% (18,748) |
Number of households with income $60k - 75k:| Grafton: | 11.1% (3,717) |
| State: | 8.8% (25,390) |
Number of households with income $75k - 100k:| Grafton: | 14.1% (4,729) |
| State: | 12.0% (34,488) |
Number of households with income $100k - 125k:| Grafton: | 5.7% (1,909) |
| Massachusetts: | 8.6% (24,599) |
Number of households with income $125k - 150k:| Grafton: | 8.8% (2,965) |
| Massachusetts: | 6.2% (17,743) |
Number of households with income $150k - 200k:| Grafton: | 3.6% (1,192) |
| State: | 7.3% (21,017) |
Number of households with income > $200k:| Grafton: | 3.2% (1,069) |
| State: | 8.6% (24,606) |
Aggregate household income in Grafton in 2022: $18,548,938
Median family income in Grafton in 2022:| Grafton: | $79,295 |
| Massachusetts: | $66,072 |
Number of families with income < $10k:| Grafton: | 2.1% (10) |
| Massachusetts: | 6.2% (12,456) |
Number of families with income $10k - 20k:| Grafton: | 3.8% (19) |
| State: | 6.0% (12,071) |
Number of families with income $20k - 30k:| Grafton: | 9.5% (47) |
| State: | 10.1% (20,376) |
Number of families with income $30k - 40k:| Grafton: | 9.6% (48) |
| State: | 8.2% (16,470) |
Number of families with income $40k - 50k:| Grafton: | 9.5% (48) |
| State: | 7.4% (14,829) |
Number of families with income $50k - 60k:| Grafton: | 10.5% (53) |
| State: | 7.3% (14,643) |
Number of families with income $60k - 75k:| Grafton: | 10.3% (52) |
| State: | 10.6% (21,252) |
Number of families with income $75k - 100k:| Grafton: | 16.5% (83) |
| State: | 12.0% (24,088) |
Number of families with income $100k - 125k:| Grafton: | 7.1% (35) |
| State: | 8.9% (17,954) |
Number of families with income $125k - 150k:| Grafton: | 11.0% (55) |
| Massachusetts: | 6.9% (13,837) |
Number of families with income $150k - 200k:| Grafton: | 5.3% (27) |
| State: | 7.3% (14,683) |
Number of families with income > $200k:| Grafton: | 4.8% (24) |
| State: | 9.3% (18,741) |
Median non-family income in Grafton in 2022:| Grafton: | $40,804 |
| State: | $37,563 |
Change in median non-family income between 2000 and 2022:| Grafton, Massachusetts: | +95.9% |
| State: | +115.0% |
Median per capita income in Grafton in 2022:| Grafton: | $29,440 |
| State: | $28,993 |
Change in median per capita income between 2000 and 2022:| Grafton, Massachusetts: | +110.9% |
| State: | +142.4% |
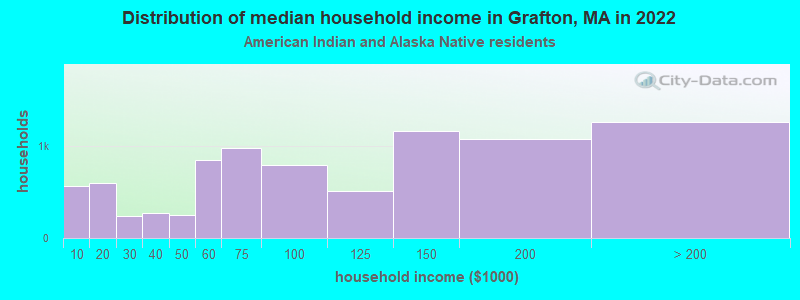
Income statistics for American Indian and Alaska Native residents
Median household income in Grafton, MA in 2022:| Grafton: | $151,104 |
| Massachusetts: | $87,730 |
Number of households with income < $10k:| Grafton: | 6.6% (567) |
| Massachusetts: | 6.6% (451) |
Number of households with income $10k - 20k:| Grafton: | 7.0% (598) |
| State: | 7.0% (476) |
Number of households with income $20k - 30k:| Grafton: | 2.8% (241) |
| State: | 2.8% (192) |
Number of households with income $30k - 40k:| Grafton: | 3.2% (274) |
| State: | 3.2% (218) |
Number of households with income $40k - 50k:| Grafton: | 2.9% (250) |
| Massachusetts: | 2.9% (199) |
Number of households with income $50k - 60k:| Grafton: | 9.9% (851) |
| State: | 9.9% (677) |
Number of households with income $60k - 75k:| Grafton: | 11.5% (981) |
| Massachusetts: | 11.5% (781) |
Number of households with income $75k - 100k:| Grafton: | 9.2% (790) |
| Massachusetts: | 9.2% (629) |
Number of households with income $100k - 125k:| Grafton: | 6.0% (510) |
| State: | 6.0% (406) |
Number of households with income $125k - 150k:| Grafton: | 13.5% (1,157) |
| State: | 13.5% (921) |
Number of households with income $150k - 200k:| Grafton: | 12.6% (1,079) |
| State: | 12.6% (859) |
Number of households with income > $200k:| Grafton: | 14.7% (1,260) |
| State: | 14.7% (1,003) |
Aggregate household income in Grafton in 2022: $145,477
Median family income in Grafton in 2022:| Grafton: | $140,462 |
| Massachusetts: | $105,715 |
Median per capita income in Grafton in 2022:| Grafton: | $18,944 |
| Massachusetts: | $39,434 |
Change in median per capita income between 2000 and 2022:| Grafton, Massachusetts: | +80.0% |
| Massachusetts: | +148.2% |
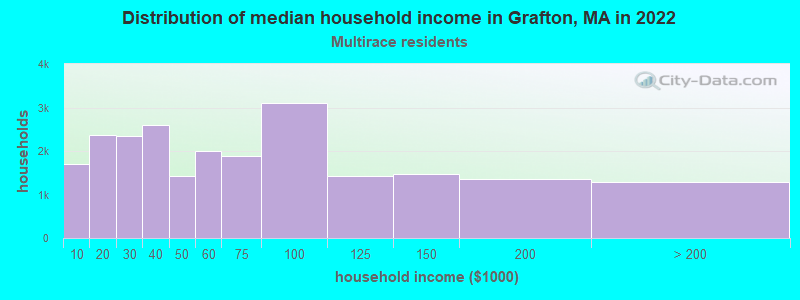
Income statistics for Multirace residents
Median household income in Grafton, MA in 2022:| Grafton: | $45,893 |
| State: | $71,552 |
Change in median household income between 2000 and 2022:| Grafton, Massachusetts: | +84.7% |
| State: | +109.0% |
Number of households with income < $10k:| Grafton: | 7.4% (1,709) |
| State: | 6.6% (15,127) |
Number of households with income $10k - 20k:| Grafton: | 10.3% (2,375) |
| State: | 9.2% (21,158) |
Number of households with income $20k - 30k:| Grafton: | 10.2% (2,347) |
| State: | 7.8% (18,016) |
Number of households with income $30k - 40k:| Grafton: | 11.3% (2,599) |
| Massachusetts: | 7.9% (18,260) |
Number of households with income $40k - 50k:| Grafton: | 6.2% (1,426) |
| State: | 5.6% (13,027) |
Number of households with income $50k - 60k:| Grafton: | 8.7% (2,007) |
| Massachusetts: | 5.6% (12,909) |
Number of households with income $60k - 75k:| Grafton: | 8.2% (1,877) |
| Massachusetts: | 9.0% (20,800) |
Number of households with income $75k - 100k:| Grafton: | 13.5% (3,103) |
| Massachusetts: | 12.1% (27,875) |
Number of households with income $100k - 125k:| Grafton: | 6.2% (1,419) |
| Massachusetts: | 8.1% (18,754) |
Number of households with income $125k - 150k:| Grafton: | 6.4% (1,477) |
| State: | 6.8% (15,621) |
Number of households with income $150k - 200k:| Grafton: | 5.9% (1,363) |
| State: | 9.4% (21,618) |
Number of households with income > $200k:| Grafton: | 5.6% (1,281) |
| Massachusetts: | 12.0% (27,592) |
Aggregate household income in Grafton in 2022: $16,046,833
Median family income in Grafton in 2022:| Grafton: | $70,340 |
| Massachusetts: | $78,380 |
Number of families with income $20k - 30k:| Grafton: | 4.0% (7) |
| State: | 8.5% (13,245) |
Number of families with income $30k - 40k:| Grafton: | 38.4% (70) |
| State: | 8.2% (12,705) |
Number of families with income $75k - 100k:| Grafton: | 57.5% (105) |
| State: | 12.1% (18,758) |
Median non-family income in Grafton in 2022:| Grafton: | $20,998 |
| State: | $42,253 |
Change in median non-family income between 2000 and 2022:| Grafton, Massachusetts: | +60.0% |
| State: | +93.7% |
Median per capita income in Grafton in 2022:| Grafton: | $26,413 |
| State: | $34,029 |
Change in median per capita income between 2000 and 2022:| Grafton, Massachusetts: | +104.0% |
| Massachusetts: | +132.1% |
Income statistics for other residents
Number of households with income < $10k:| Grafton: | 2.6% (458) |
| State: | 8.4% (11,559) |
Number of households with income $10k - 20k:| Grafton: | 5.8% (1,029) |
| State: | 8.4% (11,499) |
Number of households with income $20k - 30k:| Grafton: | 6.2% (1,118) |
| State: | 9.5% (13,070) |
Number of households with income $30k - 40k:| Grafton: | 10.5% (1,882) |
| Massachusetts: | 6.0% (8,291) |
Number of households with income $40k - 50k:| Grafton: | 9.1% (1,620) |
| State: | 9.2% (12,611) |
Number of households with income $50k - 60k:| Grafton: | 9.0% (1,615) |
| Massachusetts: | 7.9% (10,879) |
Number of households with income $60k - 75k:| Grafton: | 11.0% (1,974) |
| State: | 7.5% (10,239) |
Number of households with income $75k - 100k:| Grafton: | 18.6% (3,330) |
| Massachusetts: | 13.1% (18,032) |
Number of households with income $100k - 125k:| Grafton: | 6.5% (1,157) |
| State: | 9.6% (13,141) |
Number of households with income $125k - 150k:| Grafton: | 8.4% (1,500) |
| State: | 5.0% (6,808) |
Number of households with income $150k - 200k:| Grafton: | 7.9% (1,422) |
| Massachusetts: | 6.4% (8,843) |
Number of households with income > $200k:| Grafton: | 4.4% (790) |
| State: | 9.0% (12,396) |
Median per capita income in Grafton in 2022:| Grafton: | $42,320 |
| State: | $30,797 |