Green Acres, Washington (WA) income map, earnings map, and wages data
The median household income in Green Acres, WA in 2022 was $67,185, which was 35.9% less than the median annual income of $91,306 across the entire state of Washington. Compared to the median income of $36,290 in 2000 this represents an increase of 46.0%. The per capita income in 2022 was $32,279, which means an increase of 52.0% compared to 2000 when it was $15,494.
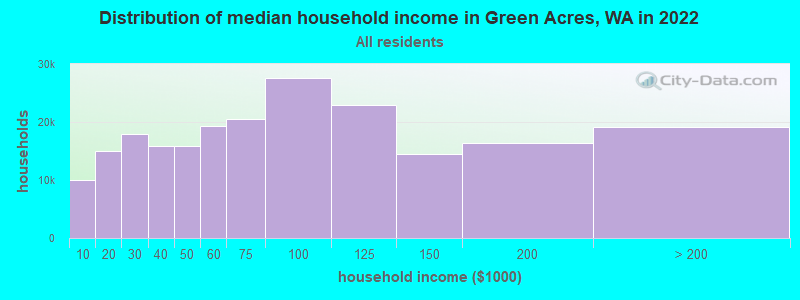
Income statistics for all residents
Median household income in Green Acres, WA in 2022:| Green Acres: | $67,185 |
| Washington: | $91,306 |
Change in median household income between 2000 and 2022:| Green Acres, Washington: | +85.1% |
| Washington: | +99.5% |
Number of households with income < $10k:| Green Acres: | 4.6% (9,971) |
| State: | 4.5% (139,331) |
Number of households with income $10k - 20k:| Green Acres: | 7.0% (15,016) |
| Washington: | 5.0% (154,508) |
Number of households with income $20k - 30k:| Green Acres: | 8.3% (17,912) |
| Washington: | 5.4% (166,555) |
Number of households with income $30k - 40k:| Green Acres: | 7.4% (15,942) |
| State: | 5.5% (170,324) |
Number of households with income $40k - 50k:| Green Acres: | 7.3% (15,776) |
| State: | 6.0% (183,941) |
Number of households with income $50k - 60k:| Green Acres: | 9.0% (19,232) |
| State: | 6.1% (187,395) |
Number of households with income $60k - 75k:| Green Acres: | 9.5% (20,490) |
| Washington: | 8.7% (266,771) |
Number of households with income $75k - 100k:| Green Acres: | 12.8% (27,528) |
| State: | 13.1% (404,672) |
Number of households with income $100k - 125k:| Green Acres: | 10.7% (23,008) |
| State: | 11.0% (337,911) |
Number of households with income $125k - 150k:| Green Acres: | 6.7% (14,430) |
| State: | 8.0% (244,934) |
Number of households with income $150k - 200k:| Green Acres: | 7.6% (16,327) |
| State: | 10.5% (323,812) |
Number of households with income > $200k:| Green Acres: | 8.9% (19,222) |
| State: | 16.2% (499,799) |
Aggregate household income in Green Acres in 2022: $781,595,256
Median family income in Green Acres in 2022:| Green Acres: | $78,842 |
| State: | $109,192 |
Median non-family income in Green Acres in 2022:| Green Acres: | $43,506 |
| Washington: | $57,299 |
Change in median non-family income between 2000 and 2022:| Green Acres, Washington: | +89.2% |
| State: | +94.9% |
Median per capita income in Green Acres in 2022:| Green Acres: | $32,279 |
| Washington: | $50,764 |
Change in median per capita income between 2000 and 2022:| Green Acres, Washington: | +108.3% |
| State: | +121.0% |
Income statistics for White residents
Median household income in Green Acres, WA in 2022:| Green Acres: | $68,025 |
| State: | $91,916 |
Change in median household income between 2000 and 2022:| Green Acres, Washington: | +87.9% |
| State: | +95.4% |
Number of households with income < $10k:| Green Acres: | 4.5% (8,240) |
| State: | 4.3% (95,850) |
Number of households with income $10k - 20k:| Green Acres: | 6.8% (12,607) |
| State: | 4.8% (106,421) |
Number of households with income $20k - 30k:| Green Acres: | 8.1% (14,947) |
| Washington: | 5.5% (122,860) |
Number of households with income $30k - 40k:| Green Acres: | 7.3% (13,354) |
| Washington: | 5.4% (119,627) |
Number of households with income $40k - 50k:| Green Acres: | 7.0% (12,894) |
| State: | 5.9% (132,276) |
Number of households with income $50k - 60k:| Green Acres: | 8.6% (15,857) |
| Washington: | 6.1% (136,212) |
Number of households with income $60k - 75k:| Green Acres: | 9.8% (18,071) |
| Washington: | 8.8% (196,086) |
Number of households with income $75k - 100k:| Green Acres: | 12.9% (23,725) |
| Washington: | 13.4% (299,192) |
Number of households with income $100k - 125k:| Green Acres: | 10.8% (19,885) |
| State: | 11.3% (252,209) |
Number of households with income $125k - 150k:| Green Acres: | 6.6% (12,139) |
| Washington: | 7.9% (175,962) |
Number of households with income $150k - 200k:| Green Acres: | 7.9% (14,634) |
| State: | 10.7% (239,156) |
Number of households with income > $200k:| Green Acres: | 9.7% (17,799) |
| State: | 16.1% (359,917) |
Aggregate household income in Green Acres in 2022: $686,213,026
Median family income in Green Acres in 2022:| Green Acres: | $79,646 |
| Washington: | $112,511 |
Number of families with income < $10k:| Green Acres: | 3.5% (35) |
| Washington: | 2.4% (33,676) |
Number of families with income $10k - 20k:| Green Acres: | 4.1% (40) |
| State: | 2.0% (28,228) |
Number of families with income $20k - 30k:| Green Acres: | 9.9% (97) |
| Washington: | 2.9% (39,288) |
Number of families with income $30k - 40k:| Green Acres: | 10.8% (106) |
| State: | 3.6% (50,190) |
Number of families with income $40k - 50k:| Green Acres: | 10.4% (101) |
| State: | 4.6% (63,009) |
Number of families with income $50k - 60k:| Green Acres: | 13.4% (131) |
| State: | 5.0% (69,270) |
Number of families with income $60k - 75k:| Green Acres: | 11.2% (110) |
| State: | 8.2% (112,369) |
Number of families with income $75k - 100k:| Green Acres: | 13.5% (132) |
| State: | 14.1% (194,214) |
Number of families with income $100k - 125k:| Green Acres: | 13.6% (133) |
| State: | 13.2% (182,184) |
Number of families with income $125k - 150k:| Green Acres: | 9.6% (94) |
| Washington: | 9.5% (130,928) |
Median non-family income in Green Acres in 2022:| Green Acres: | $43,109 |
| State: | $56,103 |
Change in median non-family income between 2000 and 2022:| Green Acres, Washington: | +85.1% |
| Washington: | +87.7% |
Median per capita income in Green Acres in 2022:| Green Acres: | $33,731 |
| Washington: | $55,212 |
Change in median per capita income between 2000 and 2022:| Green Acres, Washington: | +114.9% |
| Washington: | +123.8% |
Income statistics for Black or African American residents
Median household income in Green Acres, WA in 2022:| Green Acres: | $95,460 |
| Washington: | $68,202 |
Change in median household income between 2000 and 2022:| Green Acres, Washington: | +58.4% |
| Washington: | +89.9% |
Number of households with income < $10k:| Green Acres: | 7.2% (13,449) |
| Washington: | 7.2% (8,014) |
Number of households with income $10k - 20k:| Green Acres: | 8.0% (14,942) |
| State: | 8.0% (8,904) |
Number of households with income $20k - 30k:| Green Acres: | 7.4% (13,773) |
| Washington: | 7.4% (8,207) |
Number of households with income $30k - 40k:| Green Acres: | 5.6% (10,438) |
| State: | 5.6% (6,220) |
Number of households with income $40k - 50k:| Green Acres: | 9.5% (17,763) |
| State: | 9.5% (10,585) |
Number of households with income $50k - 60k:| Green Acres: | 7.3% (13,556) |
| State: | 7.3% (8,078) |
Number of households with income $60k - 75k:| Green Acres: | 8.7% (16,285) |
| Washington: | 8.7% (9,704) |
Number of households with income $75k - 100k:| Green Acres: | 12.9% (24,023) |
| Washington: | 12.9% (14,315) |
Number of households with income $100k - 125k:| Green Acres: | 7.7% (14,419) |
| State: | 7.7% (8,592) |
Number of households with income $125k - 150k:| Green Acres: | 8.9% (16,513) |
| State: | 8.9% (9,840) |
Number of households with income $150k - 200k:| Green Acres: | 7.6% (14,154) |
| Washington: | 7.6% (8,434) |
Number of households with income > $200k:| Green Acres: | 9.1% (16,908) |
| Washington: | 9.1% (10,075) |
Aggregate household income in Green Acres in 2022: $2,045,099
Median family income in Green Acres in 2022:| Green Acres: | $99,713 |
| State: | $82,165 |
Number of families with income $30k - 40k:| Green Acres: | 34.5% (6) |
| State: | 5.3% (3,525) |
Number of families with income $60k - 75k:| Green Acres: | 65.5% (12) |
| State: | 9.3% (6,231) |
Median per capita income in Green Acres in 2022:| Green Acres: | $65,091 |
| Washington: | $38,209 |
Change in median per capita income between 2000 and 2022:| Green Acres, Washington: | +132.9% |
| State: | +115.3% |
Income statistics for Asian residents
Number of households with income < $10k:| Green Acres: | 3.3% (36) |
| Washington: | 4.9% (14,099) |
Number of households with income $10k - 20k:| Green Acres: | 8.5% (92) |
| State: | 3.5% (9,873) |
Number of households with income $20k - 30k:| Green Acres: | 4.4% (47) |
| State: | 2.9% (8,352) |
Number of households with income $30k - 40k:| Green Acres: | 9.4% (101) |
| State: | 4.0% (11,415) |
Number of households with income $40k - 50k:| Green Acres: | 4.2% (45) |
| State: | 4.0% (11,421) |
Number of households with income $50k - 60k:| Green Acres: | 11.0% (119) |
| State: | 4.2% (12,100) |
Number of households with income $60k - 75k:| Green Acres: | 6.9% (74) |
| State: | 6.3% (17,903) |
Number of households with income $75k - 100k:| Green Acres: | 19.2% (207) |
| Washington: | 10.4% (29,663) |
Number of households with income $100k - 125k:| Green Acres: | 11.5% (124) |
| Washington: | 9.4% (26,839) |
Number of households with income $125k - 150k:| Green Acres: | 7.5% (81) |
| State: | 8.5% (24,200) |
Number of households with income $150k - 200k:| Green Acres: | 7.9% (85) |
| State: | 12.6% (35,976) |
Number of households with income > $200k:| Green Acres: | 6.3% (68) |
| State: | 29.2% (83,109) |
Median per capita income in Green Acres in 2022:| Green Acres: | $9,403 |
| State: | $67,666 |
Change in median per capita income between 2000 and 2022:| Green Acres, Washington: | +149.1% |
| Washington: | +236.0% |
Income statistics for Hispanic or Latino residents
Median household income in Green Acres, WA in 2022:| Green Acres: | $43,822 |
| Washington: | $74,770 |
Change in median household income between 2000 and 2022:| Green Acres, Washington: | +147.9% |
| Washington: | +128.3% |
Number of households with income < $10k:| Green Acres: | 5.4% (316) |
| Washington: | 4.9% (14,456) |
Number of households with income $10k - 20k:| Green Acres: | 5.2% (307) |
| Washington: | 5.3% (15,449) |
Number of households with income $20k - 30k:| Green Acres: | 7.2% (420) |
| State: | 6.8% (20,016) |
Number of households with income $30k - 40k:| Green Acres: | 10.4% (612) |
| State: | 7.7% (22,548) |
Number of households with income $40k - 50k:| Green Acres: | 7.0% (412) |
| Washington: | 7.3% (21,450) |
Number of households with income $50k - 60k:| Green Acres: | 9.1% (532) |
| State: | 7.7% (22,744) |
Number of households with income $60k - 75k:| Green Acres: | 5.7% (336) |
| State: | 10.5% (30,737) |
Number of households with income $75k - 100k:| Green Acres: | 15.3% (899) |
| Washington: | 14.9% (43,843) |
Number of households with income $100k - 125k:| Green Acres: | 15.5% (911) |
| Washington: | 11.1% (32,554) |
Number of households with income $125k - 150k:| Green Acres: | 6.6% (387) |
| State: | 7.4% (21,624) |
Number of households with income $150k - 200k:| Green Acres: | 7.2% (421) |
| Washington: | 7.3% (21,360) |
Number of households with income > $200k:| Green Acres: | 5.4% (314) |
| Washington: | 9.2% (27,055) |
Aggregate household income in Green Acres in 2022: $3,822,567
Median family income in Green Acres in 2022:| Green Acres: | $6,187 |
| Washington: | $76,866 |
Number of families with income < $10k:| Green Acres: | 4.7% (3) |
| State: | 4.4% (9,443) |
Number of families with income $10k - 20k:| Green Acres: | 5.9% (4) |
| Washington: | 3.5% (7,524) |
Number of families with income $20k - 30k:| Green Acres: | 15.3% (11) |
| Washington: | 5.6% (12,052) |
Number of families with income $30k - 40k:| Green Acres: | 15.5% (11) |
| State: | 8.3% (17,803) |
Number of families with income $40k - 50k:| Green Acres: | 8.0% (6) |
| State: | 7.7% (16,361) |
Number of families with income $50k - 60k:| Green Acres: | 10.9% (8) |
| State: | 7.9% (16,852) |
Number of families with income $60k - 75k:| Green Acres: | 7.4% (5) |
| State: | 11.4% (24,342) |
Number of families with income $75k - 100k:| Green Acres: | 12.7% (9) |
| State: | 14.4% (30,698) |
Number of families with income $100k - 125k:| Green Acres: | 15.1% (11) |
| State: | 11.4% (24,331) |
Number of families with income $125k - 150k:| Green Acres: | 4.6% (3) |
| State: | 7.5% (16,099) |
Median non-family income in Green Acres in 2022:| Green Acres: | $40,878 |
| State: | $54,173 |
Change in median non-family income between 2000 and 2022:| Green Acres, Washington: | +120.1% |
| Washington: | +105.8% |
Median per capita income in Green Acres in 2022:| Green Acres: | $6,510 |
| State: | $28,252 |
Change in median per capita income between 2000 and 2022:| Green Acres, Washington: | +127.3% |
| Washington: | +150.2% |
Income statistics for American Indian and Alaska Native residents
Median household income in Green Acres, WA in 2022:| Green Acres: | $91,358 |
| State: | $71,255 |
Change in median household income between 2000 and 2022:| Green Acres, Washington: | +125.6% |
| State: | +118.1% |
Number of households with income < $10k:| Green Acres: | 5.9% (1,101) |
| State: | 5.9% (1,768) |
Number of households with income $10k - 20k:| Green Acres: | 9.0% (1,680) |
| State: | 8.9% (2,694) |
Number of households with income $20k - 30k:| Green Acres: | 8.0% (1,486) |
| State: | 8.0% (2,412) |
Number of households with income $30k - 40k:| Green Acres: | 7.7% (1,440) |
| Washington: | 7.7% (2,327) |
Number of households with income $40k - 50k:| Green Acres: | 5.9% (1,101) |
| State: | 5.8% (1,755) |
Number of households with income $50k - 60k:| Green Acres: | 7.5% (1,400) |
| State: | 7.5% (2,259) |
Number of households with income $60k - 75k:| Green Acres: | 8.8% (1,651) |
| State: | 8.8% (2,669) |
Number of households with income $75k - 100k:| Green Acres: | 12.7% (2,380) |
| Washington: | 12.8% (3,861) |
Number of households with income $100k - 125k:| Green Acres: | 12.0% (2,246) |
| Washington: | 12.0% (3,618) |
Number of households with income $125k - 150k:| Green Acres: | 8.6% (1,604) |
| State: | 8.6% (2,580) |
Number of households with income $150k - 200k:| Green Acres: | 5.9% (1,097) |
| State: | 5.9% (1,774) |
Number of households with income > $200k:| Green Acres: | 8.0% (1,502) |
| Washington: | 8.1% (2,447) |
Aggregate household income in Green Acres in 2022: $945,849
Median family income in Green Acres in 2022:| Green Acres: | $134,790 |
| Washington: | $79,010 |
Median non-family income in Green Acres in 2022:| Green Acres: | $25,747 |
| State: | $35,591 |
Change in median non-family income between 2000 and 2022:| Green Acres, Washington: | +58.4% |
| State: | +61.8% |
Median per capita income in Green Acres in 2022:| Green Acres: | $21,007 |
| State: | $27,053 |
Change in median per capita income between 2000 and 2022:| Green Acres, Washington: | +97.1% |
| State: | +98.6% |
Income statistics for Multirace residents
Median household income in Green Acres, WA in 2022:| Green Acres: | $62,714 |
| State: | $84,303 |
Change in median household income between 2000 and 2022:| Green Acres, Washington: | +123.7% |
| Washington: | +125.7% |
Number of households with income < $10k:| Green Acres: | 7.6% (1,089) |
| State: | 4.3% (12,040) |
Number of households with income $10k - 20k:| Green Acres: | 7.2% (1,034) |
| Washington: | 6.6% (18,437) |
Number of households with income $20k - 30k:| Green Acres: | 6.4% (919) |
| State: | 5.2% (14,559) |
Number of households with income $30k - 40k:| Green Acres: | 9.7% (1,392) |
| Washington: | 6.7% (18,491) |
Number of households with income $40k - 50k:| Green Acres: | 10.9% (1,570) |
| Washington: | 6.3% (17,459) |
Number of households with income $50k - 60k:| Green Acres: | 10.9% (1,570) |
| Washington: | 6.9% (19,086) |
Number of households with income $60k - 75k:| Green Acres: | 5.6% (801) |
| Washington: | 9.1% (25,310) |
Number of households with income $75k - 100k:| Green Acres: | 10.8% (1,553) |
| State: | 13.5% (37,493) |
Number of households with income $100k - 125k:| Green Acres: | 10.5% (1,510) |
| State: | 10.7% (29,626) |
Number of households with income $125k - 150k:| Green Acres: | 9.2% (1,326) |
| Washington: | 8.6% (23,899) |
Number of households with income $150k - 200k:| Green Acres: | 6.6% (944) |
| Washington: | 10.2% (28,214) |
Number of households with income > $200k:| Green Acres: | 4.5% (644) |
| State: | 11.9% (32,947) |
Aggregate household income in Green Acres in 2022: $6,292,601
Median family income in Green Acres in 2022:| Green Acres: | $85,281 |
| Washington: | $95,629 |
Number of families with income $30k - 40k:| Green Acres: | 100.0% (20) |
| State: | 5.8% (10,186) |
Median non-family income in Green Acres in 2022:| Green Acres: | $24,345 |
| State: | $56,573 |
Median per capita income in Green Acres in 2022:| Green Acres: | $22,669 |
| State: | $32,496 |
Change in median per capita income between 2000 and 2022:| Green Acres, Washington: | +128.6% |
| State: | +156.8% |